

Artificial intelligence-based analysis of the spatial distribution of abnormal computed tomography patterns in SARS-CoV-2 pneumonia: association with disease severity
- PMID: 38200566
- PMCID: PMC10777587
- DOI: 10.1186/s12931-024-02673-w
Artificial intelligence-based analysis of the spatial distribution of abnormal computed tomography patterns in SARS-CoV-2 pneumonia: association with disease severity
Abstract
Background: The substantial heterogeneity of clinical presentations in patients with severe acute respiratory syndrome coronavirus 2 (SARS-CoV-2) pneumonia still requires robust chest computed tomography analysis to identify high-risk patients. While extension of ground-glass opacity and consolidation from peripheral to central lung fields on chest computed tomography (CT) might be associated with severely ill conditions, quantification of the central-peripheral distribution of ground glass opacity and consolidation in assessments of SARS-CoV-2 pneumonia remains unestablished. This study aimed to examine whether the central-peripheral distributions of ground glass opacity and consolidation were associated with severe outcomes in patients with SARS-CoV-2 pneumonia independent of the whole-lung extents of these abnormal shadows.
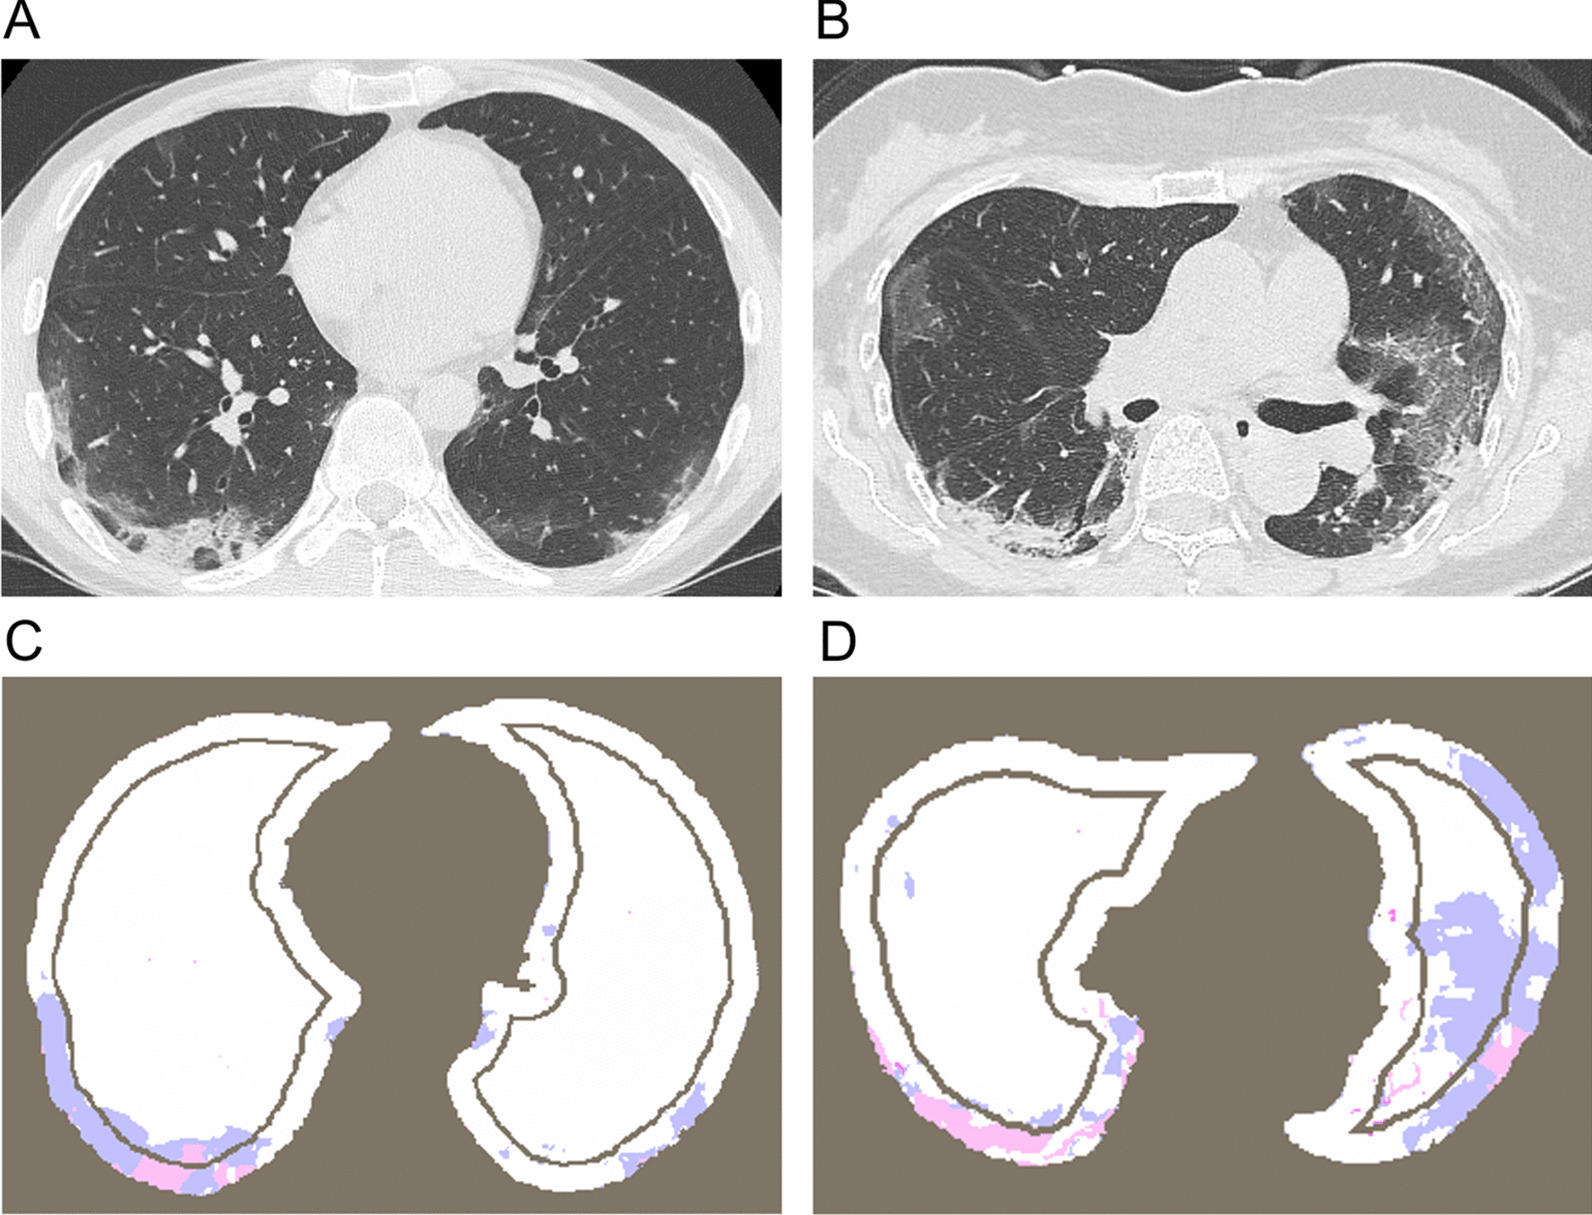
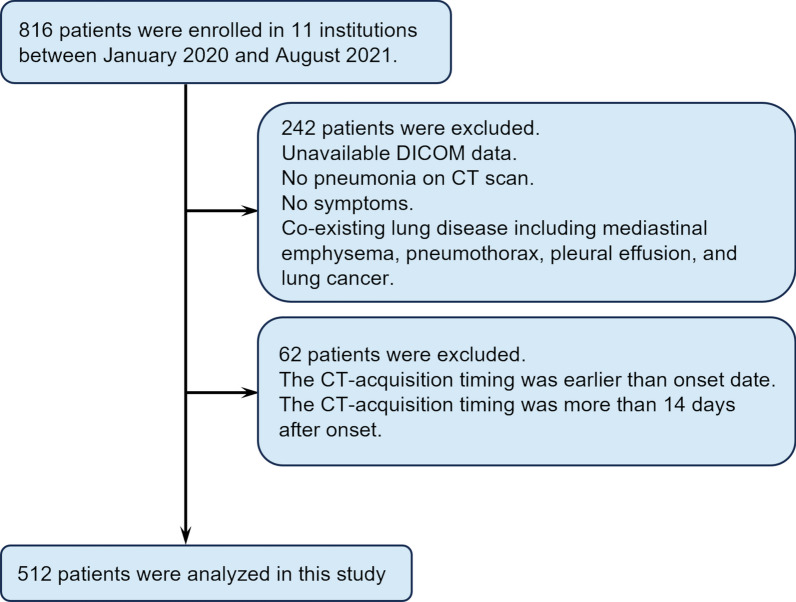
Methods: This multicenter retrospective cohort included hospitalized patients with SARS-CoV-2 pneumonia between January 2020 and August 2021. An artificial intelligence-based image analysis technology was used to segment abnormal shadows, including ground glass opacity and consolidation. The area ratio of ground glass opacity and consolidation to the whole lung (GGO%, CON%) and the ratio of ground glass opacity and consolidation areas in the central lungs to those in the peripheral lungs (GGO(C/P)) and (CON(C/P)) were automatically calculated. Severe outcome was defined as in-hospital death or requirement for endotracheal intubation.
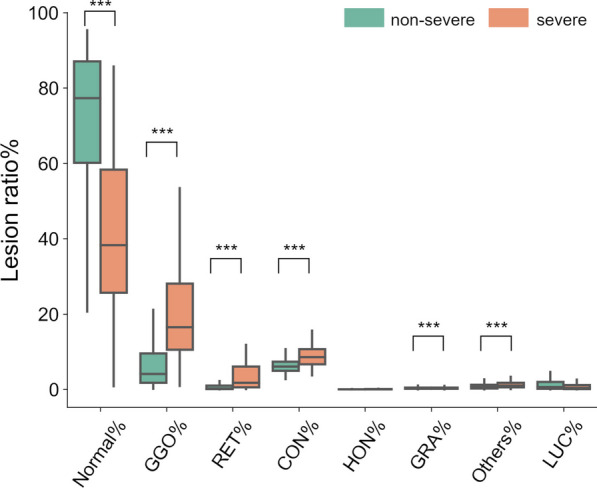
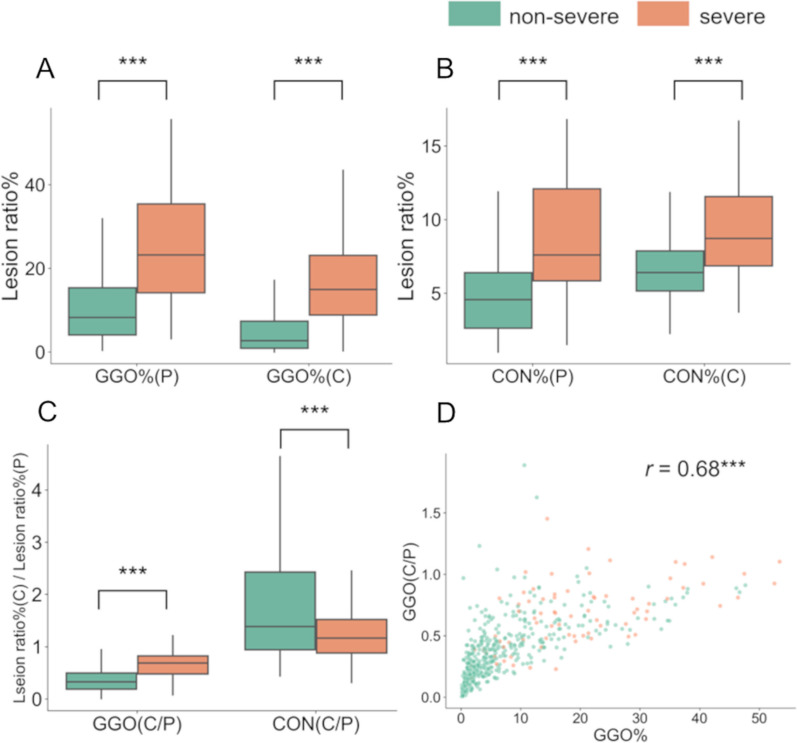
Results: Of 512 enrolled patients, the severe outcome was observed in 77 patients. GGO% and CON% were higher in patients with severe outcomes than in those without. Multivariable logistic models showed that GGO(C/P), but not CON(C/P), was associated with the severe outcome independent of age, sex, comorbidities, GGO%, and CON%.
Conclusion: In addition to GGO% and CON% in the whole lung, the higher the ratio of ground glass opacity in the central regions to that in the peripheral regions was, the more severe the outcomes in patients with SARS-CoV-2 pneumonia were. The proposed method might be useful to reproducibly quantify the extension of ground glass opacity from peripheral to central lungs and to estimate prognosis.
Keywords: COVID-19; Central area; Ground glass opacity; Peripheral area; Pneumonia; Quantitative analysis.
© 2024. The Author(s).
Conflict of interest statement
Naoya Tanabe reports a relationship with Fujifilm Corporation that includes: funding grants. Naoya Tanabe reports a relationship with Daiichi Sankyo Co Ltd that includes: funding grants. Tsuyoshi Oguma reports a relationship with Fujifilm Corporation that includes: funding grants. Tsuyoshi Oguma reports a relationship with Daiichi Sankyo Co Ltd that includes: funding grants. Toyohiro Hirai reports a relationship with Fujifilm Corporation that includes: funding grants. Toyohiro Hirai reports a relationship with Daiichi Sankyo Co Ltd that includes: funding grants.
Figures
Similar articles
-
Primary SARS-CoV-2 Pneumonia Screening in Adults: Analysis of the Correlation Between High-Resolution Computed Tomography Pulmonary Patterns and Initial Oxygen Saturation Levels.Curr Med Imaging. 2022;19(5):486-493. doi: 10.2174/1573405618666220802095119. Curr Med Imaging. 2022. PMID: 35927895
-
Clinical and laboratory data, radiological structured report findings and quantitative evaluation of lung involvement on baseline chest CT in COVID-19 patients to predict prognosis.Radiol Med. 2021 Jan;126(1):29-39. doi: 10.1007/s11547-020-01293-w. Epub 2020 Oct 12. Radiol Med. 2021. PMID: 33047295 Free PMC article.
-
Computed tomography semi-automated lung volume quantification in SARS-CoV-2-related pneumonia.Eur Radiol. 2021 May;31(5):2726-2736. doi: 10.1007/s00330-020-07271-0. Epub 2020 Oct 30. Eur Radiol. 2021. PMID: 33125559 Free PMC article.
-
Similarities and Differences of Early Pulmonary CT Features of Pneumonia Caused by SARS-CoV-2, SARS-CoV and MERS-CoV: Comparison Based on a Systemic Review.Chin Med Sci J. 2020 Sep 30;35(3):254-261. doi: 10.24920/003727. Chin Med Sci J. 2020. PMID: 32972503 Free PMC article.
-
Comparison of the computed tomography findings in COVID-19 and other viral pneumonia in immunocompetent adults: a systematic review and meta-analysis.Eur Radiol. 2020 Dec;30(12):6485-6496. doi: 10.1007/s00330-020-07018-x. Epub 2020 Jun 27. Eur Radiol. 2020. PMID: 32594211 Free PMC article.
References
-
- World Health Organization COVID-19 Situation Report—148. Retrived by June 22. < https://www.who.int/publications/m/item/weekly-epidemiological-update-on.... 2020.
-
- Leonardi A, Scipione R, Alfieri G, Petrillo R, Dolciami M, Ciccarelli F, Perotti S, Cartocci G, Scala A, Imperiale C, et al. Role of computed tomography in predicting critical disease in patients with covid-19 pneumonia: a retrospective study using a semiautomatic quantitative method. Eur J Radiol. 2020;130:109202. doi: 10.1016/j.ejrad.2020.109202. - DOI - PMC - PubMed
Publication types
MeSH terms
Grants and funding
LinkOut - more resources
Full Text Sources
Medical
Miscellaneous
