

Defining type 2 diabetes polygenic risk scores through colocalization and network-based clustering of metabolic trait genetic associations
- PMID: 38200577
- PMCID: PMC10777532
- DOI: 10.1186/s13073-023-01255-7
Defining type 2 diabetes polygenic risk scores through colocalization and network-based clustering of metabolic trait genetic associations
Abstract
Background: Type 2 diabetes (T2D) is a heterogeneous and polygenic disease. Previous studies have leveraged the highly polygenic and pleiotropic nature of T2D variants to partition the heterogeneity of T2D, in order to stratify patient risk and gain mechanistic insight. We expanded on these approaches by performing colocalization across GWAS traits while assessing the causality and directionality of genetic associations.
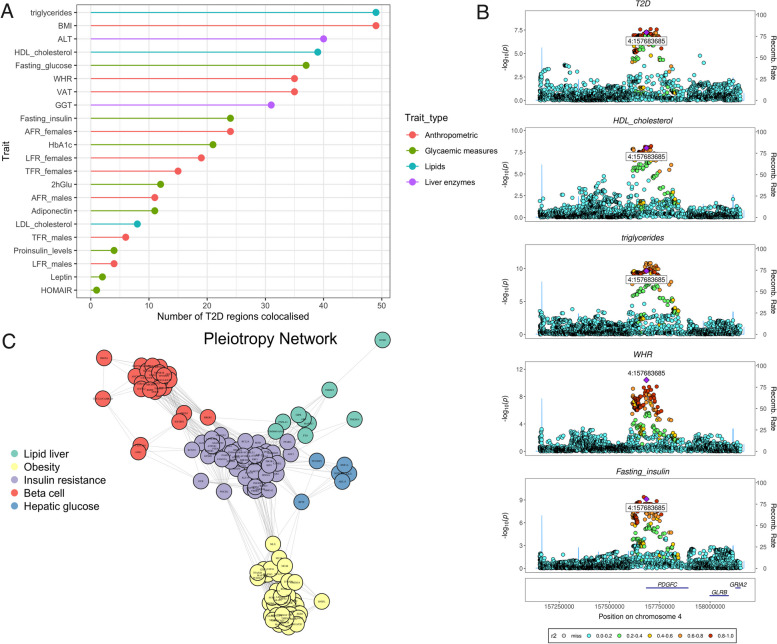
Methods: We applied colocalization between T2D and 20 related metabolic traits, across 243 loci, to obtain inferences of shared casual variants. Network-based unsupervised hierarchical clustering was performed on variant-trait associations. Partitioned polygenic risk scores (PRSs) were generated for each cluster using T2D summary statistics and validated in 21,742 individuals with T2D from 3 cohorts. Inferences of directionality and causality were obtained by applying Mendelian randomization Steiger's Z-test and further validated in a pediatric cohort without diabetes (aged 9-12 years old, n = 3866).
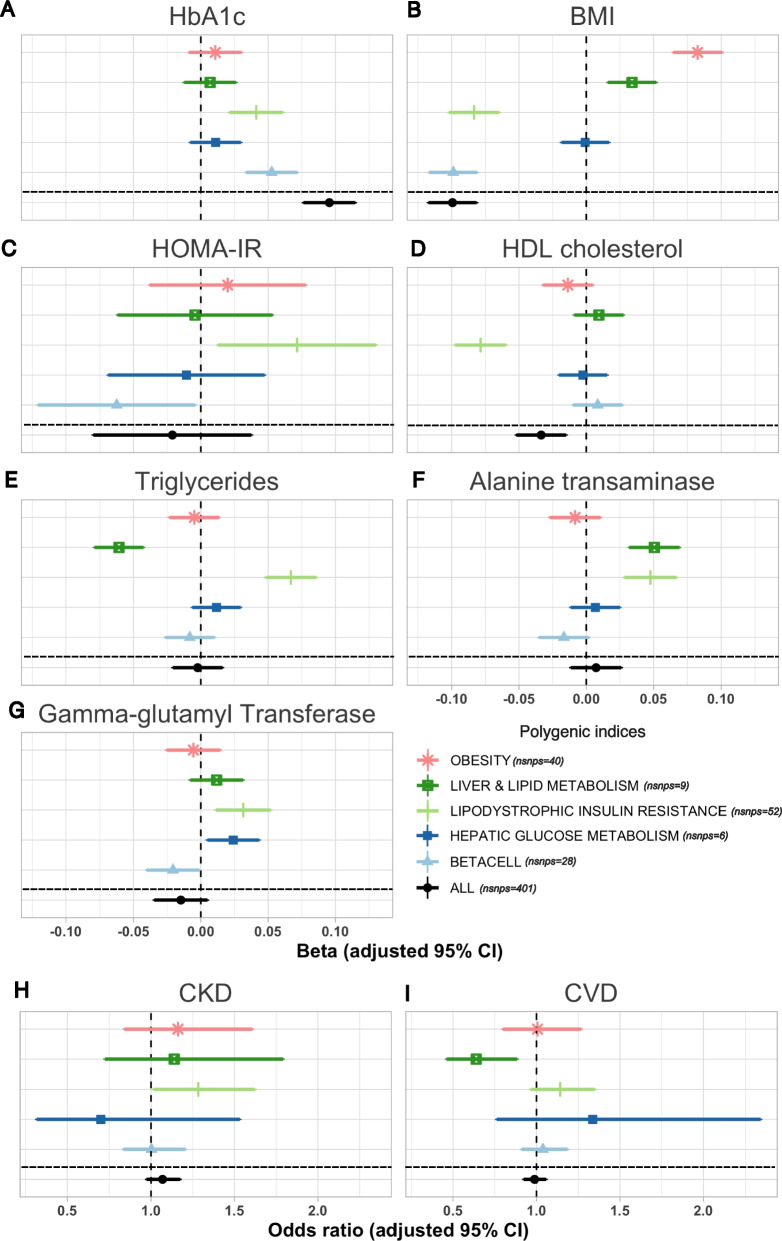
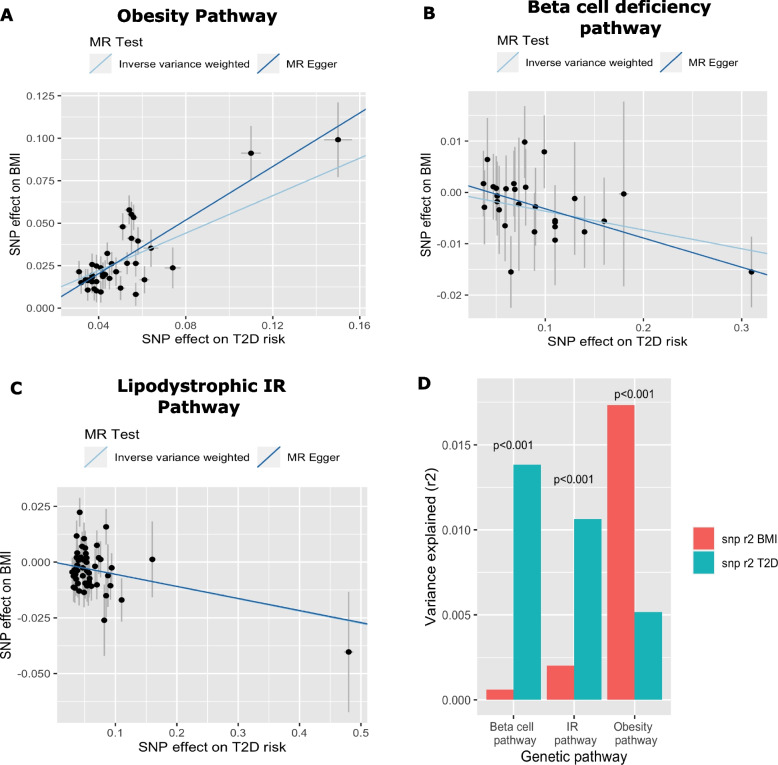
Results: We identified 146 T2D loci that colocalized with at least one metabolic trait locus. T2D variants within these loci were grouped into 5 clusters. The clusters corresponded to the following pathways: obesity, lipodystrophic insulin resistance, liver and lipid metabolism, hepatic glucose metabolism, and beta-cell dysfunction. We observed heterogeneity in associations between PRSs and metabolic measures across clusters. For instance, the lipodystrophic insulin resistance (Beta - 0.08 SD, 95% CI [- 0.10-0.07], p = 6.50 × 10⁻³²) and beta-cell dysfunction (Beta - 0.10 SD, 95% CI [- 0.12, - 0.08], p = 1.46 × 10-47) PRSs were associated to lower BMI. Mendelian randomization Steiger analysis indicated that increased T2D risk in these pathways was causally associated to lower BMI. However, the obesity PRS was conversely associated with increased BMI (Beta 0.08 SD, 95% CI 0.06-0.10, p = 8.0 × 10⁻³³). Analyses within a pediatric cohort supported this finding. Additionally, the lipodystrophic insulin resistance PRS was associated with a higher odds of chronic kidney disease (OR 1.29, 95% CI 1.02-1.62, p = 0.03).
Conclusions: We successfully partitioned T2D genetic variants into phenotypic pathways using a colocalization first approach. Partitioned PRSs were associated to unique metabolic and clinical outcomes indicating successful partitioning of disease heterogeneity. Our work expands on previous approaches by providing stronger inferences of shared causal variants, causality, and directionality of GWAS variant-trait associations.
Keywords: Clustering; Colocalization; Personalized medicine; Polygenic risk score; Type 2 diabetes.
© 2024. The Author(s).
Conflict of interest statement
The authors declare that they have no competing interests.
Figures
Similar articles
-
Type 2 diabetes genetic loci informed by multi-trait associations point to disease mechanisms and subtypes: A soft clustering analysis.PLoS Med. 2018 Sep 21;15(9):e1002654. doi: 10.1371/journal.pmed.1002654. eCollection 2018 Sep. PLoS Med. 2018. PMID: 30240442 Free PMC article.
-
High-throughput genetic clustering of type 2 diabetes loci reveals heterogeneous mechanistic pathways of metabolic disease.Diabetologia. 2023 Mar;66(3):495-507. doi: 10.1007/s00125-022-05848-6. Epub 2022 Dec 20. Diabetologia. 2023. PMID: 36538063 Free PMC article.
-
Type 2 Diabetes Partitioned Polygenic Scores Associate With Disease Outcomes in 454,193 Individuals Across 13 Cohorts.Diabetes Care. 2022 Mar 1;45(3):674-683. doi: 10.2337/dc21-1395. Diabetes Care. 2022. PMID: 35085396 Free PMC article.
-
Genetics of Type 2 Diabetes: Implications from Large-Scale Studies.Curr Diab Rep. 2022 May;22(5):227-235. doi: 10.1007/s11892-022-01462-3. Epub 2022 Mar 19. Curr Diab Rep. 2022. PMID: 35305202 Free PMC article. Review.
-
Genetic Studies of Gestational Diabetes and Glucose Metabolism in Pregnancy.Curr Diab Rep. 2020 Nov 9;20(12):69. doi: 10.1007/s11892-020-01355-3. Curr Diab Rep. 2020. PMID: 33165656 Free PMC article. Review.
Cited by
-
Sex Hormone-Related Pathogenic Genes in Multiple Sclerosis: A Multi-omics Mendelian Randomization Study.J Mol Neurosci. 2025 Apr 26;75(2):58. doi: 10.1007/s12031-025-02347-2. J Mol Neurosci. 2025. PMID: 40285955
-
Mapping disease loci to biological processes via joint pleiotropic and epigenomic partitioning.medRxiv [Preprint]. 2025 May 22:2025.05.05.25327017. doi: 10.1101/2025.05.05.25327017. medRxiv. 2025. PMID: 40385425 Free PMC article. Preprint.
-
Investigating misclassification of type 1 diabetes in a population-based cohort of British Pakistanis and Bangladeshis using polygenic risk scores.Sci Rep. 2025 Jan 13;15(1):1168. doi: 10.1038/s41598-024-80348-8. Sci Rep. 2025. PMID: 39805939 Free PMC article.
-
HumanIslets: An integrated platform for human islet data access and analysis.bioRxiv [Preprint]. 2024 Jun 22:2024.06.19.599613. doi: 10.1101/2024.06.19.599613. bioRxiv. 2024. PMID: 38948734 Free PMC article. Preprint.
-
Diabetes Management Based on the Phenotype and Stage of the Disease: An Expert Proposal from the AGORA Diabetes Collaborative Group.J Clin Med. 2024 Aug 16;13(16):4839. doi: 10.3390/jcm13164839. J Clin Med. 2024. PMID: 39200982 Free PMC article. Review.
References
-
- Aronoff SL, et al. Glucose metabolism and regulation: beyond insulin and glucagon. Diabetes Spectrum. 2004;17(3):183–190. doi: 10.2337/diaspect.17.3.183. - DOI
-
- Mahajan A, et al. Fine-mapping type 2 diabetes loci to single-variant resolution using high-density imputation and islet-specific epigenome maps. Nat Genet. 2018;50(11):1505–13. https://diagram-consortium.org/downloads.html. - PMC - PubMed
Publication types
MeSH terms
Grants and funding
LinkOut - more resources
Full Text Sources
Medical
