. 2024 Jan 11;43(1):18.
doi: 10.1186/s13046-024-02944-w.

Marinopyrrole derivative MP1 as a novel anti-cancer agent in group 3 MYC-amplified Medulloblastoma

Affiliations

Marinopyrrole derivative MP1 as a novel anti-cancer agent in group 3 MYC-amplified Medulloblastoma

Don W Coulter et al. J Exp Clin Cancer Res. .

Abstract

Background: Medulloblastoma (MB) patients with MYC oncogene amplification or overexpression exhibit extremely poor prognoses and therapy resistance. However, MYC itself has been one of the most challenging targets for cancer treatment. Here, we identify a novel marinopyrrole natural derivative, MP1, that shows desirable anti-MYC and anti-cancer activities in MB.

Methods: In this study, using MYC-amplified (Group 3) and non-MYC amplified MB cell lines in vitro and in vivo, we evaluated anti-cancer efficacies and molecular mechanism(s) of MP1.

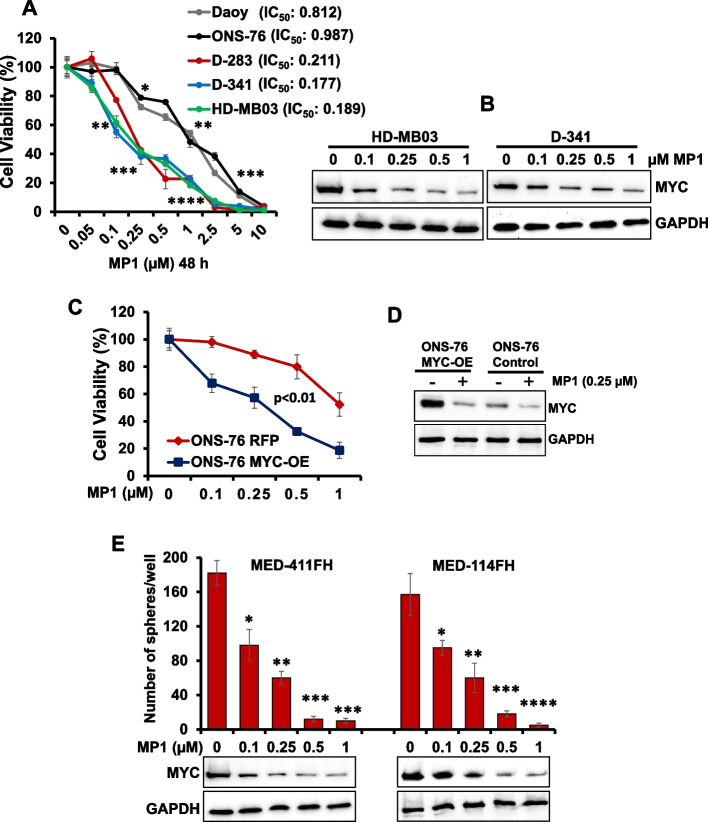
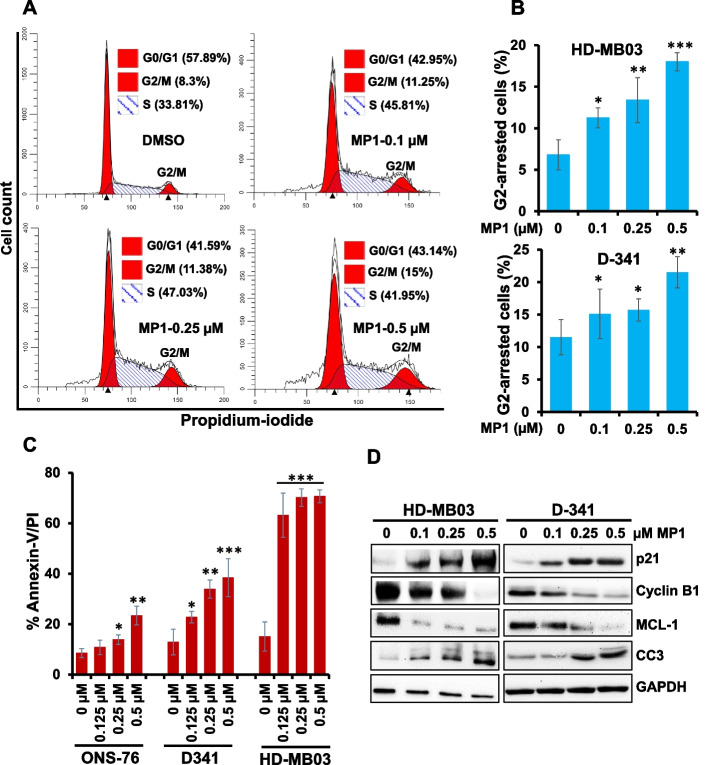
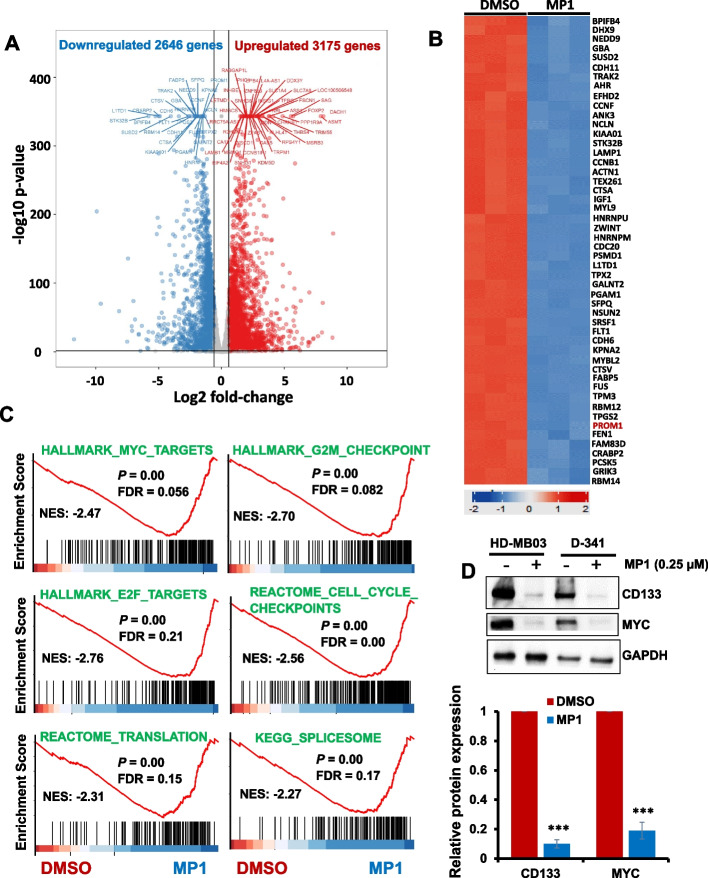
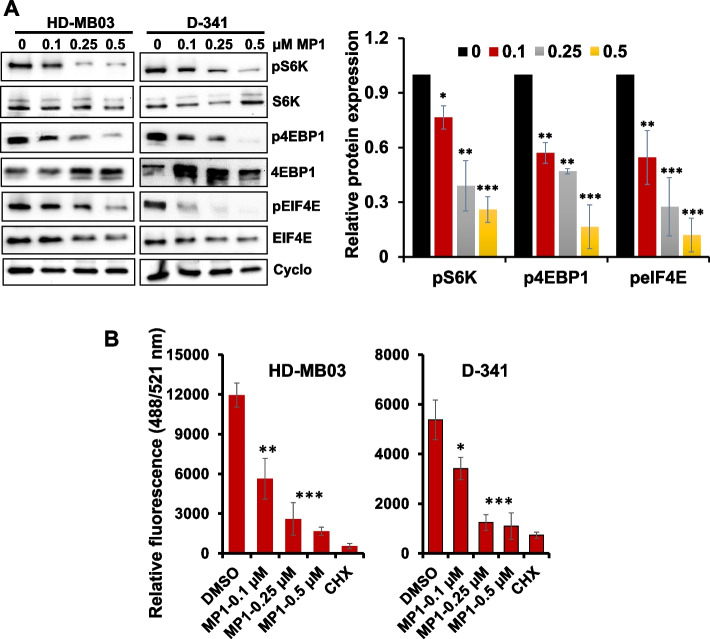
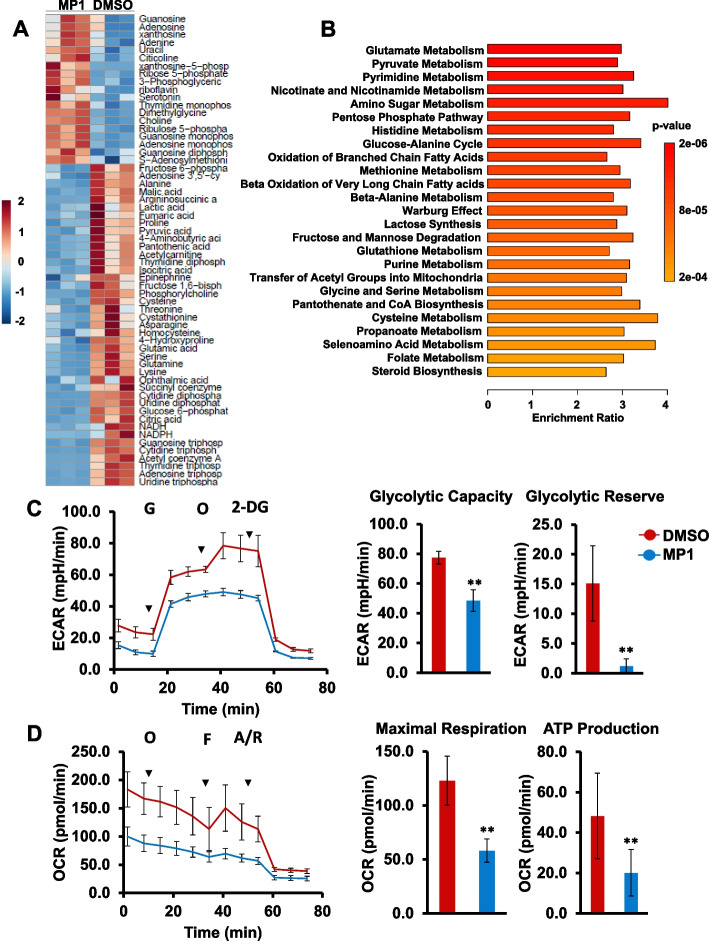
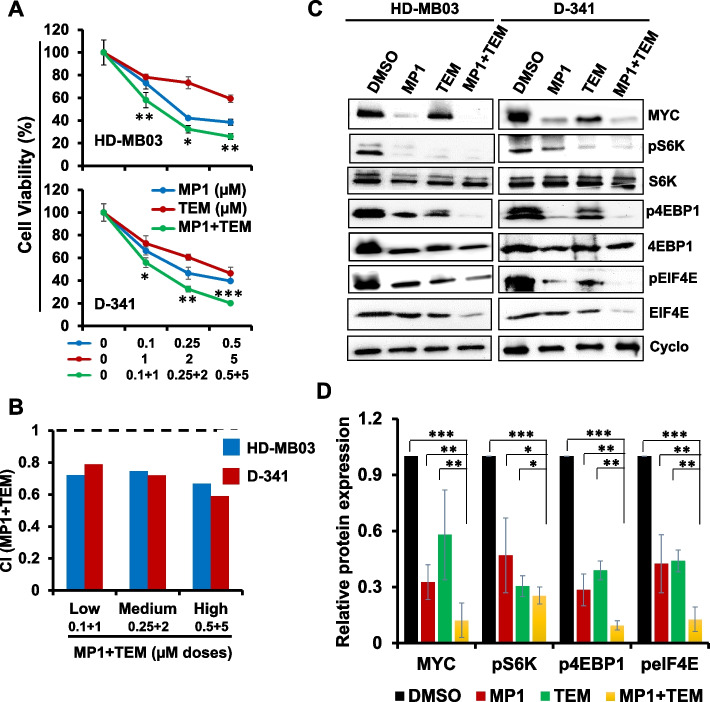
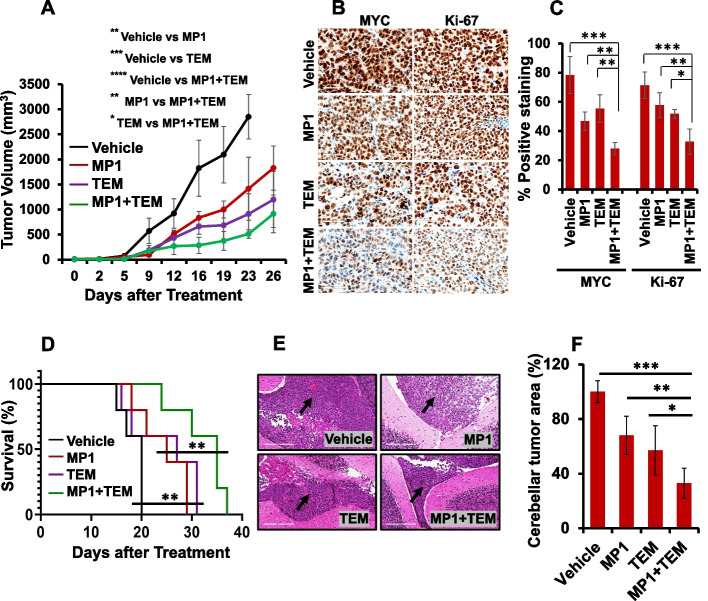
Results: MP1 significantly suppressed MB cell growth and sphere counts and induced G2 cell cycle arrest and apoptosis in a MYC-dependent manner. Mechanistically, MP1 strongly downregulated the expression of MYC protein. Our results with RNA-seq revealed that MP1 significantly modulated global gene expression and inhibited MYC-associated transcriptional targets including translation/mTOR targets. In addition, MP1 inhibited MYC-target metabolism, leading to declined energy levels. The combination of MP1 with an FDA-approved mTOR inhibitor temsirolimus synergistically inhibited MB cell growth/survival by downregulating the expression of MYC and mTOR signaling components. Our results further showed that as single agents, both MP1 and temsirolimus, were able to significantly inhibit tumor growth and MYC expression in subcutaneously or orthotopically MYC-amplified MB bearing mice. In combination, there were further anti-MB effects on the tumor growth and MYC expression in mice.

Conclusion: These preclinical findings highlight the promise of marinopyrrole MP1 as a novel MYC inhibition approach for MYC-amplified MB.

Keywords: MP1; MYC; Marinopyrroles; Medulloblastoma; Metabolism; mTOR/translation.


Conflict of interest statement

The authors declare that they have no competing interest.

Figures

Fig. 1
Fig. 1
Inhibitory effects of MP1 on MB cell growth and MYC protein expression. A MTT (cell growth) assay showing dose-dependent growth effects of MP1 with the low-µM doses as indicated, in MB cell lines (with corresponding IC50) at 48 h. Percentage of viable cells is relative to DMSO- (solvent control)-treated cells. Plotted values and error bars represent mean ± SEM. B Western blot results show dose-dependent effect of MP1 on MYC protein expression in MYC-amplified MB cell lines at 24 h. C MTT assay showing the sensitization of MYC overexpressed ONS-76 (ONS-76 MYC-OE) cells to MP1 (48 h) treatment compared to the control ONs-76 RFP cells. Plotted values and error bars represent mean ± SEM. Control ONS-76 vs ONS-76 MYC-OE; p < 0.01 (Student-t-test). D MYC protein expression in MYC overexpressed ONS-76 and ONS-76 control cells treated with 0.25 µM MP1 for 24 h. E Quantification of the number of spheres following dose-dependent treatment of MP1 in two PDX-derived MB cell lines (MED-411FH, MED-114FH) at 72 h. Values, mean ± SEM. *p < 0.05; **p < 0.01; ***p < 0.005; ****p < 0.001 (Student-t-test). Below are western blot results showing corresponding changes in MYC protein expression after MP1 treatment. GAPDH was used as the loading control in all western blot experiments presented in this figure
Fig. 2
Fig. 2
MP1 arrests G2-cell cycle and induces apoptosis. A Representative flow diagrams for cell cycle distribution of MYC-amplified MB cell line HD-MB03 following dose-dependent treatment with MP1 for 24 h and then staining with propidium-iodide (PI). B Quantification of the percentage of G2-phase arrested cells following treatment of two MYC-amplified (HD-MB03, D-341) cell lines with MP1 across a dose range for 24 h. The results shown here reflect three replicates. Values, mean ± SEM. *p < 0.05; **p < 0.01; ***p < 0.005 (Student-t-test). This p-value denotes significance between 0 (DMSO solvent) and each MP1 treatment. C Bar graphs show flow cytometry-derived quantification of Annexin-V/PI double positive apoptotic cells in two MYC-amplified (HD-MB03, D-341) and one non-MYC-amplified (ONS-76) MB cell lines treated with MP1 as indicated. Results are representative of three independent experiments. Plotted values and error bars represent mean ± SEM. *p < 0.05; **p < 0.01; ****p < 0.001 (Student-t-test). The p-values denote significance between 0 (DMSO-control) and each MP1 treatment. D Western blotting for the expression of proteins associated with G2 phase of the cell cycle (Cyclin B1, p21) and apoptosis (MCL-1, Cleaved-caspase 3) in MP1 treated HD-MB03 and D-341 cells (as indicated) for 24 h. Vinculin was used as the loading control in this experiment
Fig. 3
Fig. 3
Effects of MP1 on global gene expression. Using RNA-seq, gene expression studies were performed in HD-MB03 cells 24 h after treatment with DMSO (vehicle control) or MP1 (0.25 µM). A Volcano plot showing total number of genes significantly upregulated or downregulated by MP1, compared to DMSO. B Heatmap showing the top 50 genes most significantly downregulated by MP1 treatment. C GSE analysis for the enrichment/modulation of cancer target gene sets (including MYC-associated target gene sets) by MP1, compared to DMSO. FDR, false discovery rate. D Western blotting for the expression of CD133 (one of the top 50 downregulated genes by MP1) along with MYC protein in HD-MB03 and D-341 cell lines treated with 0.25 µM MP1 for 24 h. GAPDH was used as the loading control in this experiment. Bar graphs show the quantification of expression of key target proteins (shown in western blot images) relative to the DMSO control in the combined blots of HD-MB03 and D-341 cells after GAPDH (loading control) normalization using Image-J software. The values represent the mean ± SEM of three blot replicates. ***p < 0.001 (Student t test, DMSO vs. MP1)
Fig. 4
Fig. 4
Effects of MP1 on translation pathway. A Western blot images for the expression of translation/mTOR components signaling in two MYC-amplified MB cell lines following treatment with MP1 in a dose-dependent manner for 24 h. Cyclophillin B was used as the loading control in these experiments. Bar graphs show the quantification of expression of key target proteins (shown in western blot images) relative to the DMSO (“0” treatment) control in the combined blots of HD-MB03 and D-341 cells after Cyclophillin B (loading control) normalization using Image-J software. The values represent the mean ± SEM of three blot replicates. The values represent the mean ± SEM of three blot replicates. *p < 0.05; **p < 0.01; ***p < 0.001 (Student t test, DMSO vs. MP1 treatments). B Overall protein synthesis measurement by OPP-incorporation following treatment with MP1 for 24 h. CHX (50 μg/ml, 1 h) was used as a positive control for protein synthesis inhibition. Values represent mean ± SEM. *p < 0.05; **p < 0.01; ***p < 0.005 (Student-t-test)
Fig. 5
Fig. 5
MP1 treatment alters energy metabolism in MB. A Heatmap showing top 60 metabolites altered in HD-MB03 cells treated with MP1 (0.25 µM) in triplicate for 24 h. Color intensity represents the magnitude of alteration in individual metabolites. Scale for color intensity is shown adjacent to the heatmap. B Pathway analysis showing significantly altered metabolic pathways in MP1 treated HD-MB03 cells, compared to DMSO solvent. Scale under the pathway plot shows the fold enrichment and color scale adjacent to pathway plot indicates significance (p-value) for altered pathways. C Extracellular acidification rate (ECAR) analysis for glycolytic activities in HD-MB03 cells after treatment with 0.25 µM MP1 for 24 h. G, glucose; O, oligomycin; 2-DG, 2-deoxyglucose. The bar graphs show glycolytic capacity and glycolytic reserve activities derived from ECAR activities shown in line graph. The results represent the mean ± SEM of three replicates. **p < 0.01 (Student t test, DMSO vs MP1). D Oxygen consumption rate (OCR) analysis for mitochondrial oxidative phosphorylation status in HD-MB03 cells after treatment with 0.25 µM MP1 for 24 h. O, oligomycin; F, FCCP; A/R, antimycin/rotenone. The bar graphs show maximal respiration and ATP production activities derived from OCR activities shown in line graph. The results represent the mean ± SEM of three replicates. **p < 0.01 (Student t test, DMSO vs MP1)
Fig. 6
Fig. 6
Synergistic effects of MP1 and temsirolimus (TEM) on MB cell growth. A Cell viability (MTT) assay showing dose-dependent growth effects of combined MP1-TEM in two MYC-amplified MB cell lines at 48 h. Viable cells (%) is relative to DMSO-treated cells. Values represent mean ± SEM. B Bar graphs show combination index (CI) analyses for the synergism of MP1 and TEM in MB cell lines. C Western blot images for the expression of key components of MYC and translation/mTOR signaling in two MYC-amplified MB cell lines following treatment with MP1 (0.25 µM) and TEM (2 µM) alone or combined for 24 h. Cyclophilin B (Cyclo) was used as the loading control in these analyses. D Bar graphs show the quantification of expression of key target proteins (shown in western blot images) relative to the DMSO control in the combined blots of HD-MB03 and D-341 cells after Cyclophillin B (loading control) normalization using ImageJ software. The values represent the mean ± SEM of three blot replicates. *p < 0.05; **p < 0.01; ***p < 0.001 (Student t test, vehicle/ or single agents vs. combination)
Fig. 7
Fig. 7
Combined in vivo effects of MP1 and temsirolimus (TEM) in subcutaneous and orthotopic MYC-MB bearing xenografts. A Tumor volume measurement of subcutaneously xenografted mice (n = 5 each group) following treatments. The differences between treatment groups represent ANOVA-based comparison of the tumor volumes 23 days post-treatment. *p < 0.05; **p < 0.02; ***p < 0.005; ****p < 0.001. B Representative IHC images (40 × magnification with 60 µm scale bar) of MYC and Ki-67 in treated subcutaneous xenografts. C The percentages of MYC and Ki-67 positive cells derived from histology scores were semi-quantified in the subcutaneous tumors of three xenografted mice following 21 days of treatment with inhibitors. *p < 0.05; **p < 0.01; ***p < 0.001 (ANOVA). D Survival analysis of orthotopic MYC-amplified MB-bearing mice (n = 5 each group) using Kaplan–Meier method. The survival comparisons between treatment groups (Vehicle vs. single agents or single agents vs. combination) were determined using the log-rank test. E Representative H&E images (20 × magnification with 200 µm scale bar) with an arrow bar showing the tumor growth in mouse cerebellum with each treatment. (F) Bar graph shows the quantification of H&E-stained tumor area in the cerebellum of each treatment group (n = 3) using Image-J. Tumor area in the treatment groups was calculated as percentages normalized to the tumor area in the control (vehicle treatment) group. *p < 0.05; **p < 0.01; ***p < 0.001 (ANOVA)

Similar articles

Cited by

References

    1. Ostrom QT, Patil N, Cioffi G, Waite K, Kruchko C, Barnholtz-Sloan JS. CBTRUS statistical report: primary brain and other central nervous system tumors diagnosed in the United States in 2013–2017. Neuro Oncol. 2020;22:iv1–iv96. doi: 10.1093/neuonc/noaa200. - DOI - PMC - PubMed
    1. Choi JY. Medulloblastoma: current perspectives and recent Advances. Brain Tumor Res Treat. 2023;11:28–38. doi: 10.14791/btrt.2022.0046. - DOI - PMC - PubMed
    1. Taylor MD, Northcott PA, Korshunov A, Remke M, Cho YJ, Clifford SC, Eberhart CG, Parsons DW, Rutkowski S, Gajjar A, et al. Molecular subgroups of medulloblastoma: the current consensus. Acta Neuropathol. 2012;123:465–472. doi: 10.1007/s00401-011-0922-z. - DOI - PMC - PubMed
    1. Cavalli FMG, Remke M, Rampasek L, Peacock J, Shih DJH, Luu B, Garzia L, Torchia J, Nor C, Morrissy AS, et al. Intertumoral Heterogeneity within Medulloblastoma Subgroups. Cancer Cell. 2017;31(737–754):e736. - PMC - PubMed
    1. Northcott PA, Buchhalter I, Morrissy AS, Hovestadt V, Weischenfeldt J, Ehrenberger T, Grobner S, Segura-Wang M, Zichner T, Rudneva VA, et al. The whole-genome landscape of medulloblastoma subtypes. Nature. 2017;547:311–317. doi: 10.1038/nature22973. - DOI - PMC - PubMed

LinkOut - more resources