

Stratifying esophago-gastric cancer treatment using a patient-derived organoid-based threshold
- PMID: 38200602
- PMCID: PMC10777586
- DOI: 10.1186/s12943-023-01919-3
Stratifying esophago-gastric cancer treatment using a patient-derived organoid-based threshold
Abstract
Background and aims: This study sought to determine the value of patient-derived organoids (PDOs) from esophago-gastric adenocarcinoma (EGC) for response prediction to neoadjuvant chemotherapy (neoCTx).
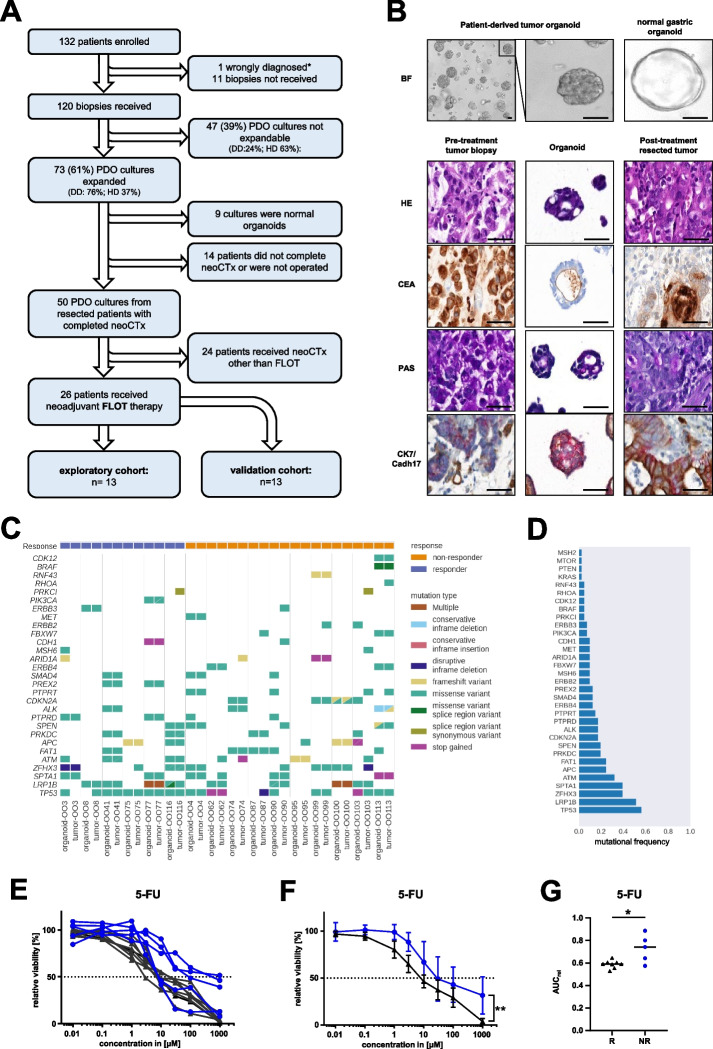
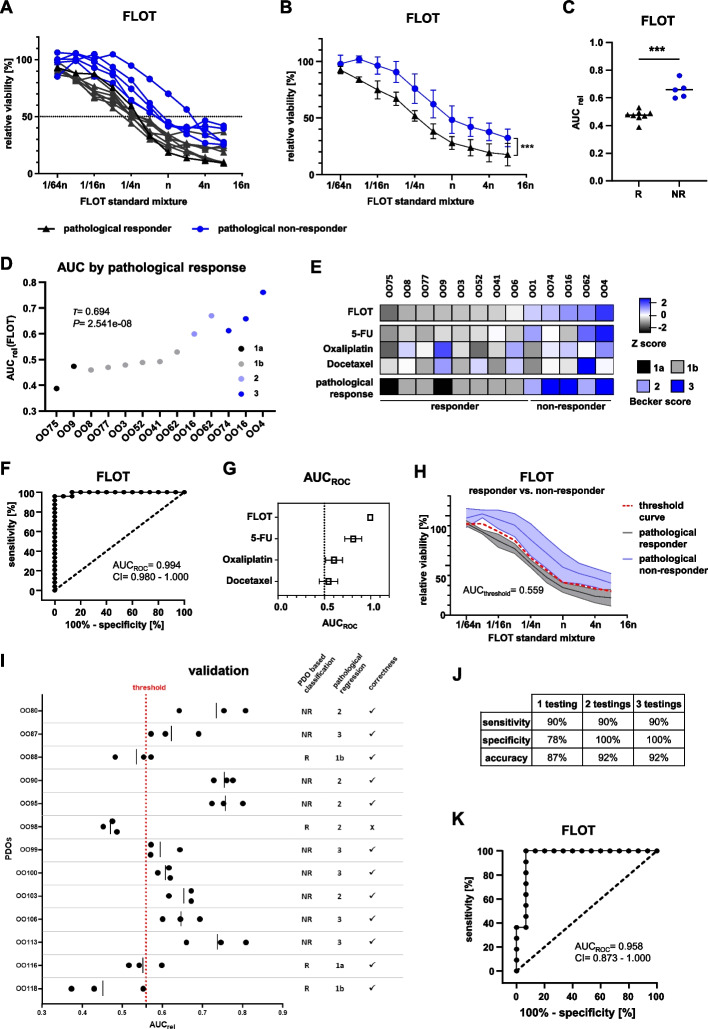
Methods: Endoscopic biopsies of patients with locally advanced EGC (n = 120) were taken into culture and PDOs expanded. PDOs' response towards the single substances of the FLOT regimen and the combination treatment were correlated to patients' pathological response using tumor regression grading. A classifier based on FLOT response of PDOs was established in an exploratory cohort (n = 13) and subsequently confirmed in an independent validation cohort (n = 13).
Results: EGC PDOs reflected patients' diverse responses to single chemotherapeutics and the combination regimen FLOT. In the exploratory cohort, PDOs response to single 5-FU and FLOT combination treatment correlated with the patients' pathological response (5-FU: Kendall's τ = 0.411, P = 0.001; FLOT: Kendall's τ = 0.694, P = 2.541e-08). For FLOT testing, a high diagnostic precision in receiver operating characteristic (ROC) analysis was reached with an AUCROC of 0.994 (CI 0.980 to 1.000). The discriminative ability of PDO-based FLOT testing allowed the definition of a threshold, which classified in an independent validation cohort FLOT responders from non-responders with high sensitivity (90%), specificity (100%) and accuracy (92%).
Conclusion: In vitro drug testing of EGC PDOs has a high predictive accuracy in classifying patients' histological response to neoadjuvant FLOT treatment. Taking into account the high rate of successful PDO expansion from biopsies, the definition of a threshold that allows treatment stratification paves the way for an interventional trial exploring PDO-guided treatment of EGC patients.
Keywords: Gastric cancer; Patient-derived organoids; Personalized medicine; Response prediction.
© 2024. The Author(s).
Conflict of interest statement
Albrecht Stenzinger
Consulting or Advisory role: Aignostics, Amgen, Astra Zeneca, Bayer, BMS, Eli Lilly, Illumina, Incyte, Janssen, MSD, Novartis, Pfizer, Qlucore, Roche, Seattle Genetics, Takeda, Thermo Fisher.
Research Funding: Bayer, BMS, Chugai, Incyte.
Dirk Jaeger
Consulting or Advisory role: Amgen, BMS, Cure Vac, Definierens, F. Hoffmann-La Roche, Genmab A-S, Life Science Inkubator and Vaxxim, Zelluna, OncoOne Research Development.
Gunnar Folprecht
Research Funding: Merck.
Honoraria, Consulting or Advisory Role: Merck, Roche, Amgen, Lilly, Sanofi-Aventis, Servier, Bayer, BMS and MSD.
Georg M. Haag
Consulting or Advisory role: Bristol-Myers Squibb, MSD Sharp & Dohme, Lilly, Novartis; Daiichi Sankyo; Servier; MSD Sharp & Dohme.
Research Funding: Nordic Pharma, Taiho Pharmaceutical, MSD Sharp & Dohme.
Travel, Accommodations, Expenses: Bristol-Myers Squibb, Lilly, Servier and MSD Sharp & Dohme.
Karin Laaber
Current Employment: Merck KGaA.
Ronald Koschny
Honorary Lectures: Abbvie, Sanofi-Aventis, Bristol-Myers Squibb, Bayer Vital, Norgine.
Daniel E. Stange
Research Funding: Ardeypharm.
No disclosures were reported by the other authors.
Figures
References
-
- Al-Batran S-E, Homann N, Pauligk C, Goetze TO, Meiler J, Kasper S, et al. Perioperative chemotherapy with fluorouracil plus leucovorin, oxaliplatin, and docetaxel versus fluorouracil or capecitabine plus cisplatin and epirubicin for locally advanced, resectable gastric or gastro-oesophageal junction adenocarcinoma (FLOT4): a ra. Lancet. 2019;393(10184):1948–1957. doi: 10.1016/S0140-6736(18)32557-1. - DOI - PubMed
-
- Al-Batran SE, Hofheinz RD, Pauligk C, Kopp HG, Haag GM, Luley KB, et al. Histopathological regression after neoadjuvant docetaxel, oxaliplatin, fluorouracil, and leucovorin versus epirubicin, cisplatin, and fluorouracil or capecitabine in patients with resectable gastric or gastro-oesophageal junction adenocarcinoma (FLOT4-AIO. Lancet Oncol. 2016;17(12):1697–1708. doi: 10.1016/S1470-2045(16)30531-9. - DOI - PubMed
-
- Sato T, Stange DE, Ferrante M, Vries RGJ, Van Es JH, Van Den Brink S, et al. Long-term expansion of epithelial organoids from human colon, adenoma, adenocarcinoma, and Barrett’s epithelium. Gastroenterology. 2011;141(5):1762–72. Available from: 10.1053/j.gastro.2011.07.050 - PubMed
Publication types
MeSH terms
Substances
LinkOut - more resources
Full Text Sources
Medical
