. 2024 Mar 1;35(3):281-298.
doi: 10.1681/ASN.0000000000000294. Epub 2024 Jan 11.

Renal Mitochondrial ATP Transporter Ablation Ameliorates Obesity-Induced CKD

Affiliations

Renal Mitochondrial ATP Transporter Ablation Ameliorates Obesity-Induced CKD

Anna Permyakova et al. J Am Soc Nephrol. .

Abstract

Significance statement: This study sheds light on the central role of adenine nucleotide translocase 2 (ANT2) in the pathogenesis of obesity-induced CKD. Our data demonstrate that ANT2 depletion in renal proximal tubule cells (RPTCs) leads to a shift in their primary metabolic program from fatty acid oxidation to aerobic glycolysis, resulting in mitochondrial protection, cellular survival, and preservation of renal function. These findings provide new insights into the underlying mechanisms of obesity-induced CKD and have the potential to be translated toward the development of targeted therapeutic strategies for this debilitating condition.

Background: The impairment in ATP production and transport in RPTCs has been linked to the pathogenesis of obesity-induced CKD. This condition is characterized by kidney dysfunction, inflammation, lipotoxicity, and fibrosis. In this study, we investigated the role of ANT2, which serves as the primary regulator of cellular ATP content in RPTCs, in the development of obesity-induced CKD.

Methods: We generated RPTC-specific ANT2 knockout ( RPTC-ANT2-/- ) mice, which were then subjected to a 24-week high-fat diet-feeding regimen. We conducted comprehensive assessment of renal morphology, function, and metabolic alterations of these mice. In addition, we used large-scale transcriptomics, proteomics, and metabolomics analyses to gain insights into the role of ANT2 in regulating mitochondrial function, RPTC physiology, and overall renal health.

Results: Our findings revealed that obese RPTC-ANT2-/- mice displayed preserved renal morphology and function, along with a notable absence of kidney lipotoxicity and fibrosis. The depletion of Ant2 in RPTCs led to a fundamental rewiring of their primary metabolic program. Specifically, these cells shifted from oxidizing fatty acids as their primary energy source to favoring aerobic glycolysis, a phenomenon mediated by the testis-selective Ant4.

Conclusions: We propose a significant role for RPTC-Ant2 in the development of obesity-induced CKD. The nullification of RPTC-Ant2 triggers a cascade of cellular mechanisms, including mitochondrial protection, enhanced RPTC survival, and ultimately the preservation of kidney function. These findings shed new light on the complex metabolic pathways contributing to CKD development and suggest potential therapeutic targets for this condition.


Conflict of interest statement

H. Amal reports Consultancy: Beyond Air. Inc. and Point6 Bio Ltd.; Ownership Interest: Beyond Air. Inc.; Research Funding: Beyond Air. Inc.; and Patents or Royalties: Hebrew University. M. Berger reports Patents or Royalties: Yissum. R. Cinar reports Patents or Royalties co-inventor for US patents as being US Federal Government employee. G. Kunos reports Patents or Royalties: Inversago Pharma, Inc. G. Leibowitz reports Consultancy: AstraZeneca, Medtronic, Merck-Serono, and Novo Nordik. J. Tam reports Consultancy: BioNanoSim and SciSpark; Ownership Interest: BioNanoSim, Clearmind Medicine, and EPM; Research Funding: BioNanoSim, Clearmind Medicine, and EPM; and Advisory or Leadership Role: BioNanoSim, EPM, and SciSpark. All remaining authors have nothing to disclose.

Figures

None
Graphical abstract
Figure 1
Figure 1
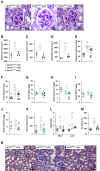
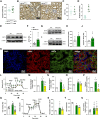
RPTC-ANT2−/− mice are protected from obesity-induced kidney injury and interstitial fibrosis. RPTC-ANT2−/− mice and their WT littermate controls were fed either a STD or a HFD for 24 weeks. (A–D) Kidney PAS staining (A) and the quantification of glomerular (B), Bowman's space (C), and mesangial matrix (D) areas (n=3–4 mice per group). (E and F) Biochemical measurements of urinary albumin-to-creatinine ratio (E) and the urine albumin levels (F) (n=8–9 mice per group). (G–K) Assessment of the kidney injury markers: renal NGAL (G), cystatin C (H), TIMP1 (I), clusterin (J), and urine clusterin (K) (n=3–9 mice per group). (L) Gene expression levels of renal Mcp1 and Lcn2 (n=7–10 mice per group). (M and N) Trichrome renal fibrogenesis quantification (M) and its representative staining (N) (n=6–8 mice per group). The data represent mean±SEM. *P < 0.05 versus RPTCANT2+/+-STD, #P < 0.05 versus RPTCANT2+/+-HFD by one-way ANOVA. ANT2, adenine nucleotide transporter 2; HFD, high-fat diet; NGAL, neutrophil gelatinase-associated lipocalin; PAS, periodic acid–Schiff; RPTC, renal proximal tubule cell; STD, standard diet; TIMP1, tissue inhibitor of metalloproteinase 1; WT, wild type.
Figure 2
Figure 2
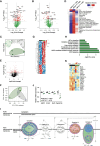
RPTC-ANT2 nullification alters cellular and organelle functions at both the transcriptome and proteome levels. RPTC-ANT2−/− mice and their WT littermate controls were fed either a STD or a HFD for 24 weeks. (A) A volcano plot of differentially expressed genes in the kidney of RPTC-ANT2+/+-HFD versus RPTC-ANT2+/+-STD mice. (B) A volcano plot of differentially expressed genes in the kidney of RPTC-ANT2−/−-HFD versus RPTC-ANT2+/+-HFD mice. (C) A PCA of the global transcriptomic profile of the three treatment groups. (D) A heatmap characterization of the signaling pathways affected in the three treatment groups. The data were collected from 3 to 4 animals per group. (E) A volcano plot of differentially expressed proteins (P value < 0.05) that participate in Qiagen IPA in the kidney of RPTC-ANT2−/−-HFD versus RPTC-ANT2+/+-HFD mice. (F) A PCA of the global proteomics response to ANT2 deletion in RPTCs under HFD conditions. The first two PCs are shown. (G) A heatmap of the 176 differentially expressed proteins between RPTC-ANT2−/−-HFD and RPTC-ANT2+/+-HFD (P value < 0.05). The heatmap was drawn after scaling per protein (rows) the log2 LFQ intensity values over all the samples. Proteins are ordered by hierarchical clustering. (H) A log (B–H P value) of selected significantly enriched Qiagen IPA canonical pathways (B–H P value < 0.05) in the kidney of RPTC-ANT2−/−-HFD versus RPTC-ANT2+/+-HFD mice. (I) The Qiagen IPA OXPHOS canonical pathway. Differentially expressed proteins (P value < 0.05) of the RPTC-ANT2−/−-HFD versus RPTC-ANT2+/+-HFD comparison (in their gene symbols) that participate in this pathway (purple outlines) are colored in pink (upregulated) and green (downregulated), whereas the predicted proteins (by the Qiagen IPA molecular activity predictor tool) are depicted in orange and blue (upregulated and downregulated, respectively). (J) The mRNA expression levels of selected representative genes related to the OXPHOS pathway. Data are from 3 to 4 mice per group. The data represent mean±SEM. *P < 0.05 versus RPTC-ANT2+/+-HFD by Student t test. (K) A heatmap of the differentially expressed genes in the OXPHOS pathway between RPTC-ANT2−/−-HFD and +/+-HFD mice. AMPK, AMP-activated protein kinase; IPA, ingenuity pathway analysis; LFQ, label-free quantification; OXPHOS, oxidative phosphorylation; PC, principle component; PCA, principal component analysis; ROS, reactive oxygen species.
Figure 3
Figure 3
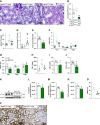
Decreased fatty acid transport, utilization, and accumulation in ANT2-deleted RPTCs. RPTC-ANT2−/− mice and their WT littermate controls were fed a HFD for 24 weeks. (A and B) PAS staining (A) and quantification (B) of fat vacuolated RPTCs (n=5–9 mice per group). Red arrows denote the fat vacuoles. (C) Kidney TG levels (n=7–8 mice per group). (D) Urine-to-serum FFA ratio (n=7–8 mice per group). (E) Fatty acid uptake by primary mouse RPTCs isolated from STD-fed RPTC-ANT2−/− and WT mice (n=9–10 biological replicates in each group). (F and G) The gene expression levels of the fatty acid transporters: Kim1, Cd36, and Fatp2 in kidney cortices (F) and primary mouse RPTCs (G) (n=5–6 biological replicates in each group). (H) Protein levels of KIM-1 in kidney cortices collected from mice (n=4–6 mice per group). (I) The NAD+/NADH ratio measured in primary mouse RPTCs isolated from STD-fed RPTC-ANT2−/− and WT mice (n=5 biological replicates per group). (J and K) CPT1a protein expression levels in primary mouse RPTCs isolated from STD-fed RPTC-ANT2−/− and WT mice quantified (J) by Western blotting (K) (n=10 biological replicates in each group). (L and M) l-carnitine (L) and deoxycarnitine (M) metabolite levels in primary mouse RPTCs isolated from STD-fed RPTC-ANT2−/− and WT mice, exposed for 3 hours to O:P (2:1, 0.1 mM), and measured using LC-MS-based metabolomics analysis (n=6 biological replicates in each group). (N) SIRT1 activity in primary mouse RPTCs isolated from STD-fed RPTC-ANT2−/− and WT mice (n=5 biological replicates per group). (O and P) Quantification of kidney phosphorylated AMPK (O) by immunohistochemical staining (P) in RPTC-ANT2−/− mice and their WT controls fed with a HFD (n=4–5 mice per group). The data represent mean±SEM. In vivo: *P < 0.05 versus RPTCANT2+/+-STD, #P < 0.05 versus RPTCANT2+/+-HFD by one-way ANOVA. In vitro: *P < 0.05 versus WT by Student t test. FFA, free fatty acid; KIM-1, Kidney injury marker 1; KO, knockout; LC-MS, liquid chromatography–mass spectrometry; NADH, nicotinamide adenine dinucleotide hydrogen; O:P, oleate:palmitate; SIRT1, sirtuin1; TG, triglyceride.
Figure 4
Figure 4
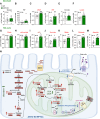
Nullification of ANT2 increases aerobic glycolysis in RPTCs. (A) Cellular ATP content measured in primary mouse RPTCs isolated from STD-fed RPTC-ANT2−/− and WT mice (n=10 biological replicates per group). (B–F) Seahorse OCR measurement (B) in primary mouse RPTCs isolated from STD-fed RPTC-ANT2−/− and WT mice, from which basal respiration (C), maximal respiration (D), proton leak (E), and spare respiratory capacity (F) were calculated (n=5–6 biological replicates per group). (G–J) Metabolic measurements of FO (G and H) and CHO (I and J) measured over a period of 4 hours shown over time (G and I) and in total (H and J) in RPTC-ANT2−/− mice and their WT controls fed with a HFD (n=8 mice per group). (K and L) Biochemical lactate measurement in serum (K) and urine (L) in RPTC-ANT2−/− mice and their WT controls fed with a HFD (n=7–10 mice per group). (M) Biochemical measurements of the glucose-to-lactate ratio in primary mouse RPTCs isolated from STD-fed RPTC-ANT2−/− and WT mice (n=5–10 biological replicates per group). (N–Q) The Seahorse ECAR measurement (N) in primary mouse RPTCs isolated from STD-fed RPTC-ANT2−/− and WT mice, from which glycolysis (O), glycolytic capacity (P), and glycolytic reserve (Q) were calculated (n=6 biological replicates per group). The data represent mean±SEM. In vitro: *P < 0.05 versus WT by Student t test. In vivo: *P < 0.05 versus RPTCANT2+/+-HFD by Student t test. CHO, carbohydrate oxidation; ECAR, extracellular acidification rate; FO, fat oxidation; OCR, oxygen consumption rate.
Figure 5
Figure 5
Increased glycolysis and TCA cycle in ANT2-deleted RPTCs. A [13C]-glucose tracing chase experiment was conducted on primary mouse RPTCs isolated from both STD-fed RPTC-ANT2−/− and WT mice and exposed to fatty acid flux for 3 and 6 hours. The alterations (delta) in the incorporation of [13C] into labeled metabolites were assessed dynamically from 3 to 6 hours. (A–F) Normalized levels of cellular glycolysis-related metabolites: glucose (A), F6P (B), DHAP (C), PEP (D), pyruvate (E), and lactate (F) (n=6 biological replicates per group). (G–L) Normalized levels of cellular TCA cycle–related metabolites: citrate (G), cis-Aconitate (H), α-ketoglutarate (I), succinate (J), malate (K), glutamate (L), and aspartate (M) (n=6 biological replicates per group). (N) Graphical representation of intracellular metabolic utilization of glucose in ANT2-depleted RPTCs. The data represent mean±SEM. *P < 0.05, **P < 0.01 or ***P < 0.001 versus WT by Student t test. αKG, α-ketoglutarate; DHAP, dihydroxyacetone phosphate; F6P, fructose 6 phosphate; PEP, phosphoenolpyruvate; TCA, tricarboxylic acid.
Figure 6
Figure 6
The lack of RPTC-ANT2 is compensated by the overexpression of ANT4. (A–C) Gene (A) and quantified immunohistochemical protein expression (B and C) of ANT1 (Slc25a4) in RPTC-ANT2−/− mice and their WT controls fed with a HFD (n=4–8 mice per group). (D–F) Gene (D) and quantified protein levels measured by Western blotting (E and F) of ANT4 (Slc25a31) RPTC-ANT2−/− mice and their WT controls fed with a HFD (D) or primary mouse RPTCs collected from STD-fed RPTC-ANT2−/− and WT mice (E and F) (n=5–7 samples per group). (G–J) ANT4 protein expression was quantified by Western blotting in the mitochondrial (G and H) and cytosolic (I and J) fractions of primary mouse RPTCs isolated from STD-fed RPTC-ANT2−/− and WT mice (n=3–6 biological replicates per group). The data represent mean±SEM. In vitro: *P < 0.05 versus WT by Student t test. In vivo: *P < 0.05 versus RPTCANT2+/+-HFD by Student t test. (K) Representative double immunostaining of RPTC-ANT2 KO kidneys and their controls for VDAC and ANT4. (L–U) Primary mouse RPTCs, isolated from STD-fed RPTC-ANT2−/− and WT mice, were transfected with a siRNA against ANT4 and the following parameters were measured. (L–P) The Seahorse OCR measurement (L) in ANT4 lacking ANT2 KO RPTCs and their WT controls, from which basal respiration (M), maximal respiration (N), proton leak (O), and spare respiratory capacity (P) were calculated (n=6 biological replicates per group). (Q) XTT staining for the cell viability of ANT4 lacking ANT2−/− RPTCs and their WT controls (n=10–11 biological replicates per group). (R and S) The Seahorse ECAR measurement (R) in ANT4 lacking ANT2−/− RPTCs and their WT controls, from which glycolysis (S) was calculated (n=7 biological replicates per group). (T) Biochemical measurements of the glucose-to-lactate ratio in ANT4 lacking ANT2−/− RPTCs and their WT controls (n=4–6 biological replicates per group). (U) Cellular ATP content measured in ANT4 lacking ANT2−/− RPTCs and their controls (n=10–12 biological replicates per group). The data represent mean±SEM. *P < 0.05 versus WT, #P < 0.05 versus ANT2−/− by one-way ANOVA. siRNA, small interfering RNA; XTT, 2,3-bis-(2-methoxy-4-nitro-5-sulfophenyl)-2h-tetrazolium-5-carboxanilide.
Figure 7
Figure 7
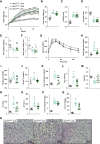
Weight-independent improvements in whole-body metabolism in obese RPTC-ANT2−/− mice. RPTC-ANT2−/− mice and their WT littermate controls were fed either a STD or a HFD for 24 weeks. (A and B) Weekly body weight (A) and final (B) measurements of RPTC-ANT2−/− animals and their WT littermate controls fed either STD or HFD (n=8–9 mice per group). (C and D) MRI measurements of relative fat (C) and lean (D) masses in RPTC-ANT2−/− animals and their WT littermate controls fed either STD or HFD (n=9–10 mice per group). (E and F) Daily food (E) and water (F) intakes of RPTC-ANT2−/− animals and their WT littermate controls fed either STD or HFD (n=7–8 mice per group). (G) Glucose tolerance test (n=8–9 mice per group). (H–O) Biochemical measurements of fasting blood glucose (H), fed serum glucose (I), TGs (J), total cholesterol (K), LDL (L), the HDL-to-LDL ratio (M), ALT (N), and AST (O) (n=6–10 mice per group). (P and Q) Biochemical measurements of hepatic cholesterol (P) and TG (Q) content (n=7–10 mice per group). (R) Representative liver tissue H&E staining. The data represent mean±SEM. *P < 0.05 versus RPTCANT2+/+-STD, #P < 0.05 versus RPTCANT2+/+ HFD by one-way ANOVA or two-way ANOVA for time-dependent measurements. H&E, hematoxylin & eosin.

Comment in

References

    1. Chen TK, Knicely DH, Grams ME. Chronic kidney disease diagnosis and management: a review. JAMA. 2019;322(13):1294–1304. doi:10.1001/jama.2019.14745 - DOI - PMC - PubMed
    1. Ng M Fleming T Robinson M, et al. . Global, regional, and national prevalence of overweight and obesity in children and adults during 1980–2013: a systematic analysis for the Global Burden of Disease Study 2013. Lancet. 2014;384(9945):766–781. doi:10.1016/S0140-6736(14)60460-8 - DOI - PMC - PubMed
    1. Marcuccilli M, Chonchol M. NAFLD and chronic kidney disease. Int J Mol Sci. 2016;17(4):562. doi:10.3390/ijms17040562 - DOI - PMC - PubMed
    1. Blaine J, Levi M. Chronic kidney disease: albuminuria or CKD stage as best marker of CVD in diabetes? Nat Rev Nephrol. 2012;8(7):376–377. doi:10.1038/nrneph.2012.110 - DOI - PubMed
    1. Patschan D, Patschan S, Ritter O. Chronic metabolic acidosis in chronic kidney disease. Kidney Blood Press Res. 2020;45(6):812–822. doi:10.1159/000510829 - DOI - PubMed

Publication types

Substances

LinkOut - more resources