. 2023 Dec 28;14(1):112.
doi: 10.3390/ani14010112.

Changes in Gut Microbiota Associated with Parity in Large White Sows

Affiliations

Changes in Gut Microbiota Associated with Parity in Large White Sows

Yage Bu et al. Animals (Basel). .

Abstract

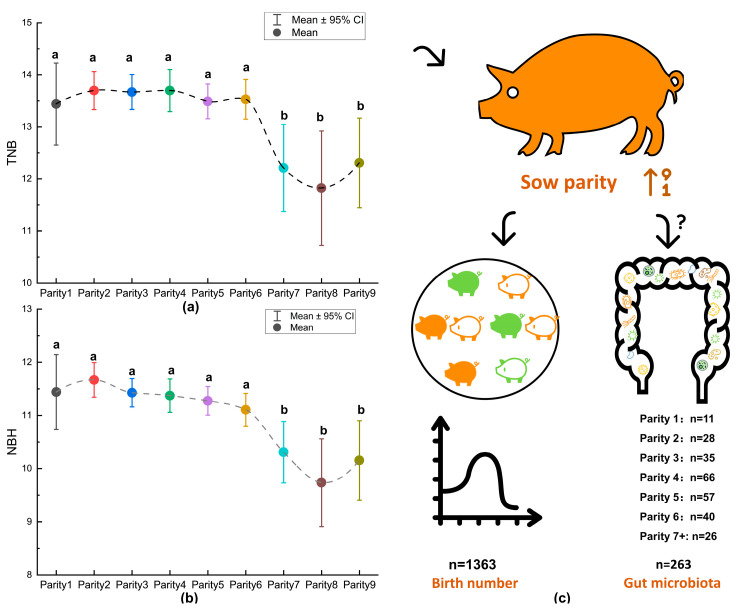
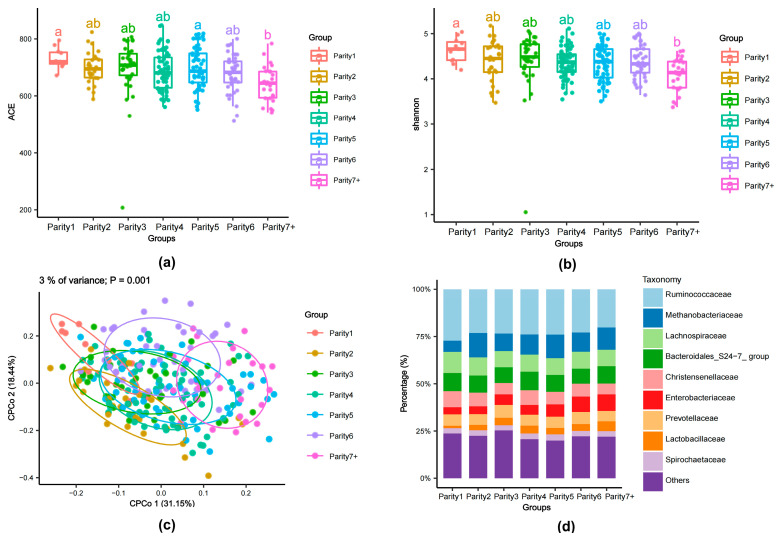
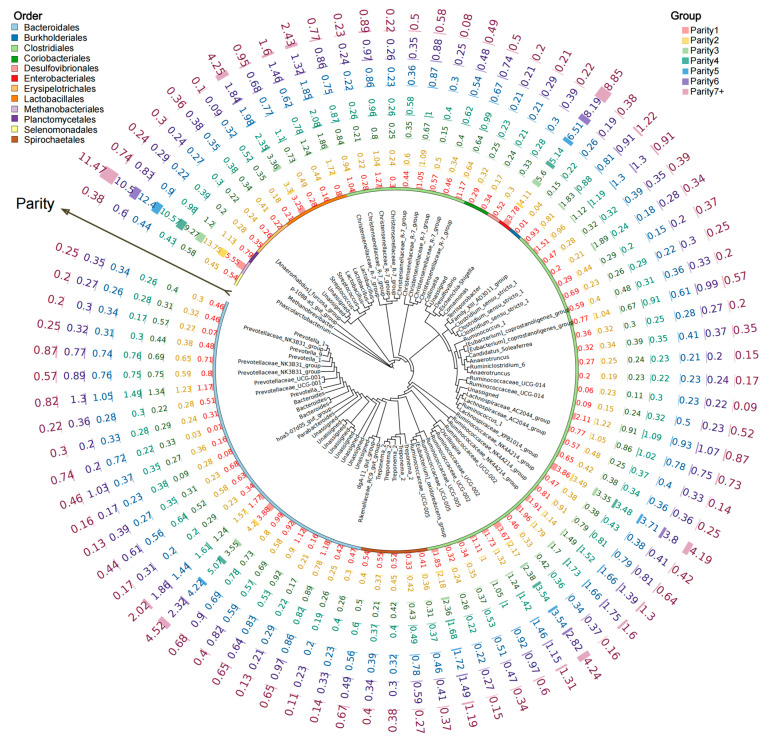
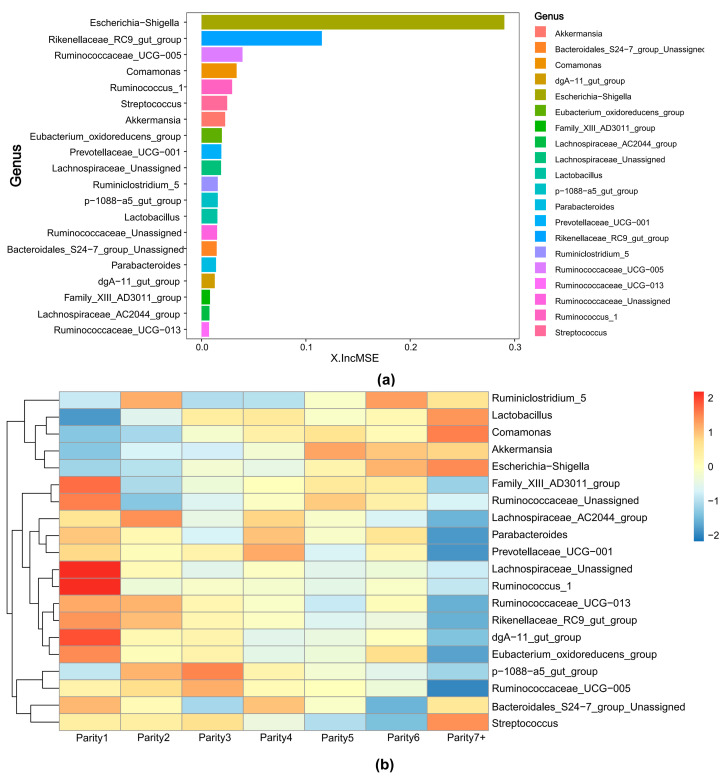
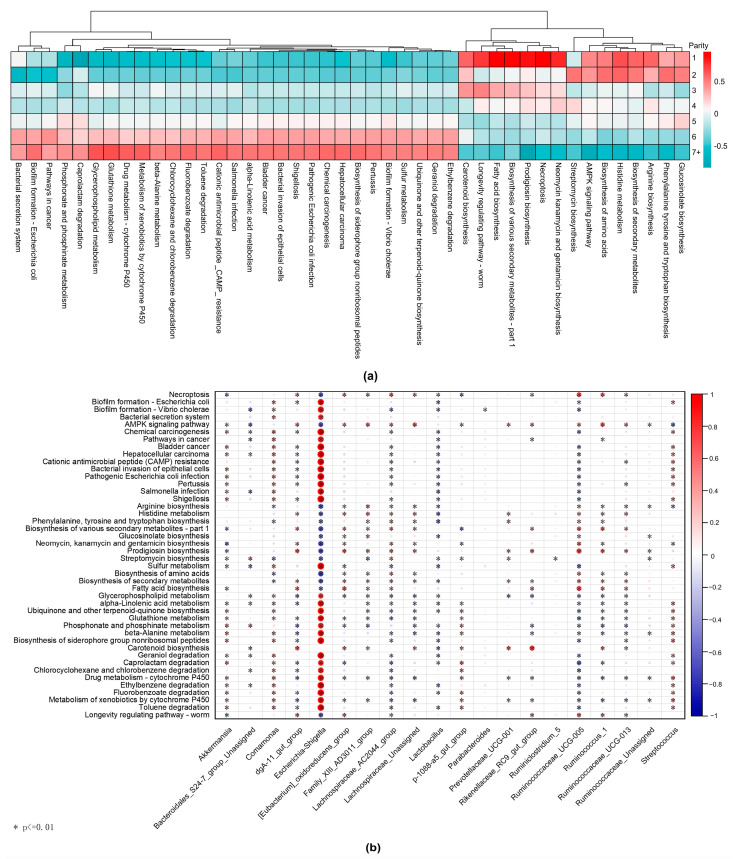
As one of the most critical economic traits, the litter performance of sows is influenced by their parity. Some studies have indicated a connection between the gut microbiota and the litter performance of animals. In this study, we examined litter performance in 1363 records of different parities of Large White sows. We observed a marked decline in TNB (Total Number Born) and NBH (Number of Healthy Born) We observed a marked decline in TNB (Total Number Born) and NBH (Number of Healthy Born) among sows with parity 7 or higher. To gain a deeper understanding of the potential role of gut microbiota in this phenomenon, we conducted 16S rRNA amplicon sequencing of fecal DNA from 263 Large White sows at different parities and compared the changes in their gut microbiota with increasing parity. The results revealed that in comparison to sows with a parity from one to six, sows with a parity of seven or higher exhibited decreased alpha diversity in their gut microbiota. There was an increased proportion of pathogenic bacteria (such as Enterobacteriaceae, Streptococcus, and Escherichia-Shigella) and a reduced proportion of SCFA-producing families (such as Ruminococcaceae), indicating signs of inflammatory aging. The decline in sow function may be one of the primary reasons for the reduction in their litter performance.

Keywords: gut microbiota; litter performance; parity; sows.


Conflict of interest statement

Author Jinglei Si was employed by Guangxi State Farms Yongxin Animal Husbandry Group Co. Ltd. The remaining authors declare that this research was conducted in the absence of any commercial or financial relationships that could be construed as a potential conflicts of interest.

Figures

Figure 1
Figure 1
Variation in litter performance among sows of different parities. (a,b): ANOVA followed by post hoc testing using the Duncan method was employed to conduct multiple comparisons of TNB and NBH among different parity groups. The use of the same letter indicates non-significant differences (p > 0.05), whereas different letters indicate significant differences (p < 0.05). (c): Out of the 1363 records examined, a subset of 263 individuals representing various parities was randomly selected for subsequent analyses of gut microbiota.
Figure 2
Figure 2
The composition of gut microbiota among sows of different parities. (a): Multiple comparisons of ACE were conducted using ANOVA, followed by the Tukey–Kramer post hoc test. The use of the same letter indicates non-significant differences (p > 0.05), whereas different letters indicate significant differences (p < 0.05). (b): Multiple comparisons of Shannon index were conducted using ANOVA, followed by the Tukey–Kramer post hoc test. The use of the same letter indicates non-significant differences (p > 0.05), whereas different letters indicate significant differences (p < 0.05). (c): CPCoA (Constrained Principal Coordinate Analysis) of Bray–Curtis distance matrices. The top 3% of variance represents the displayed plane coordinates, with parity as a condition, explaining 3% of the variation (p = 0.001). The X-axis label CPCo1 (31.15%) is the first principal coordinate axis, and the Y-axis label CPCo2 (18.44%) is the second principal coordinate axis. The percentage of variation indicated in each axis corresponds to the fraction of the total variance explained by the projection. (d): The stacked chart illustrates the relative abundance of the top nine taxa at the family level.
Figure 3
Figure 3
Top OTU members of the bacterial microbiome associated with the different parities. The Maximum Likelihood phylogenetic tree consists of nodes and branches. The terminal nodes of the tree represent the OTUs (Operational Taxonomic Units). To facilitate a clearer understanding of the variations in the relative abundance of high-abundance OTUs among sows of different parities, we annotated and replaced the high-abundance OTUs (IDs) with corresponding Genus-level IDs. Outward from the nodes, the tree demonstrates the order-level classification of these high-abundance OTUs. Further outward, the tree sequentially presents the relative abundance information of the top OTUs from first parity to seven or more parities.
Figure 4
Figure 4
The important taxonomic features that distinguish different parity groups. (a): A Random Forest regression model was constructed using the Random Forest package (v 4.7-1.1), and 20 important taxonomic features were selected. (b): A heatmap illustrating the trend in the average relative abundance of these 20 features with different sow parities.
Figure 5
Figure 5
Differential metabolic pathways of gut microbiota among different parities. (a): The heatmap illustrates the relative abundance of differential metabolic pathways across different parities. In ascending order from sows with a parity of one to sows with a parity of seven or more, the relative abundance variations of distinct metabolic pathways across different parity groups are displayed from top to bottom. (b): The correlation analysis using the Spearman coefficient assessed the associations between the important taxonomic features and the differential metabolic pathways. Asterisks (*) denote significant correlation (p < 0.01), where red indicates a positive correlation, blue indicates a negative correlation, and the circle size represents the magnitude of the correlation coefficient.

Similar articles

References

    1. Lavery A., Lawlor P.G., Magowan E., Miller H.M., O’Driscoll K., Berry D.P. An association analysis of sow parity, live-weight and back-fat depth as indicators of sow productivity. Animal. 2019;13:622–630. doi: 10.1017/S1751731118001799. - DOI - PMC - PubMed
    1. Nuntapaitoon M., Juthamanee P., Theil P.K., Tummaruk P. Impact of sow parity on yield and composition of colostrum and milk in danish landrace x yorkshire crossbred sows. Prev. Vet. Med. 2020;181:105085. doi: 10.1016/j.prevetmed.2020.105085. - DOI - PubMed
    1. Rodriguez-Zas S.L., Southey B.R., Knox R.V., Connor J.F., Lowe J.F., Roskamp B.J. Bioeconomic evaluation of sow longevity and profitability. J. Anim. Sci. 2003;81:2915–2922. doi: 10.2527/2003.81122915x. - DOI - PubMed
    1. Sasaki Y., Koketsu Y. Mortality, death interval, survivals, and herd factors for death in gilts and sows in commercial breeding herds. J. Anim. Sci. 2008;86:3159–3165. doi: 10.2527/jas.2008-1047. - DOI - PubMed
    1. Leonard S.M., Xin H., Brown-Brandl T.M., Ramirez B.C., Dutta S., Rohrer G.A. Effects of farrowing stall layout and number of heat lamps on sow and piglet production performance. Animals. 2020;10:348. doi: 10.3390/ani10020348. - DOI - PMC - PubMed