

Effects of Dietary Protein Levels on Sheep Gut Metabolite Profiles during the Lactating Stage
- PMID: 38200852
- PMCID: PMC10778572
- DOI: 10.3390/ani14010121
Effects of Dietary Protein Levels on Sheep Gut Metabolite Profiles during the Lactating Stage
Abstract
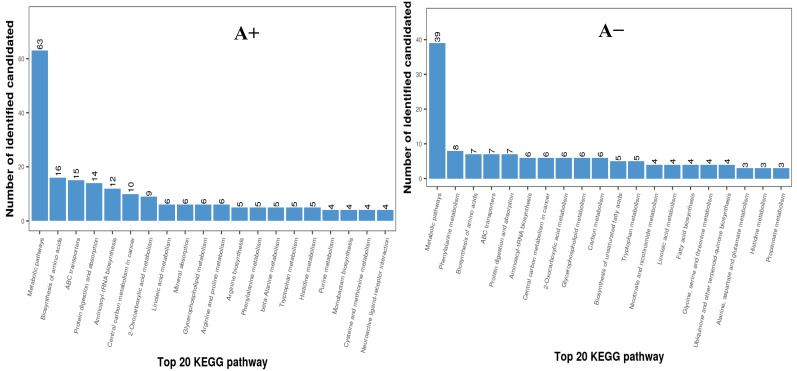
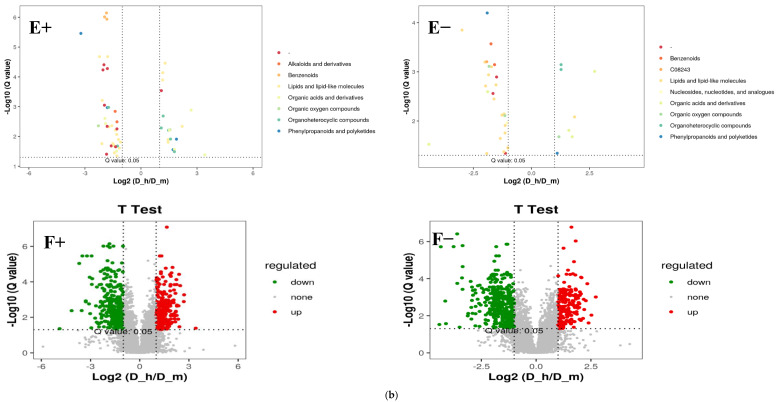
Diet-associated characteristics such as dietary protein levels can modulate the gut's primary or secondary metabolites, leading to effects on the productive performance and overall health of animals. Whereas fecal metabolite changes are closely associated with gut metabolome, this study aimed to see changes in the rumen metabolite profile of lactating ewes fed different dietary protein levels. For this, eighteen lactating ewes (approximately 2 years old, averaging 38.52 ± 1.57 kg in their initial body weight) were divided into three groups (n = 6 ewes/group) by following the complete randomized design, and each group was assigned to one of three low-protein (D_I), medium-protein (D_m), and high-protein (D_h) diets containing 8.58%, 10.34%, and 13.93% crude protein contents on a dry basis, respectively. The fecal samples were subjected to untargeted metabolomics using ultra-performance liquid chromatography (UPLC). The metabolomes of the sheep fed to the high-protein-diet group were distinguished as per principal-component analysis from the medium- and low-protein diets. Fecal metabolite concentrations as well as their patterns were changed by feeding different dietary protein levels. The discriminating metabolites between groups of nursing sheep fed different protein levels were identified using partial least-squares discriminant analysis. The pathway enrichment revealed that dietary protein levels mainly influenced the metabolism-associated pathways (n = 63 and 39 in positive as well as negative ionic modes, respectively) followed by protein (n = 15 and 8 in positive as well as negative ionic modes, respectively) and amino-acid (n = 14 and 7 in positive as well as negative ionic modes, respectively) synthesis. Multivariate and univariate analyses showed comparative changes in the fecal concentrations of metabolites in both positive and negative ionic modes. Major changes were observed in protein metabolism, organic-acid biosynthesis, and fatty-acid oxidation. Pairwise analysis and PCA reveal a higher degree of aggregation within the D-h group than all other pairs. In both the PCA and PLS-DA plots, the comparative separation among the D_h/D_m, D_h/D_I, and D_m/D_I groups was superior in positive as well as negative ionic modes, which indicated that sheep fed higher protein levels had alterations in the levels of the metabolites. These metabolic findings provide insights into potentiated biomarker changes in the metabolism influenced by dietary protein levels. The target identification may further increase our knowledge of sheep gut metabolome, particularly regarding how dietary protein levels influence the molecular mechanisms of nutritional metabolism, growth performance, and milk synthesis of sheep.
Keywords: gut; lactation; metabolites; metabolome; sheep.
Conflict of interest statement
S.A. is employed by Zhejiang Vegamax Biotechnology Co., Ltd. The remaining authors declare that the research was conducted in the absence of any commercial or financial relationships that could be construed as a potential conflict of interest.
Figures


Similar articles
-
Impact of Varying Dietary Calcium Contents on the Gut Metabolomics of Yunnan Semi-Fine Wool Sheep (Ovis aries).Metabolites. 2024 Jul 10;14(7):381. doi: 10.3390/metabo14070381. Metabolites. 2024. PMID: 39057704 Free PMC article.
-
Effects of graded levels of dietary protein supplementation on milk yield, body weight gain, blood biochemical parameters, and gut microbiota in lactating ewes.Front Vet Sci. 2023 Aug 3;10:1223450. doi: 10.3389/fvets.2023.1223450. eCollection 2023. Front Vet Sci. 2023. PMID: 37601763 Free PMC article.
-
The effects of feeding chickpea grains on the lactating performance and blood metabolites of ewes.Trop Anim Health Prod. 2022 Oct 10;54(6):340. doi: 10.1007/s11250-022-03337-x. Trop Anim Health Prod. 2022. PMID: 36214928
-
Cereals level and source effects on rumen fermentation, colostrum and milk properties, and blood metabolites in periparturient ewes.Animal. 2019 Jun;13(6):1165-1172. doi: 10.1017/S1751731118002720. Epub 2018 Oct 22. Animal. 2019. PMID: 30345946
-
Comparative metabolome analysis of serum changes in sheep under overgrazing or light grazing conditions.BMC Vet Res. 2019 Dec 26;15(1):469. doi: 10.1186/s12917-019-2218-9. BMC Vet Res. 2019. PMID: 31878922 Free PMC article.
Cited by
-
Analysis of Fecal Microbiome and Metabolome Changes in Goats When Consuming a Lower-Protein Diet with Varying Energy Levels.Microorganisms. 2025 Apr 18;13(4):941. doi: 10.3390/microorganisms13040941. Microorganisms. 2025. PMID: 40284777 Free PMC article.
-
Influence of dietary protein levels on metabolism of nitrogen, phosphorus, and calcium in a Chinese indigenous sheep (Ovis aries).Trop Anim Health Prod. 2025 Jul 18;57(7):308. doi: 10.1007/s11250-025-04561-x. Trop Anim Health Prod. 2025. PMID: 40679645
-
Effects of dietary protein levels on genes related to subcutaneous fat deposition and lipid metabolism in Tibetan sheep.BMC Genomics. 2025 Jul 16;26(1):669. doi: 10.1186/s12864-025-11874-6. BMC Genomics. 2025. PMID: 40670965 Free PMC article.
-
Impact of Varying Dietary Calcium Contents on the Gut Metabolomics of Yunnan Semi-Fine Wool Sheep (Ovis aries).Metabolites. 2024 Jul 10;14(7):381. doi: 10.3390/metabo14070381. Metabolites. 2024. PMID: 39057704 Free PMC article.
-
Phytochemical-Induced Metabolic Modulation: Dihydroartemisinin Regulates Cellular Metabolism in Madin-Darby Bovine Kidney Cells.Int J Mol Sci. 2025 May 9;26(10):4531. doi: 10.3390/ijms26104531. Int J Mol Sci. 2025. PMID: 40429676 Free PMC article.
References
-
- Tan P., Liu H., Zhao J., Gu X., Wei X., Zhang X., Ma N., Johnston L.J., Bai Y., Zhang W., et al. Amino acids metabolism by rumen microorganisms: Nutrition and ecology strategies to reduce nitrogen emissions from the inside to the outside. Sci. Total Environ. 2021;800:149596. doi: 10.1016/j.scitotenv.2021.149596. - DOI - PubMed
-
- Wang X., Xu T., Zhang X., Zhao N., Hu L., Liu H., Zhang Q., Geng Y., Kang S., Xu S. The response of ruminal microbiota and metabolites to different dietary protein levels in Tibetan sheep on the Qinghai-Tibetan plateau. Front. Vet. Sci. 2022;9:922817. doi: 10.3389/fvets.2022.922817. - DOI - PMC - PubMed
Grants and funding
LinkOut - more resources
Full Text Sources
