. 2023 Dec 20;13(1):6.
doi: 10.3390/cells13010006.

Multiple-Pathway Synergy Alters Steroidogenesis and Spermatogenesis in Response to an Immunocastration Vaccine in Goat

Affiliations

Multiple-Pathway Synergy Alters Steroidogenesis and Spermatogenesis in Response to an Immunocastration Vaccine in Goat

Yi Ding et al. Cells. .

Abstract

Background: Animal reproduction performance is crucial in husbandry. Immunocastrated animals serve as an ideal animal model for studying testicular function. During androgen suppression, the testis undergoes dramatic developmental and structural changes, including the inhibition of hormone secretion and spermatogenesis.

Methods: To characterize this process, we investigated the effects of castration using a recombinant B2L and KISS1 DNA vaccine, and then identified functional genes in the testes of Yiling goats using RNA-seq and WGS. The experimental animals were divided into three groups: the PVAX-asd group (control), PBK-asd-immunized group, and surgically castrated group.

Results: The results demonstrated that the administration of the recombinant PBK-asd vaccine in goats elicited a significant antibody response, and reduced serum follicle-stimulating hormone (FSH) and luteinizing hormone (LH), resulting in smaller scrotal circumferences and decreased sexual desire compared to the control group. In addition, RNA transcriptome sequencing (RNA-seq) analysis of the testes revealed that the biological processes after immunocastration mainly focused on the regulation of cell matrix adhesion, histone acetylation, negative regulation of developmental processes, apoptosis, and activation of the complement system and the thrombin cascade reaction system. Then, we integrated the whole-genome sequencing and testis transcriptome, and identified several candidate genes (FGF9, FST, KIT, TH, TCP1, PLEKHA1, TMEM119, ESR1, TIPARP, LEP) that influence steroidogenesis secretion and spermatogenesis.

Conclusions: Multiple pathways and polygenic co-expression participate in the response to castration vaccines, altering hormone secretion and spermatogenesis. Taken together, our atlas of the immunocastration goat testis provides multiple insights into the developmental changes and key factors accompanying androgen suppression, and thus may contribute to understanding the genetic mechanism of testis function. Joint analysis of whole genome sequencing and RNA-seq enables reliable screening of candidate genes, benefiting future genome-assisted breeding of goats.

Keywords: DNA vaccine; goat; immunocastration; testis function; transcriptome; whole gene sequencing.


Conflict of interest statement

All authors declare no conflict of interest regarding any matter in this study.

Figures
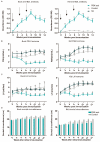
Figure 1
Figure 1
Effect of PBK-asd DNA vaccine on antibodies, hormones, scrotal circumference, and testicular morphology of Yiling goats. The mean ± SEM serum anti-B2L antibody (A), FSH (B), and LH hormone (C) concentrations in buck and kid goats immunized with PBK-asd (n = 5), surgically castrated goats (n = 5), and control group (n = 5), respectively. The treatment was given intramuscularly. Different superscript letter among weeks within a treatment group indicates significant difference at p < 0.05. The arrows at the top of the figure indicate vaccination time. * represented p < 0.05, ** represented p < 0.01. (D) The mean ± SEM of scrotal circumference of control (n = 5) and PBK-asd-immunized (n = 5) buck and kid Yiling goats, respectively. It was measured biweekly from initial immunization to 14 weeks after immunization. * represented p < 0.05, ** represented p < 0.01. (E) Histological analysis of testicular tissue from control goat (left) and PBK-asd-immunized goat (right) stained with hematoxylin and eosin. The hollow arrow, solid arrow, arrowhead, and circle indicate the spermatogonium, spermatocytes, spermatid, and spermatozoa, respectively. The magnification power is 20× and the scale bar represents 100 μm.
Figure 1
Figure 1
Effect of PBK-asd DNA vaccine on antibodies, hormones, scrotal circumference, and testicular morphology of Yiling goats. The mean ± SEM serum anti-B2L antibody (A), FSH (B), and LH hormone (C) concentrations in buck and kid goats immunized with PBK-asd (n = 5), surgically castrated goats (n = 5), and control group (n = 5), respectively. The treatment was given intramuscularly. Different superscript letter among weeks within a treatment group indicates significant difference at p < 0.05. The arrows at the top of the figure indicate vaccination time. * represented p < 0.05, ** represented p < 0.01. (D) The mean ± SEM of scrotal circumference of control (n = 5) and PBK-asd-immunized (n = 5) buck and kid Yiling goats, respectively. It was measured biweekly from initial immunization to 14 weeks after immunization. * represented p < 0.05, ** represented p < 0.01. (E) Histological analysis of testicular tissue from control goat (left) and PBK-asd-immunized goat (right) stained with hematoxylin and eosin. The hollow arrow, solid arrow, arrowhead, and circle indicate the spermatogonium, spermatocytes, spermatid, and spermatozoa, respectively. The magnification power is 20× and the scale bar represents 100 μm.
Figure 2
Figure 2
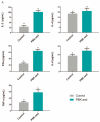
The mean ± SEM of serum cytokines in control group (n = 5) and PBK-asd-immunized (n = 5) buck (A) and kid (B) Yiling goats, respectively, detected at eight weeks. Different superscript letters represent a significant difference at p < 0.05.
Figure 2
Figure 2
The mean ± SEM of serum cytokines in control group (n = 5) and PBK-asd-immunized (n = 5) buck (A) and kid (B) Yiling goats, respectively, detected at eight weeks. Different superscript letters represent a significant difference at p < 0.05.
Figure 3
Figure 3
Gene expression profiles of immunocastrated testis. (A) Volcano plot showing differentially expressed genes between bulk immunization group and control group. (B) Volcano plot showing differentially expressed genes between kid immunization group and kid control group. Red and green dots represent up- and down-regulated genes, respectively while black dots represent the genes without significant differential expression. (C) Bar plot presentation number of DEGs between treatment groups: bPBK and sPBK represent buck and kid immunized groups, respectively.
Figure 4
Figure 4
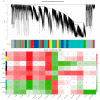
Gene modules identified using WGCNA and relationships of consensus module eigengenes and phenotype traits in the sPBK data. (A) Gene dendrogram of all genes of the transcriptome dataset obtained by clustering the dissimilarity based on consensus Topological Overlap with the corresponding module colors indicated by the color row. (B) The ME values in kid treatment group were correlated with phenotype traits. Each row in the table corresponds to a consensus module, and each column to a trait. Within each table cell, upper values represent correlation coefficients between ME and the variable, while lower values in brackets correspond to Student’s asymptotic p-value.
Figure 5
Figure 5
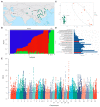
The distribution and kinship of domestic and wild goats in this study, and principal analysis of domestic and wild goats based on SNPs of autosome. (A) Distribution of domestic and wild goats in this study. The dots indicate the main distribution areas of different goat populations, not the location of sampling. The green dots represent domestic goats, and the orange dots represent wild goats. (B) Ancestry inference based on SNPs of autosome. The CV values of domestic and wild goats were tested when the number of ancestors k was 1 to 5. The CV value was the lowest when k = 3, which indicated that the population was the most reasonable division when they had three ancestors. The x-axis represents each individual, and the y-axis represent the proportion of specific ancestral lineages. A higher proportion of a certain color indicates the higher purity of the blood relationship between the individual and a certain ancestor. (C) The consequence shows the genetic distance between domestic and wild populations. The boxes mark the populations of domestic goats, and the dots mark the populations of wild goats. (D) Positive selection signals for autosomes 1 to 29 in domestic and wild goats and biological process enrichment of genes located in positive regions. Red marks show the terms related to reproduction. This figure only shows 35 of the 179 terms. (E) A sliding window (100 kb window size, 10 kb sliding step size) was used to calculate the Fst value between domestic and wild goats, and converted into Z-transformed fixation index. The horizontal line indicates that the window where Z(Fst) ≥ 2.326 is intercepted as an assumed positively selected area.
Figure 6
Figure 6
Integrated analysis of whole genomic and transcriptome datasets. (A) Venn diagram was made to intersect differential genes, red and blue module genes related to testis growth and development, and positive selection genes in WGS. Genes that overlapped with WGS were singled out. The number in each cell represents the number of genes that intersect. (B) GO enrichment of intersected genes from A in biological process.

Similar articles

Cited by

References

    1. Morales F.D.A.R., Genís J.M.C., Guerrero Y.M. Current status, challenges and the way forward for dairy goat production in Europe. Asian-Australas. J. Anim. Sci. 2019;32:1256–1265. doi: 10.5713/ajas.19.0327. - DOI - PMC - PubMed
    1. Diamond J. Evolution, consequences and future of plant and animal domestication. Nature. 2002;418:700–707. doi: 10.1038/nature01019. - DOI - PubMed
    1. Larson G., Piperno D.R., Allaby R.G., Purugganan M.D., Andersson L., Arroyo-Kalin M., Barton L., Vigueira C.C., Denham T., Dobney K., et al. Current perspectives and the future of domestication studies. Proc. Natl. Acad. Sci. USA. 2014;111:6139–6146. doi: 10.1073/pnas.1323964111. - DOI - PMC - PubMed
    1. Kaprara A., Huhtaniemi I.T. The hypothalamus-pituitary-gonad axis: Tales of mice and men. Metabolism. 2018;86:3–17. doi: 10.1016/j.metabol.2017.11.018. - DOI - PubMed
    1. Stafford K., Mellor D. The welfare significance of the castration of cattle: A review. N. Z. Veter. J. 2005;53:271–278. doi: 10.1080/00480169.2005.36560. - DOI - PubMed

Publication types

LinkOut - more resources