. 2023 Dec 20;13(1):13.
doi: 10.3390/cells13010013.

Differential Activation of Splenic cDC1 and cDC2 Cell Subsets following Poxvirus Infection of BALB/c and C57BL/6 Mice

Affiliations

Differential Activation of Splenic cDC1 and cDC2 Cell Subsets following Poxvirus Infection of BALB/c and C57BL/6 Mice

Lidia Szulc-Dąbrowska et al. Cells. .

Abstract

Conventional dendritic cells (cDCs) are innate immune cells that play a pivotal role in inducing antiviral adaptive immune responses due to their extraordinary ability to prime and polarize naïve T cells into different effector T helper (Th) subsets. The two major subpopulations of cDCs, cDC1 (CD8α+ in mice and CD141+ in human) and cDC2 (CD11b+ in mice and CD1c+ in human), can preferentially polarize T cells toward a Th1 and Th2 phenotype, respectively. During infection with ectromelia virus (ECTV), an orthopoxvirus from the Poxviridae family, the timing and activation of an appropriate Th immune response contributes to the resistance (Th1) or susceptibility (Th2) of inbred mouse strains to the lethal form of mousepox. Due to the high plasticity and diverse properties of cDC subpopulations in regulating the quality of a specific immune response, in the present study we compared the ability of splenic cDC1 and cDC2 originating from different ECTV-infected mouse strains to mature, activate, and polarize the Th immune response during mousepox. Our results demonstrated that during early stages of mousepox, both cDC subsets from resistant C57BL/6 and susceptible BALB/c mice were activated upon in vivo ECTV infection. These cells exhibited elevated levels of surface MHC class I and II, and co-stimulatory molecules and showed enhanced potential to produce cytokines. However, both cDC subsets from BALB/c mice displayed a higher maturation status than that of their counterparts from C57BL/6 mice. Despite their higher activation status, cDC1 and cDC2 from susceptible mice produced low amounts of Th1-polarizing cytokines, including IL-12 and IFN-γ, and the ability of these cells to stimulate the proliferation and Th1 polarization of allogeneic CD4+ T cells was severely compromised. In contrast, both cDC subsets from resistant mice produced significant amounts of Th1-polarizing cytokines and demonstrated greater capability in differentiating allogeneic T cells into Th1 cells compared to cDCs from BALB/c mice. Collectively, our results indicate that in the early stages of mousepox, splenic cDC subpopulations from the resistant mouse strain can better elicit a Th1 cell-mediated response than the susceptible strain can, probably contributing to the induction of the protective immune responses necessary for the control of virus dissemination and for survival from ECTV challenge.

Keywords: Th immune response; cDC1; cDC2; dendritic cell; ectromelia virus.


Conflict of interest statement

The authors declare no conflict of interest.

Figures
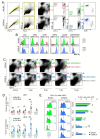
Figure 1
Figure 1
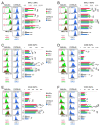
ECTV infection decreasing the number of cDC1 and cDC2 subsets in the spleen of susceptible BALB/c mice. (A) Gating strategy for the evaluation of cDC1 (CD11bCD11c+ indicated by red and grey circles) and cDC2 (CD11b+CD11c+ indicated by green and blue circles) subsets in spleens of BALB/c and C57BL/6 mice, respectively, based on the expression of CD11b and CD11c markers. (B) The percentage of indicated marker-positive cells or the surface expression (shown as mean fluorescent intensity (MFI)) of the indicated markers by cDC1 (CD11bCD11c+) and cDC2 (CD11b+CD11c+) subsets. Light grey histograms represent fluorescence minus one (FMO) controls. (C) The percentage of cDC1 (CD11bCD11c+) and cDC2 (CD11b+CD11c+) subsets in spleens of BALB/c and C57BL/6 mice during ECTV infection. Circles depict gates and the numbers are the percentage of cells within a particular gate. (D) The total number of cDC1 and cDC2 per spleen of BALB/c and C57BL/6 during ECTV infection. The dots represent the number of a particular cell population in an individual animal counted per total number of live splenocytes. The mean values for the groups (n = 5–6) are shown in columns and the standard deviations are indicated by the error bars. Significant differences were estimated and are compared to the control group unless otherwise indicated by horizontal bars between two columns (* p < 0.05, ** p < 0.01, and *** p < 0.001). (E) The percentage of CD4+ cells within the cDC2 subpopulation in spleens of BALB/c and C57BL/6 mice infected with mousepox. Light grey histograms indicate FMO controls. In all cases, the percentage/MFI values shown are of the representative cytogram/histogram, n = 6 mice/group, with one animal comprising one flow cytometry sample. The mean values for the groups (n = 5–6) are shown in columns and the standard deviations are indicated by the error bars. Significant differences were estimated and are compared to the control group unless otherwise indicated by horizontal bars between two columns (unpaired Student’s t-test: * p < 0.05, ** p < 0.01, and *** p < 0.001). N/A—not analyzed.
Figure 2
Figure 2
ECTV infects cDC1 and cDC2 in spleen of BALB/c and C57BL/6 mice; however, both cDC subsets of susceptible mice yielded a higher virus titer than that of resistant mice. (A) Purity assessment of cDC1 and cDC2 subsets via flow cytometry after magnetic cell separation (MACS). Representative flow cytometry dot plots showing the percentage of cDC1 (CD8α+ as CD11bCD11c+) and cDC2 (CD8α as CD11b+CD11c+) subsets after MACS isolation from spleen of uninfected BALB/c and C57BL/6 mice. Numbers in each gate indicate the percentage of cells positive for given markers. (B) The percentage of the indicated marker-positive cells or surface expression (shown as mean fluorescent intensity (MFI)) of the indicated markers by cDC1 (CD11bCD11c+) and cDC2 (CD11b+CD11c+) subsets after MACS enrichment. Light-grey histograms represent fluorescence minus one (FMO) controls. In all cases, percentage/MFI values shown are of the representative cytogram/histogram, n = 6 mice/group, with one animal comprising one flow cytometry sample. (C) The total number of cDC1 and cDC2 subsets recovered from the spleen of uninfected and infected BALB/c and C57BL/6 mice at 5 dpi after MACS separation. The dots represent the number of a particular cell population in the individual spleen. The mean values for the groups (n = 7) are shown in columns and the standard deviations are indicated by the error bars. Significant differences are indicated by horizontal bars between two columns (unpaired Student’s t-test: * p < 0.05, n.s.—not significant). (D) Fluorescence microscopy analysis of the expression of ECTV antigens on MACS-separated cDC1 and cDC2 subsets, stained for the presence of CD8α and CD11b markers, respectively. (E) Number of plaques per 1 × 10⁵ splenic cDC1 or cDC2 of BALB/c and C57BL/6 mice at 5 dpi with ECTV. Significant differences are indicated by horizontal bars between two columns (unpaired Student’s t-test: * p < 0.05).
Figure 3
Figure 3
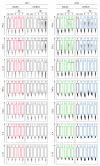
ECTV infection promotes maturation of cDC1 and cDC2 in spleen of BALB/c and C57BL/6 mice during early stages of infection; however, the MHC II expression on cDC subsets drops under severe mousepox in susceptible mice. Surface expression (shown as mean fluorescent intensity (MFI)) of major histocompatibility class I (MHC I) molecules (A), MHC II (B), CD80 (C), CD86 (D), CD40 (E), and CD83 (F) by cDC1 (CD11bCD11c+) and cDC2 (CD11b+CD11c+) subsets. Light-gray histograms represent fluorescence minus one (FMO) controls. In all cases, a representative histogram is shown from n = 5 or 6 mice/group, with one animal comprising one flow cytometry sample. The mean values for the groups (n = 5–6) are shown in columns and the standard deviations are indicated by the error bars. Significant differences were estimated and compared to the control group unless otherwise indicated by horizontal bars between two columns (unpaired or paired Student’s t-test and Mann–Whitney U-test or Wilcoxon signed-rank test: * p < 0.05, ** p < 0.01, and *** p < 0.001). N/A—not analyzed.
Figure 4
Figure 4
cDC1 and cDC2 of C57BL/6 mice producing higher levels of Th1 cytokines than those of BALB/c mice during ECTV infection. Splenocytes were re-stimulated with Ionomycin + PMA for 6 h in the presence of Brefeldin A for the last 5 h of culture, and then stained intracellularly. Representative flow cytometry dot plots showing the percentage of cDC1 (CD11bCD11c+) and cDC2 (CD11b+CD11c+) subsets producing IFN-γ, CCL3, IL-12, TNF-α, CCL2, IL-4, or IL-10. The numbers within each gate denote the percentage of cells positive for a given marker, derived from one representative dot plot of at least five independent mice. Statistically significant differences between the means of the experimental group (n = 5 or 6) and the control group (n = 5 or 6) are indicated with asterisks (unpaired Student’s t-test or Mann–Whitney U-test: * p < 0.05, ** p < 0.01, and *** p < 0.001). Isc—isotype control.
Figure 5
Figure 5
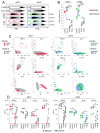
Diagram showing that ECTV induces higher changes in the expression of genes associated with dendritic cell maturation and activation in cDC1 and cDC2 of BALB/c mice than in those of C57BL/6 mice in the early stage of mousepox. The volcano plots depict differentially expressed genes in (A) C57BL/6 vs. BALB/c cDC1 and cDC2 subsets, (B) cDC1 vs. cDC2 of BALB/c and C57BL/6 mice, (C) cDC1 isolated from ECTV-infected BALB/c and C57BL/6 mice at 5 dpi vs. control uninfected animals, and (D) cDC2 separated from ECTV-infected BALB/c and C57BL/6 mice at 5 dpi vs. control uninfected animals. The volcano plots show the threshold for statistical significance (unpaired Student’s t-test) of p-value = 0.05 (log10 of the p-value; horizontal line) and a fold change of −2 and +2 (log2; vertical dotted lines). The number of genes that are down (green)- and up (red)-regulated at least twofold and have a p-value less than 0.05 are at the upper-left and upper-right corners, respectively. Venn diagrams illustrating the overlap of down-regulated (E) and up-regulated (F) genes in cDC1 and cDC2 isolated from ECTV-infected BALB/c and C57BL/6 mice at 5 dpi. The numbers in red, grey, green, and blue modules represent the number of differentially expressed genes in BALB/c cDC1, C57BL/6 cDC1, BALB/c cDC2, and C57BL/6 cDC2, respectively.
Figure 6
Figure 6
Top ten canonical pathways identified via ingenuity pathway analysis (IPA) of differentially expressed genes in BALB/c cDC1 (A), C57BL/6 cDC1 (B), BALB/c cDC2 (C), and C57BL/6 cDC2 (D) between ECTV-infected and control mice. Blue bars: negative z-score; orange bars: positive z-score; gray bars: no activity pattern available. The orange line shows the default p-value significance threshold of 0.05 (unpaired Student’s t-test).
Figure 7
Figure 7
Diagram showing that ECTV infection decreases the ability of DC1 and cDC2 from BALB/c and C57BL/6 mice to stimulate proliferation and activation of allogeneic CD4+ T cells, but still both cDC subsets from resistant mice stimulated a greater Th1 cytokine immune response than did those of susceptible mice. The stimulatory ability of cDC subsets from control (uninfected) and ECTV-infected BALB/c and C57BL/6 mice at 5 dpi was detected from the allogeneic mixed lymphocyte reaction (MLR) in DC:T cell ratio = 1:5. Briefly, 2 × 10⁵ CFSE-labeled or unlabeled T cells from C3H mice were mixed with 4 × 10⁴ cDC subsets from ECTV-uninfected or -infected BALB/c and C57BL/6 mice and incubated for 5 days. (A) Representative flow cytometry dot plots showing the proliferation of CD4+ T cells in total CD4+ T cells, as measured via CFSE loss. Numbers show the percentage of CFSElow proliferating T cells. Con A—concanavalin A. (B) Graph showing individual data of the percentage of CFSElow CD4+ T cells from four independent experiments. Significant differences are indicated by horizontal bars between two dependent sets of data (unpaired Student’s t-test or Mann–Whitney U-test: * p < 0.05, ** p < 0.01, and *** p < 0.001). (C) The capacity of cDC1 and cDC2 subsets to stimulate the production of IFN-γ, TNF-α, IL-2, IL-4, IL-10, and IL-17A by allogeneic CD4+ T cells. Graphs show individual data (n = 3–4) plotted against the percentage of CD4+ T cells expressing a particular cytokine and mean fluorescent intensity (MFI) of this population, as determined via intracellular staining and flow cytometry analysis. Hatched and filled circles mark the distribution of individual data within a particular cDC subset from control and infected animals (5 dpi), respectively. Significant differences in MFI and the percentage of IFN-γ-producing cells are denoted by horizontal bars between two circles (unpaired Student’s t-test: * p < 0.05). (D) Diagrams representing the mean concentration values (pg/mL) of IFN-γ, IL-2, IL-4, and IL-10 produced by allogeneic CD4+ T cells in MLR with cDC1 or cDC2 from uninfected or infected BALB/c or C57BL/6 mice at 5 dpi. Significant differences are indicated by horizontal bars between two dependent sets of data (unpaired Student’s t-test or Mann–Whitney U-test: * p < 0.05, ** p < 0.01, and *** p < 0.001).
Figure 8
Figure 8
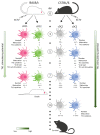
Schematic diagram of the kinetics of splenic cDC1 and cDC2 subset activation in BALB/c (susceptible) and C57BL/6 (resistant) mice during mousepox. ECTV infects both subsets of splenic cDCs in BALB/c and C57BL/6 mice, but cDC subsets from susceptible mice exhibit a higher viral load than that of those from resistant mice during early stages of mousepox. Susceptible mice show a reduced number of cDC1 and cDC2 in the spleen, which additionally produce lower levels of Th1-polarizing cytokines than those of resistant mice. However, cDC subsets from BALB/c mice show a higher maturation profile than that of those from C57BL/6 mice during the acute phase of mousepox. This phenomenon suggests that cDCs from susceptible BALB/c mice have a lower potential to stimulate a protective Th1-type response, resulting in the development of full-blown mousepox and death. cDC subsets from resistant mice have increased potential to stimulate a Th1-type response, resulting in survival and recovery from a primary ECTV infection. (+) means an increase compared to the control; (−) means a decrease compared to the control; (•) means no change compared to the control. The number of (+) and (−) indicates the intensification of a given process. dpi—days post infection.

Similar articles

Cited by

References

    1. Riedel S. Edward Jenner and the history of smallpox and vaccination. Bayl. Univ. Med. Cent. Proc. 2005;18:21–25. doi: 10.1080/08998280.2005.11928028. - DOI - PMC - PubMed
    1. MacNeill A.L. Comparative pathology of zoonotic orthopoxviruses. Pathogens. 2022;11:892. doi: 10.3390/pathogens11080892. - DOI - PMC - PubMed
    1. Thornhill J.P., Barkati S., Walmsley S., Rockstroh J., Antinori A., Harrison L.B., Palich R., Nori A., Reeves I., Habibi M.S., et al. Monkeypox virus infection in humans across 16 countries—April–June 2022. N. Engl. J. Med. 2022;387:679–691. doi: 10.1056/NEJMoa2207323. - DOI - PubMed
    1. Freer G., Matteucci D. Influence of dendritic cells on viral pathogenicity. PLoS Pathog. 2009;5:e1000384. doi: 10.1371/journal.ppat.1000384. - DOI - PMC - PubMed
    1. Randolph G.J., Angeli V., Swartz M.A. Dendritic-cell trafficking to lymph nodes through lymphatic vessels. Nat. Rev. Immunol. 2005;5:617–628. doi: 10.1038/nri1670. - DOI - PubMed

Publication types