. 2023 Dec 21;13(1):26.
doi: 10.3390/cells13010026.

Aberrations in Cell Signaling Quantified in Diabetic Murine Globes after Injury

Affiliations

Aberrations in Cell Signaling Quantified in Diabetic Murine Globes after Injury

Nicholas A Azzari et al. Cells. .

Abstract

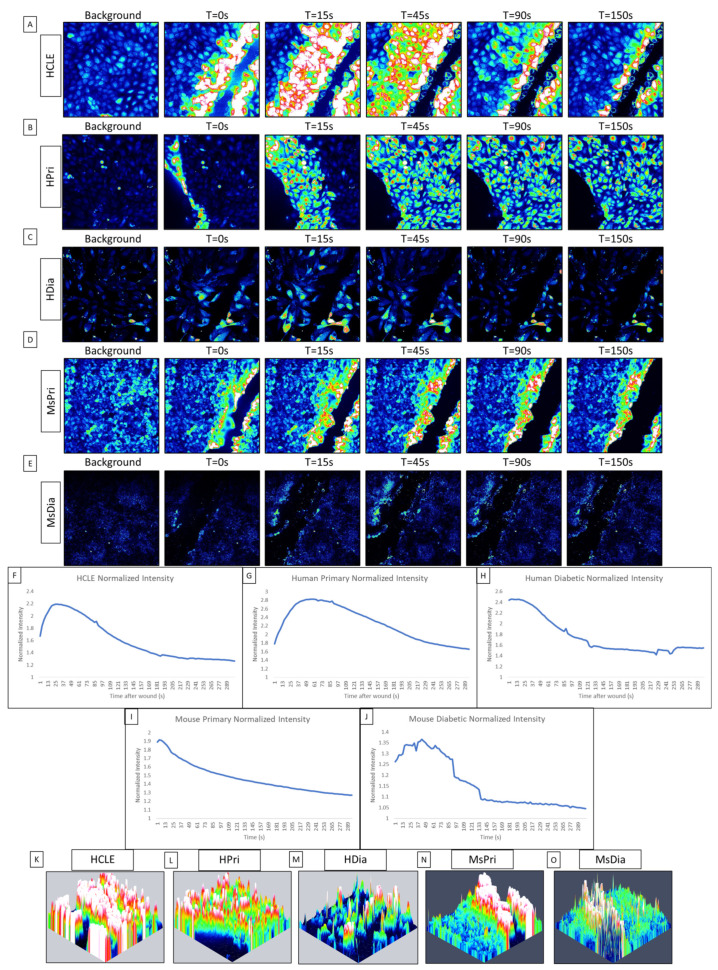
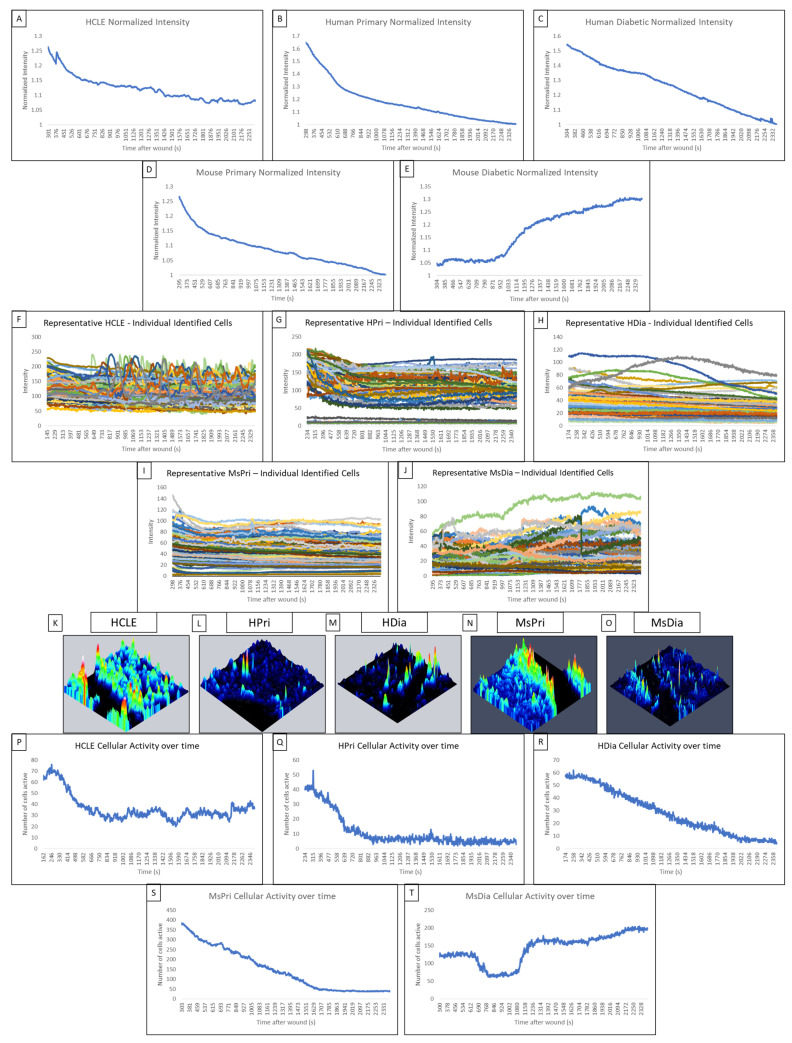
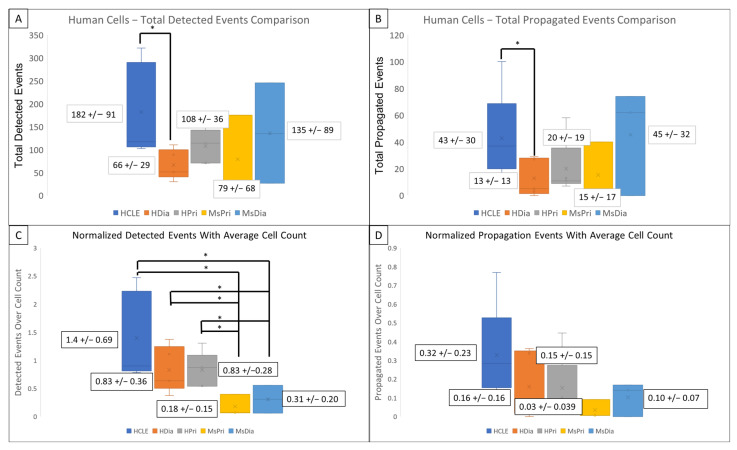
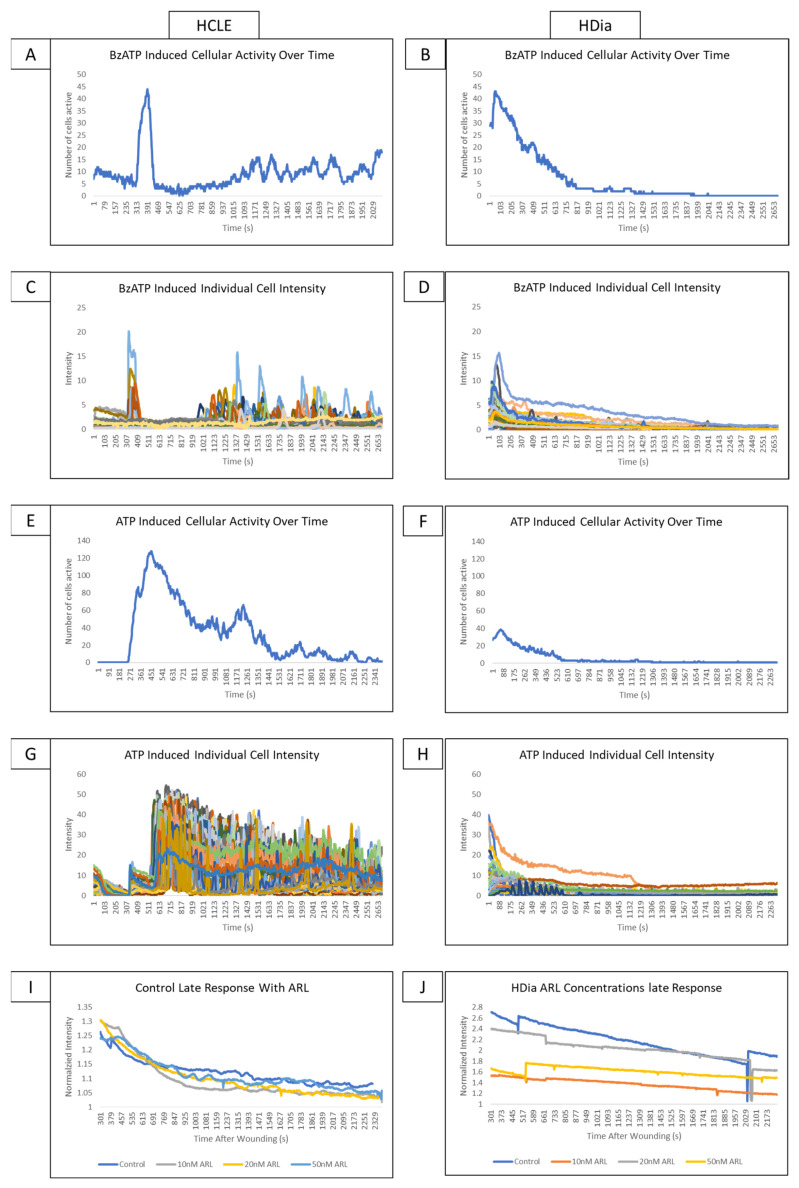
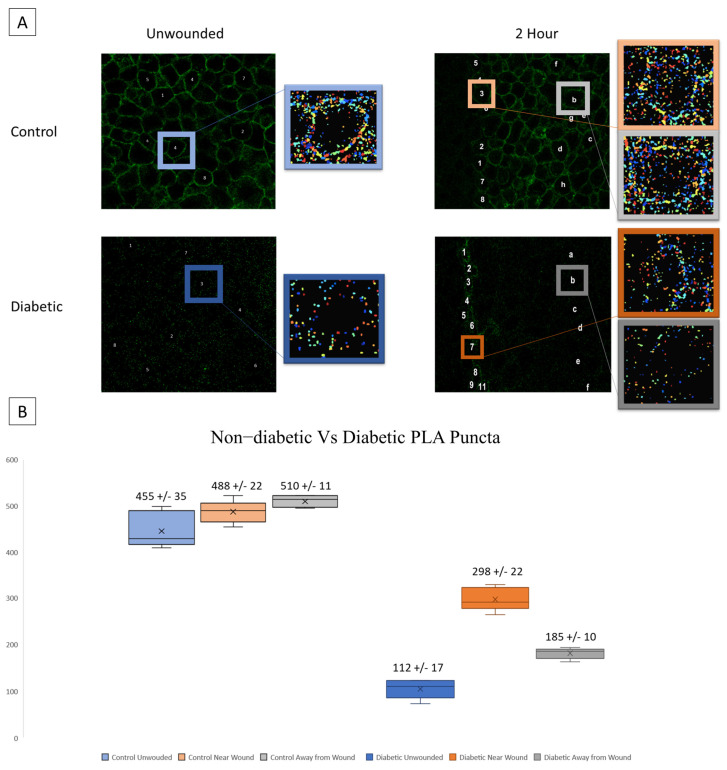
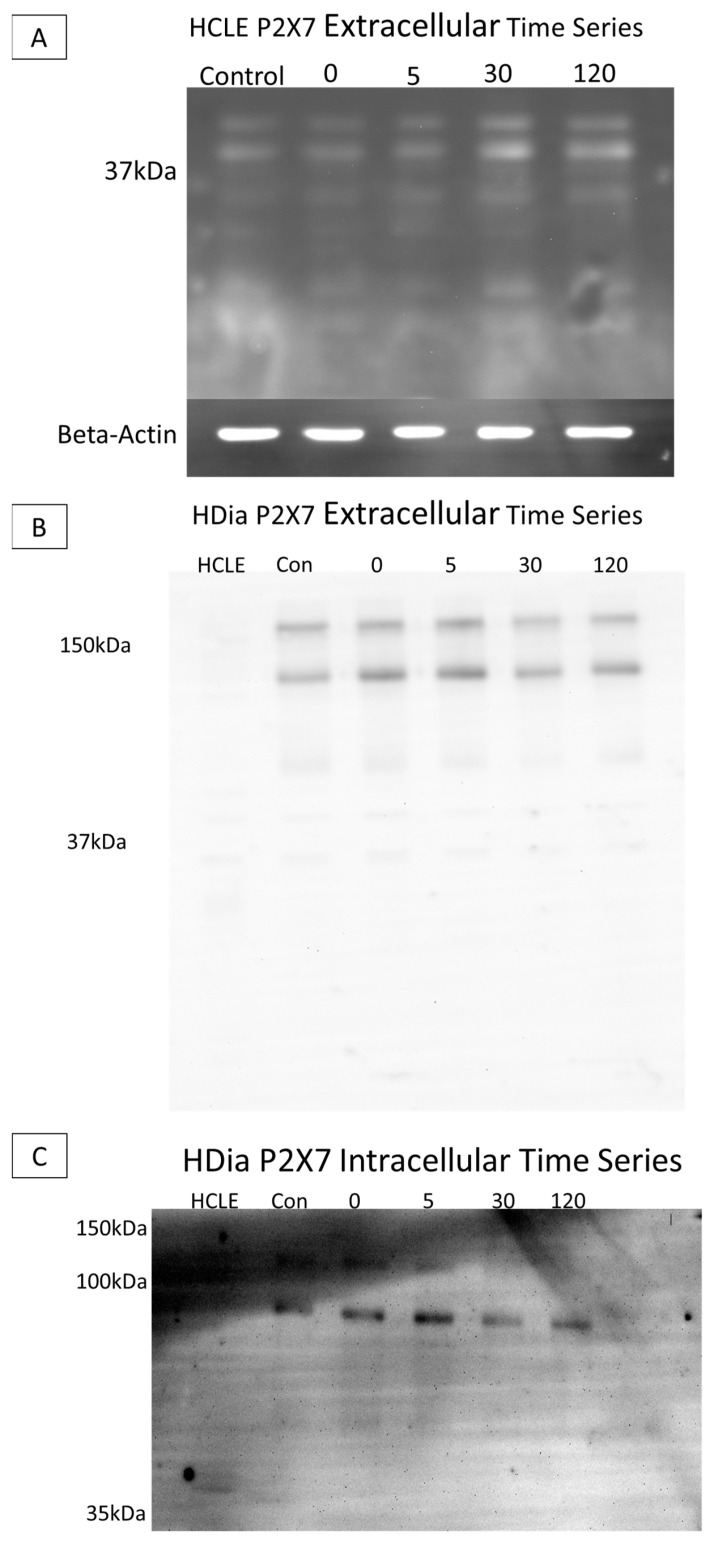
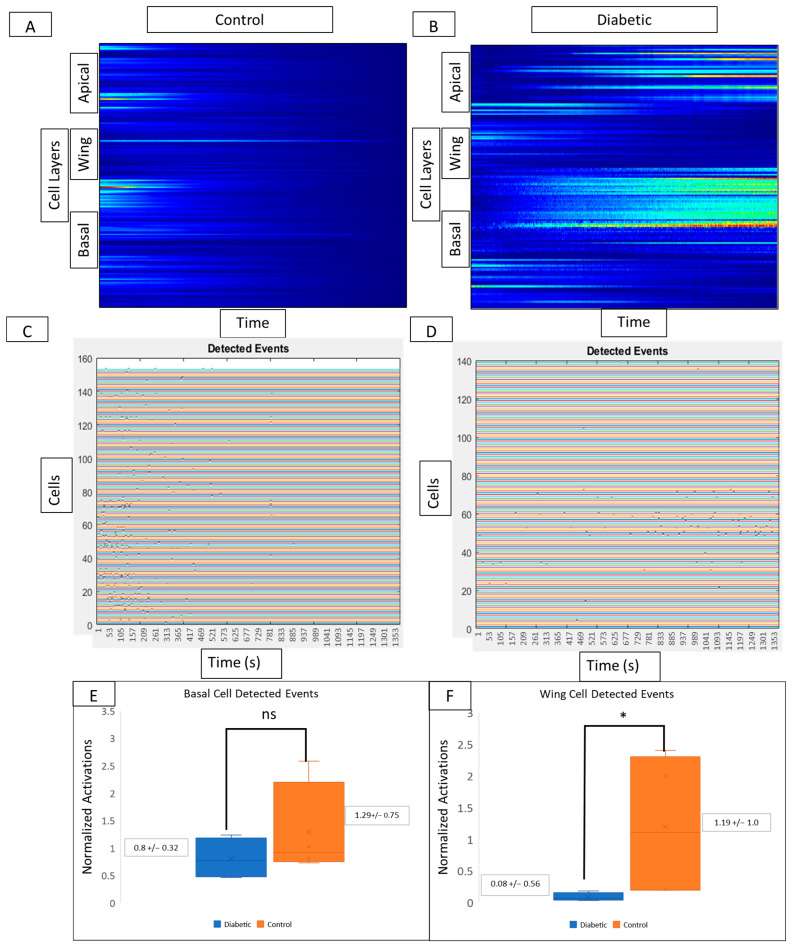
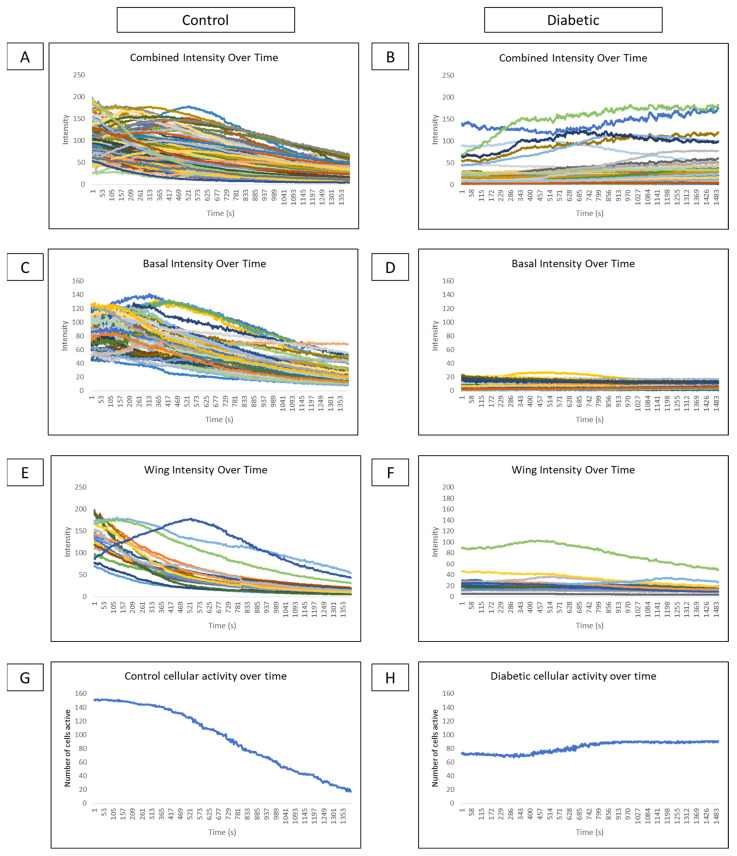
The corneal epithelium is an avascular structure that has a unique wound healing mechanism, which allows for rapid wound closure without compromising vision. This wound healing mechanism is attenuated in diabetic patients, resulting in poor clinical outcomes and recurrent non-healing erosion. We investigated changes in cellular calcium signaling activity during the wound response in murine diabetic tissue using live cell imaging from both ex vivo and in vitro models. The calcium signaling propagation in diabetic cells was significantly decreased and displayed altered patterns compared to non-diabetic controls. Diabetic cells and tissue display distinct expression of the purinergic receptor, P2X7, which mediates the wound healing response. We speculate that alterations in P2X7 expression, interactions with other proteins, and calcium signaling activity significantly impact the wound healing response. This may explain aberrations in the diabetic wound response.

Keywords: cell signaling; cornea; diabetes; live cell imaging; wound healing.


Conflict of interest statement

The authors declare no conflict of interest.

Figures

Figure 1
Figure 1
Comparison of initial cellular calcium activity after injury between control (HCLE), human primary (HPri), human primary diabetic (HDia), mouse primary (MsPri) and mouse primary diabetic (MsDia) cells. (AE) A representative time series shows the wound response in cells before and after injury for control (A), HPri (B), HDia (C), MsPri (D), and MsDia (E). T stands for time in seconds after injury. (FJ) A representative normalized intensity graph of the control (F), HPri (G), HDia (H), MsPri (I), and MsDia (J) initial wound response. (KO) A representative maximum intensity topographical map of the control (K), HPri (L), HDia (M), MsPri (N), and MsDia (O) of initial calcium activity of the wound response. These data represent a minimum of 3 independent replicates.
Figure 2
Figure 2
Comparison of the late wound response in control and diabetic cells of human and mouse models. (AE) A normalized intensity graph of the HCLE control (A), human primary control (B), human diabetic (C), mouse primary control (D), and mouse diabetic (E) late calcium wound response. (FJ) A representative graph of intensity over time for HCLE control (F), human primary control (G), human diabetic (H), mouse primary control (I), and mouse diabetic (J) cells during the late wound response. (KO) A representative maximum-intensity topographical map of the late wound response in HCLE control (K), human primary control (L), human diabetic (M), mouse primary control (N), and mouse diabetic (O) cells. (PT) A representative graph of cellular activity over time during the late wound response in HCLE control (P), human primary control (Q), human diabetic (R), mouse primary control (S), and mouse diabetic (T) cells. Cells were determined to be active if their intensity exceeded an experimentally determined threshold [14]. All images were collected at a rate of 1 Frame/3 s. These data represent a minimum of 3 independent replicates.
Figure 3
Figure 3
Detected events and Activity Propagation between control and diabetic cells from human and mouse models (AD) There were significantly fewer detected signaling events (A) and propagated events (B) in human diabetic cells compared to human non-diabetic controls (* p < 0.05). (C,D) Events were normalized using the average identified cells from each model. There were significant decreased detected events per cell (C) in mouse models compared to human with no significant changes the propagated events per cell (D) in mouse models compared to human. These data represent a minimum of 3 independent replicates.
Figure 4
Figure 4
Addressing the role P2X7 activity on control and diabetic signaling profiles using agonists and antagonists. (A,B) A representative graph of cellular activity over time when HCLE control (A) and HDia (B) cells are stimulated with the P2X7 agonist BzATP. (C,D) A representative graph of intensity over time when HCLE control (C) and HDia (D) cells are stimulated with the P2X7 agonist BzATP. (E,F) A representative graph of cellular activity over time when HCLE control (E) and HDia (F) cells are stimulated with ATP. (G,H) A representative graph of intensity over time when HCLE control (E) and HDia (F) cells are stimulated with ATP. (I,J) A normalized average intensity over time graph of the late wound response in control (I) and HDia (J) with ARL 67156 concentrations: 10 nM, 20 nM, 50 nM. All images were collected at a rate of 1 Frame/3 s. These data represent a minimum of 3 independent replicates.
Figure 5
Figure 5
Co-localization of P2X7 and Pannexin-1 after injury is assessed in diabetic murine globes. (A) Representative images and identified puncta are shown in both wounded and unwounded control and diabetic tissue. Letters and numbers are used to represent which cells were sampled for analysis. In wounded images, numbers represent cells along the wound edge and letters represent cells back from the wound. Colors correspond to localization (blue is unwounded, orange is near the wound edge, and gray is back from the wound edge; data from diabetic tissues are displayed in a darker color scheme). (B) Mean and standard error of the mean of the number of puncta in each condition are displayed in (B). Mean ± SEM are plotted, and two-way ANOVA with Tukey’s multiple comparison of means was performed to compare non-diabetic tissue to diabetic.
Figure 6
Figure 6
SDS electrophoresis Western blot and membrane P2X7 analysis in control and diabetic cells post injury. (A) A representative control HCLE P2X7 receptor extracellular domain time series immunoblot. The ladder has been removed. Column order: unwounded control, immediately after wounding, five minutes after wounding, thirty minutes after wounding, two hours after wounding. Bands were detected at 37 kDa and 24 kDa. Beta-Actin load control is shown below the image. (B) A representative human diabetic P2X7 Receptor extracellular domain time series immunoblot. The ladder has been removed. Column order: HCLE control, HDia unwounded control, immediately after wounding, five minutes after wounding, thirty minutes after wounding, two hours after wounding. Bands were detected at 176 kDa and 127 kDa, 68 kDa, 42 kDa, 33 kDa, and 18 kDa. (C) A representative human diabetic P2X7 receptor intracellular domain time series immunoblot. The ladder has been removed. Column order: HCLE control, unwounded control, immediately after wound, five minutes after wounding, thirty minutes after wounding, two hours after wounding. Bands were detected at 121kDa, 92 kDa, and 54 kDa.
Figure 7
Figure 7
Comparison of cell signaling profiles from ex vivo murine corneal epithelium. Computational analysis of the post-injury wound response at different cellular layers reveals layer-specific differences between diabetic and non-diabetic tissue. (A,B) Representative MATLAB-generated kymographs in control (A) and diabetic (B) tissue reveal signaling profiles and event initiation in apical, wing, and basal layers in both control and diabetic tissue. (C,D) Representative detected events graphs corresponding to MATLAB-generated kymographs in control (C) and diabetic (D) tissue reveal event initiation in apical, wing, and basal layers in both control and diabetic tissue. Experiments were run for 60 min. Identified cells are represented along the y-axis and the x-axis represents time. There are no significant differences in the number of detected events in the basal cell layer (E) between diabetic globes and controls, but there are significantly more signaling events in wing cells from control globes (F) (* p < 0.05).
Figure 8
Figure 8
Comparison of intensity and cellular activity over time in control and diabetic ex vivo globes. (AF) Representative graphs of cellular intensity over time overall and in different layers in control and diabetic globes. Experiments were run for 60 min. (A,B) A representative graph of the intensity of all cell layers in control (A) and diabetic (B) globes. (C,D) A representative graph of the intensity of basal cell layers in control (C) and diabetic (D) globes. (E,F) A representative graph of the intensity of wing cell layers in control (E) and diabetic (F) globes. (G,H) A representative graph of cellular activity over time in basal and wing layers from control (G) and diabetic (H) globes.

Similar articles

Cited by

References

    1. Segars K.L., Azzari N.A., Gomez S., Machen C., Rich C.B., Trinkaus-Randall V. Age dependent changes in corneal epithelial cell signaling. Front. Cell Dev. Biol. 2022;10:886721. doi: 10.3389/fcell.2022.886721. - DOI - PMC - PubMed
    1. Segars K.L., Azzari N.A., Gomez S., Rich C.B., Trinkaus-Randall V. Live-cell imaging of intact ex vivo globes using a novel 3D printed holder. JoVE. 2022;188:e64510. doi: 10.3791/64510. - DOI - PMC - PubMed
    1. Abd Ghafar N., Jalil N.A., Kamarudin T.A. Wound healing of the corneal epithelium: A review. Asian Biomed. Res. Rev. News. 2021;15:199–212. doi: 10.2478/abm-2021-0026. - DOI - PMC - PubMed
    1. Minns M.S., Teicher G., Rich C.B., Trinkaus-Randall V. Purinoreceptor P2X7 regulation of Ca2+ mobilization and cytoskeletal rearrangement is required for corneal reepithelialization after injury. Am. J. Pathol. 2016;186:285–296. doi: 10.1016/j.ajpath.2015.10.006. - DOI - PMC - PubMed
    1. Peyton S.R., Ghajar C.M., Khatiwala C.B., Putnam A.J. The emergence of ECM mechanics and cytoskeletal tension as important regulators of cell function. Cell Biochem. Biophys. 2007;47:300–320. doi: 10.1007/s12013-007-0004-y. - DOI - PubMed

Publication types