. 2023 Dec 22;13(1):33.
doi: 10.3390/cells13010033.

Determination of Binding Affinity of Antibodies to HIV-1 Recombinant Envelope Glycoproteins, Pseudoviruses, Infectious Molecular Clones, and Cell-Expressed Trimeric gp160 Using Microscale Thermophoresis

Affiliations

Determination of Binding Affinity of Antibodies to HIV-1 Recombinant Envelope Glycoproteins, Pseudoviruses, Infectious Molecular Clones, and Cell-Expressed Trimeric gp160 Using Microscale Thermophoresis

Shraddha Basu et al. Cells. .

Abstract

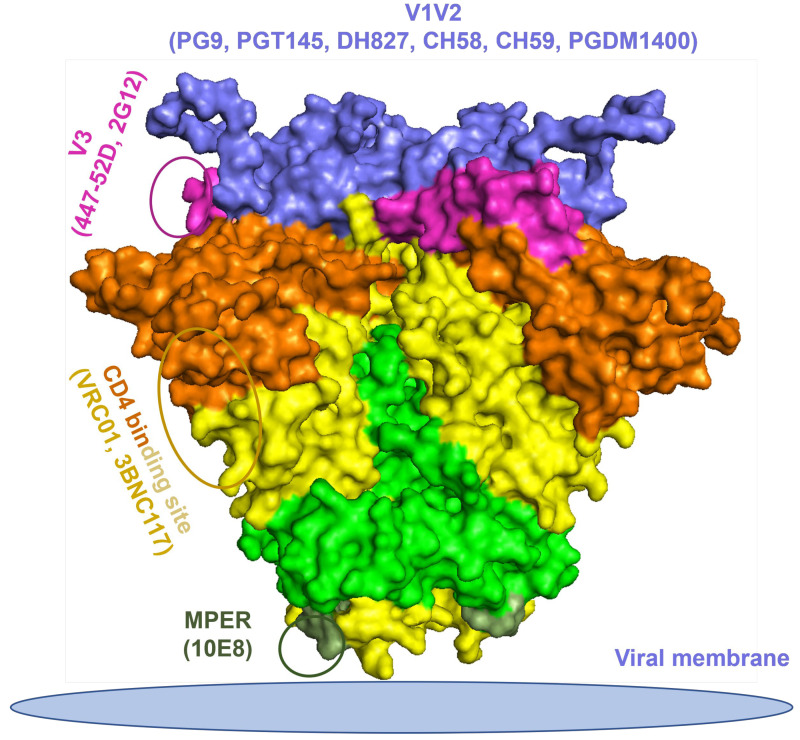
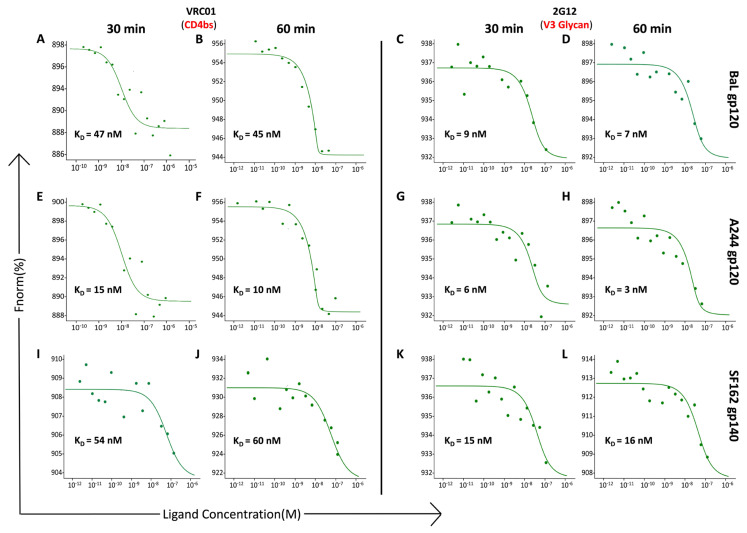
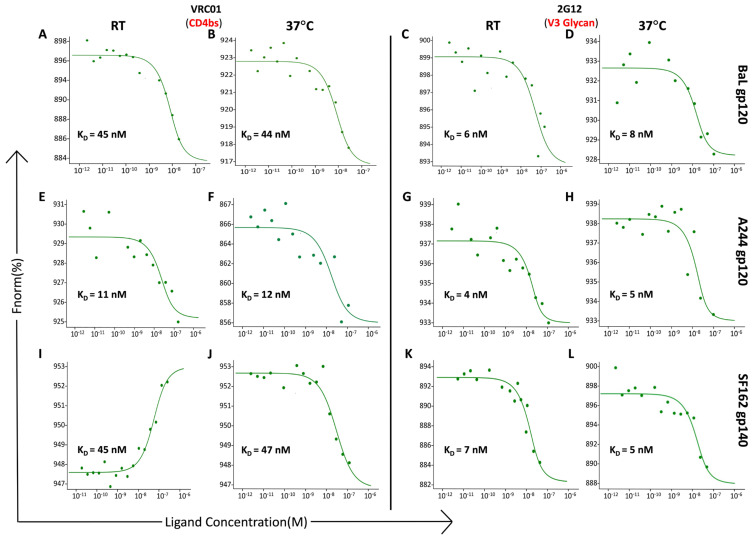
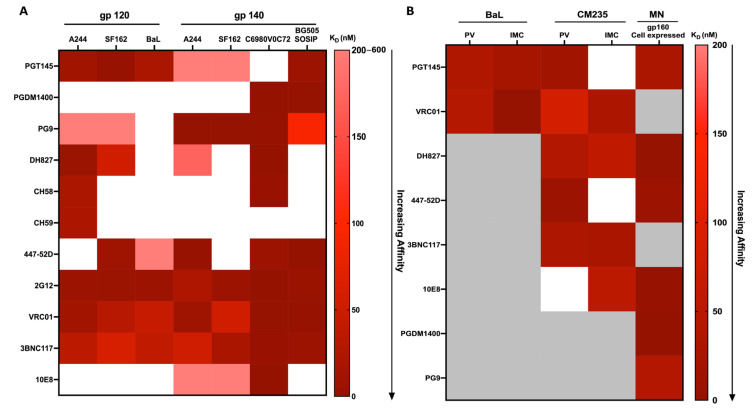
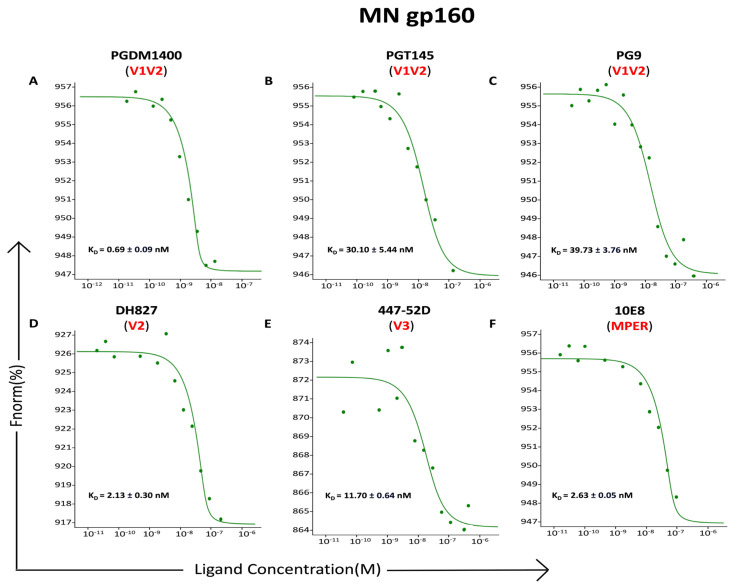
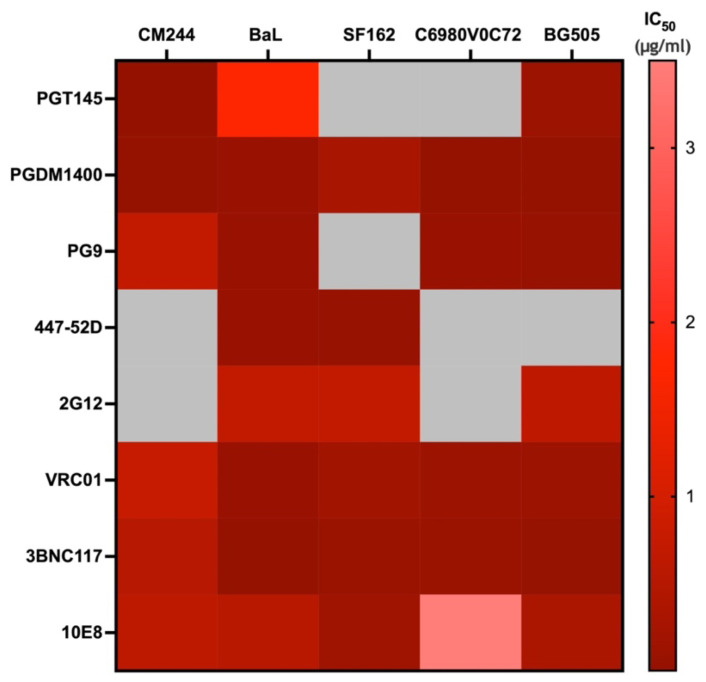
Developing a preventative vaccine for HIV-1 has been a global priority. The elicitation of broadly neutralizing antibodies (bNAbs) against a broad range of HIV-1 envelopes (Envs) from various strains appears to be a critical requirement for an efficacious HIV-1 vaccine. To understand their ability to neutralize HIV-1, it is important to characterize the binding characteristics of bNAbs. Our work is the first to utilize microscale thermophoresis (MST), a rapid, economical, and flexible in-solution temperature gradient method to quantitatively determine the binding affinities of bNAbs and non-neutralizing monoclonal antibodies (mAbs) to HIV-1 recombinant envelope monomer and trimer proteins of different subtypes, pseudoviruses (PVs), infectious molecular clones (IMCs), and cells expressing the trimer. Our results demonstrate that the binding affinities were subtype-dependent. The bNAbs exhibited a higher affinity to IMCs compared to PVs and recombinant proteins. The bNAbs and mAbs bound with high affinity to native-like gp160 trimers expressed on the surface of CEM cells compared to soluble recombinant proteins. Interesting differences were seen with V2-specific mAbs. Although they recognize linear epitopes, one of the antibodies also bound to the Envs on PVs, IMCs, and a recombinant trimer protein, suggesting that the epitope was not occluded. The identification of epitopes on the envelope surface that can bind to high affinity mAbs could be useful for designing HIV-1 vaccines and for down-selecting vaccine candidates that can induce high affinity antibodies to the HIV-1 envelope in their native conformation.

Keywords: HIV-1 epitopes; MST; bNAb; binding affinity; cell-expressed trimeric protein; infectious molecular clone; mAb; pseudovirus; recombinant HIV-1 proteins.


Conflict of interest statement

S.B., N.G., J.K., H.V.T., M.C., M.G.J. employed by The Henry M. Jackson Foundation for the Advancement of Military Medicine. The remaining author declares that the research was conducted in the absence of any commercial or financial relationships that could be construed as potential conflicts of interest.

Figures

Figure 1
Figure 1
HIV-1 envelope glycoprotein spike trimer epitopes that bind various broadly neutralizing and non-neutralizing monoclonal antibodies (bNAbs and mAbs). The surface representation of the Env is derived from the crystal structure of BG505 SOSIP.664 (PDB code 5FYJ). The HIV-1 Env epitopes are highlighted in different colors: CD4bs (brown and yellow), V1/V2 (purple), V3/Asn332 glycan patch (magenta), MPER (dark green). Other unspecified regions are yellow for the gp120 moiety and light green for the gp41 moiety. The structural figure was generated with the program PyMOL, using the PDB code 5FYJ.
Figure 2
Figure 2
Impact of incubation time on the binding affinity of monoclonal antibodies (mAbs) to HIV-1 envelope proteins. Following a binding check, a constant concentration of labeled mAbs (VRC01: 12.5 nM; 2G12: 15 nM) in DPBS buffer without Ca2+ and Mg2+, pH 7.2, and containing 0.01% Tween-20 was used for determining the binding affinity. Sixteen premium capillaries were loaded with VRC01 or 2G12 and serially diluted (1:1) HIV-1 Env proteins, BaL gp120, A244 gp120, and SF162 gp140 (100 nM, 150 nM, and 75 nM, respectively), in a final volume of 10 µL. A Microscale Thermophoresis (MST) signal was then acquired using a NanoTemper Technologies Monolith NT.115 Pico instrument at an excitation power of 60% and an MST power of 60%. The signal was analyzed after the start of the IR laser, and the obtained data were fitted using MO. affinity analysis software provided by NanoTemper. The labeled mAbs and the serially diluted Env proteins were each incubated for 30 min or 60 min at RT and then loaded into the capillaries for affinity measurement. MST traces and binding affinity data are as shown: (A,B,E,F,I,J) VRC01 and (C,D,G,H,K,L) 2G12 with BaL gp120 (AD); A244 gp120 (EH); and SF162 gp140 (IL), respectively. Relatively similar binding affinities were obtained at the incubation times tested. The graphs are presented as Fnorm [%] vs. ligand concentration (M).
Figure 3
Figure 3
Impact of incubation temperature on the binding affinity of monoclonal antibodies (mAbs) to HIV-1 envelope proteins. Following a binding check, a constant concentration of the labeled mAbs (VRC01: 12.5 nM; 2G12: 15 nM) in DPBS buffer without Ca2+ and Mg2+, pH 7.2, and containing 0.01% Tween-20 was used for determining the binding affinity. Sixteen premium capillaries were loaded with VRC01 or 2G12 and serially diluted (1:1) HIV-1 Env proteins, BaL gp120, A244 gp120, and SF162 gp140 (100 nM, 150 nM and 75 nM, respectively), in a final volume of 10 µL. A Microscale Thermophoresis (MST) signal was then acquired using a NanoTemper Technologies Monolith NT.115 Pico instrument at an excitation power of 60% and an MST power of 60%. The signal was analyzed after the start of the IR laser, and the obtained data were fitted using MO. affinity analysis software provided by NanoTemper. The labeled mAbs and the serially diluted Env proteins were each incubated for 30 min at RT or 37 °C and then loaded into the capillaries for affinity measurement. MST traces and binding affinity data are as shown: (A,B,E,F,I,J) VRC01 and (C,D,G,H,K,L) 2G12 with BaL gp120 (AD); A244 gp120 (EH); and SF162 gp140 (IL), respectively. Relatively similar binding affinities were obtained at the incubation temperatures tested. The graphs are presented as Fnorm [%] vs. ligand concentration (M).
Figure 4
Figure 4
Heat maps depicting the binding affinities of monoclonal antibodies (mAbs) to recombinant HIV-1 envelope proteins, pseudoviruses (PVs), infectious molecular clones (IMCs), and cell- expressed gp160. (A) Binding affinities (KD) of mAbs to gp120 (A244, SF162, BaL) and gp140 (A244, SF162, C6980V0C72, BG505 SOSIP) proteins as determined by MST. (B) Binding affinities (KD) of mAbs to pseudoviruses (PVs), infectious molecular clones (IMCs), BaL and CM235, and cell surface-expressed gp160 (MN) protein. The color bar on the right side of each heat map exhibits the range of binding affinity (KD). Binding affinities (nM) are represented ranging from a lighter color (weaker affinity) to a darker color (stronger affinity). The absence of binding is represented by white, and grey indicates binding not determined. Heat maps were generated using GraphPad Prism software (version 10.0.1).
Figure 5
Figure 5
Microscale thermophoresis (MST) traces representing the binding affinities (KD) of monoclonal antibodies (mAbs) to a CEM cell line (CEM-NKR 5001A) expressing the MN gp160 HIV-1 Env protein on the cell surface. The labeled mAbs were used at the following final concentrations: (A) PGDM1400 (20 nM), (B) PGT145 (30 nM), (C) PG9 (30 nM), (D) DH827 (50 nM), (E) 447-52D (20 nM), and (F) 10E8 (50 nM). To determine the binding affinity, the capillaries were loaded with serially diluted (1:1) cells expressing the MN gp160 at a starting concentration of 5 × 10⁶ cells/mL in a final volume of 10 µL. Experiments were performed at room temperature for 30 min. The graphs are represented as Fnorm [%] vs. ligand concentration (M).
Figure 6
Figure 6
Heat map of neutralization values (IC50, μg/mL) obtained from the CATNAP database of monoclonal antibodies individually tested with different strains of HIV-1 (CM244, BaL, SF162, C6980V0C72, and BG505) for their neutralization potencies. The color bar on the right side indicates the range of neutralization potency IC50 (μg/mL). Darker colors indicate lower IC50 values (potent neutralization), while lighter colors indicate higher IC50 values (weaker neutralization). The grey color indicates neutralization not determined. Heat maps were generated using GraphPad Prism software (version 10.0.1).
Figure 7
Figure 7
Pearson correlation analysis of neutralization (IC50, μg/mL) data vs. binding affinities (nM) of monoclonal antibodies (mAbs) with HIV-1 proteins, pseudoviruses (PVs), infectious molecular clones (IMCs), and MN gp160 (cell-expressed trimer protein), as determined by MST. X-axis represents neutralization values (IC50 μg/mL); Y-axis represents binding affinities (KD nM). mAbs were differentiated in different colors (PGT145—blue, PGDM1400—fluorescent green, PG9—magenta, 447-52D—yellow, 2G12—purple, VRC01—orange, 3BNC117—cyan, and 10E8—dark green). There is no correlation, and it is not statistically significant. (A) Pearson correlation analysis of the binding affinities of the mAbs with the HIV-1 envelope monomer and trimer proteins (A244, BaL, SF162, C6980V0C72, and BG505) vs. neutralization data of the corresponding mAbs individually tested with similar strains of HIV-1 (CM244, BaL, SF162, C6980V0C72, and BG505). (B) Pearson correlation analysis of the binding affinities of mAbs with BaL and CM235 PVs, IMCs, and cell-expressed MN gp160 vs. neutralization data of the same strains of virus (BaL, CM235, and MN) with corresponding mAbs obtained from CATNAP. Correlation analyses were performed with GraphPad Prism v10.

Similar articles

Cited by

References

    1. UNAIDS. 2023. [(accessed on 4 October 2023)]. Available online: https://www.unaids.org/sites/default/files/media_asset/UNAIDS_FactSheet_....
    1. Chan D.C., Fass D., Berger J.M., Kim P.S. Core structure of gp41 from the HIV envelope glycoprotein. Cell. 1997;89:263–273. doi: 10.1016/S0092-8674(00)80205-6. - DOI - PubMed
    1. Deng H., Liu R., Ellmeier W., Choe S., Unutmaz D., Burkhart M., Di Marzio P., Marmon S., Sutton R.E., Hill C.M., et al. Identification of a major co-receptor for primary isolates of HIV-1. Nature. 1996;381:661–666. doi: 10.1038/381661a0. - DOI - PubMed
    1. Falkenhagen A., Joshi S. HIV Entry and Its Inhibition by Bifunctional Antiviral Proteins. Mol. Ther. Nucleic Acids. 2018;13:347–364. doi: 10.1016/j.omtn.2018.09.003. - DOI - PMC - PubMed
    1. Fouts T., Godfrey K., Bobb K., Montefiori D., Hanson C.V., Kalyanaraman V.S., DeVico A., Pal R. Crosslinked HIV-1 envelope–CD4 receptor complexes elicit broadly cross-reactive neutralizing antibodies in rhesus macaques. Proc. Natl. Acad. Sci. USA. 2002;99:11842–11847. doi: 10.1073/pnas.182412199. - DOI - PMC - PubMed

Publication types