. 2023 Dec 27;13(1):55.
doi: 10.3390/cells13010055.

CD49f and CD146: A Possible Crosstalk Modulates Adipogenic Differentiation Potential of Mesenchymal Stem Cells

Affiliations

CD49f and CD146: A Possible Crosstalk Modulates Adipogenic Differentiation Potential of Mesenchymal Stem Cells

An Nguyen-Thuy Tran et al. Cells. .

Abstract

Background: The lack of appropriate mesenchymal stem cells (MSCs) selection methods has given the challenges for standardized harvesting, processing, and phenotyping procedures of MSCs. Genetic engineering coupled with high-throughput proteomic studies of MSC surface markers arises as a promising strategy to identify stem cell-specific markers. However, the technical limitations are the key factors making it less suitable to provide an appropriate starting material for the screening platform. A more accurate, easily accessible approach is required to solve the issues.

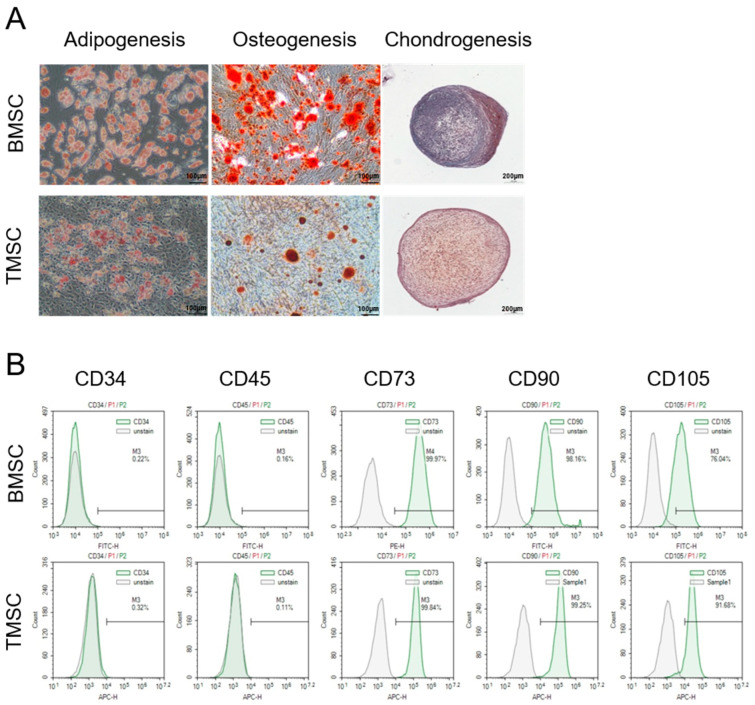
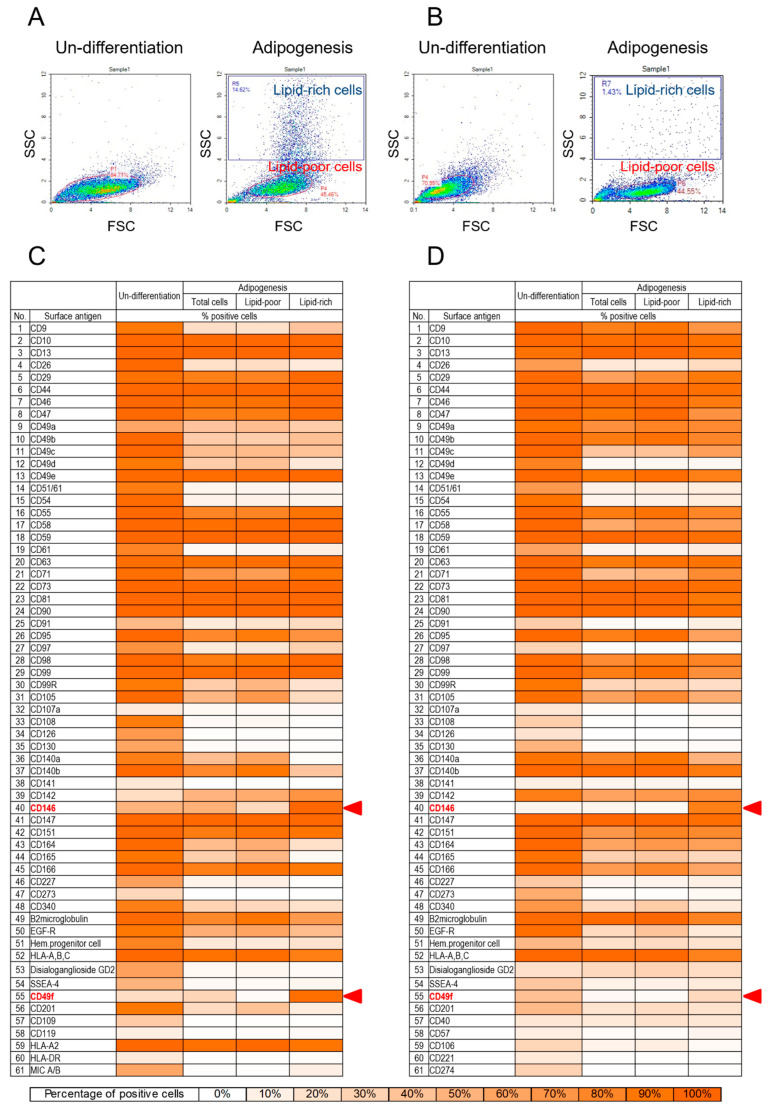
Methods: This study established a high-throughput screening strategy with forward versus side scatter gating to identify the adipogenesis-associated markers of bone marrow-derived MSCs (BMSCs) and tonsil-derived MSCs (TMSCs). We classified the MSC-derived adipogenic differentiated cells into two clusters: lipid-rich cells as side scatter (SSC)-high population and lipid-poor cells as SSC-low population. By screening the expression of 242 cell surface proteins, we identified the surface markers which exclusively found in lipid-rich subpopulation as the specific markers for BMSCs and TMSCs.

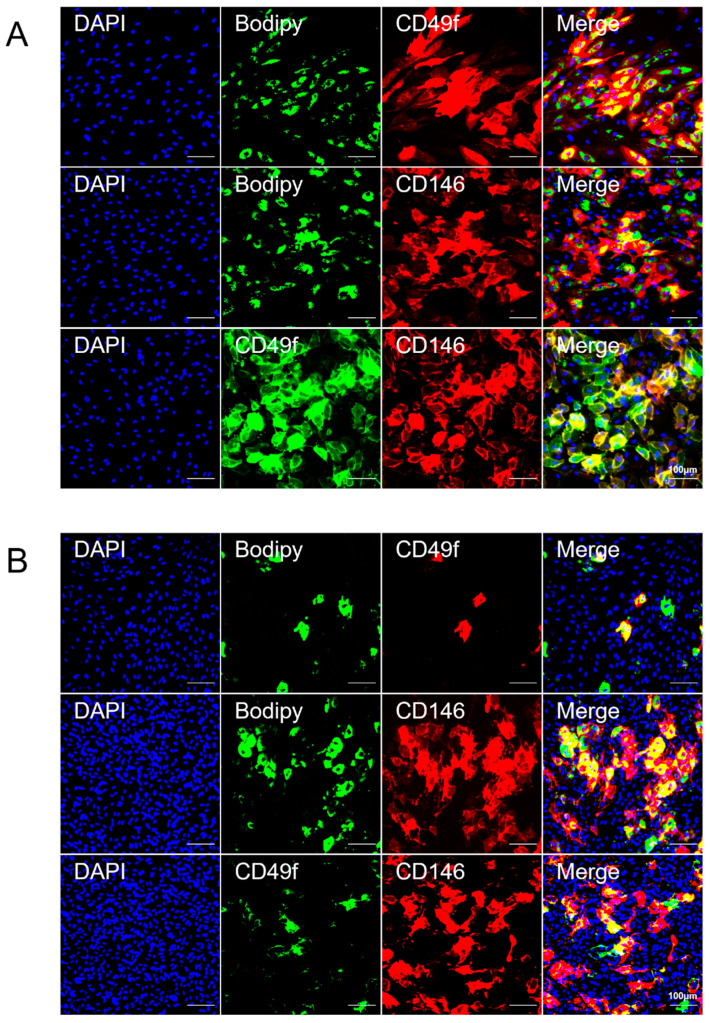
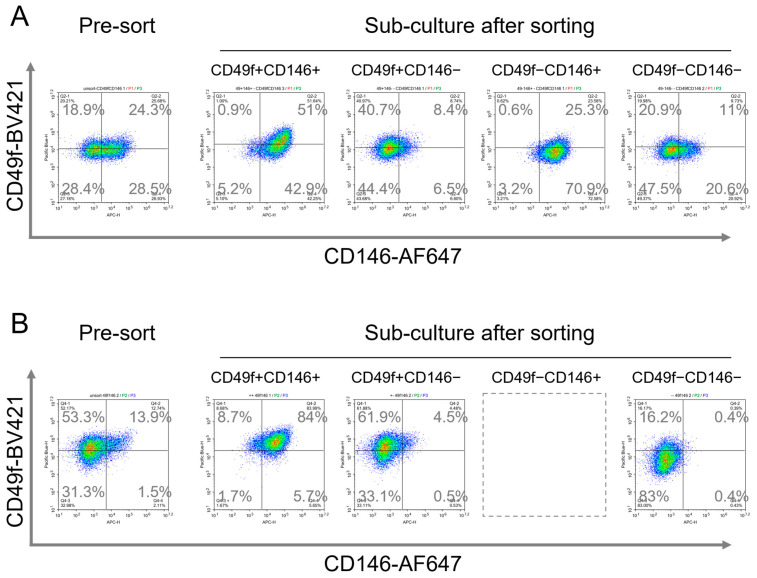
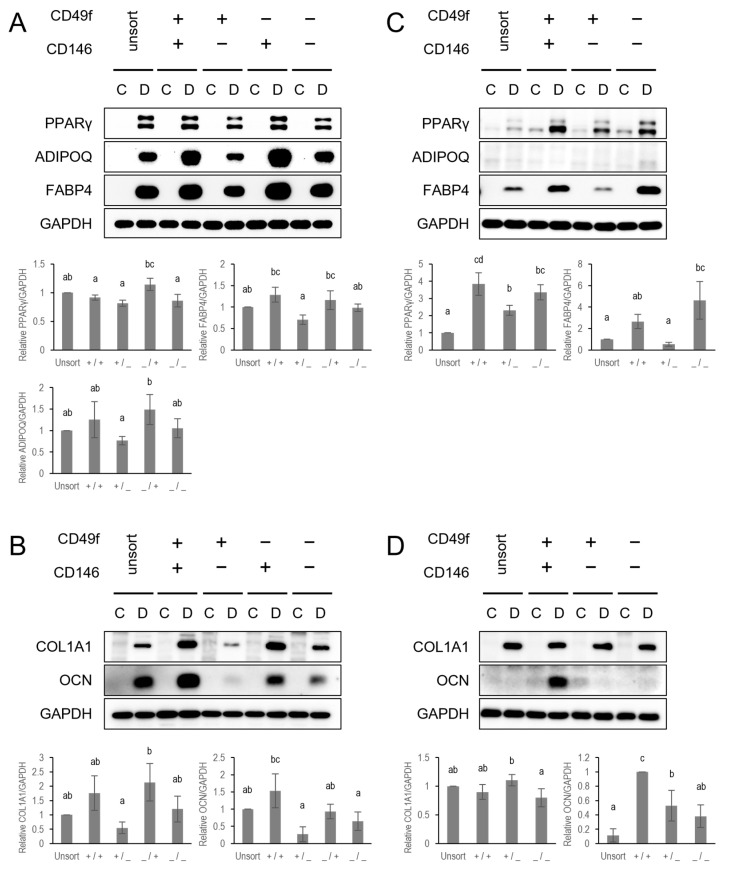
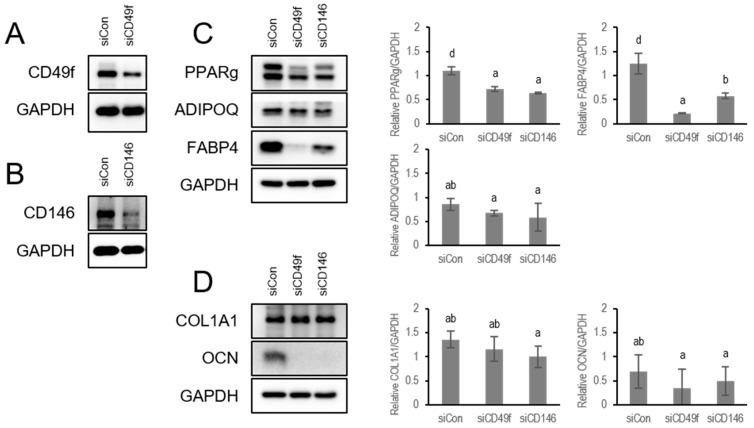
Results: High-throughput screening of the expression of 242 cell surface proteins indicated that CD49f and CD146 were specific for BMSCs and TMSCs. Subsequent immunostaining confirmed the consistent specific expression of CD49f and CD146 and in BMSCs and TMSCs. Enrichment of MSCs by CD49f and CD146 surface markers demonstrated that the simultaneous expression of CD49f and CD146 is required for adipogenesis and osteogenesis of mesenchymal stem cells. Furthermore, the fate decision of MSCs from different sources is regulated by distinct responses of cells to differentiation stimulations despite sharing a common CD49f+CD146+ immunophenotype.

Conclusions: We established an accurate, robust, transgene-free method for screening adipogenesis associated cell surface proteins. This provided a valuable tool to investigate MSC-specific markers. Additionally, we showed a possible crosstalk between CD49f and CD146 modulates the adipogenesis of MSCs.

Keywords: CD146; CD49f; high-throughput screening; light scatter gating; mesenchymal stem cell-specific markers.


Conflict of interest statement

The authors declare no conflict of interest.

Figures

Figure 1
Figure 1
MSCs general characteristics. (A) Tri-lineage differentiation potential of BMSCs (upper panel) and TMSCs (lower panel) toward adipogenic, osteogenic and chondrogenic lineages was confirmed by staining with Oil red O (adipogenesis), Alizarin red S (osteogenesis), and Safranin O (chondrogenesis). Scale bar: adipogenesis and osteogenesis: 100 μm; chondrogenesis: 200 μm. (B) Flow cytometric analysis of BMSCs (upper panel) and TMSCs (lower panel). Both BMSCs and TMSCs expressed the classical set of mesenchymal stem cell surface markers, which is one of the minimal criteria for the identification of human MSCs proposed by the ISCT.
Figure 2
Figure 2
Generic method for FACS-based high-throughput screening of adipogenesis associated markers of MSCs. (A,B) Cell surface proteome of BMSCs (A) and TMSCs (B) were analyzed by flow cytometry. Adipogenic differentiated BMSCs and TMSCs were gated into lipid-rich cells as the SSC-high population and lipid-poor cells as the SSC-low population. The surface markers which exclusively found in lipid-rich subpopulation were considered as adipogenesis-associated markers. (C) Heatmap of the expression level of surface proteins on undifferentiated and adipogenic differentiated BMSCs. CD49f and CD146 were almost exclusively expressed in the lipid-rich population. The results are an average value from three independent experiments. (D) Heatmap of the expression level of surface proteins on undifferentiated and adipogenic differentiated TMSCs. CD49f and CD146 were almost exclusively expressed in the lipid-rich subpopulation. CD49f surface protein was significantly downregulated in adipogenic differentiated TMSCs. The results are an average value from three independent experiments.
Figure 3
Figure 3
The distinct expression pattern of CD49f and CD146 on adipogenic differentiated MSCs. (A) Immunofluorescent imaging of adipogenic differentiated BMSCs. Cells were stained for DAPI (blue), Bodipy (green), and CD49f (red) or CD146 (red). Data show the colocalization of CD49f-stained (red) or CD146-stained (red) BMSCs with Bodipy (green). For double-staining, cells were stained for DAPI (blue), CD49f (green), and CD146 (red). Double-staining of CD49f (green) and CD146 (red) revealed that these two markers were almost colocalized. Scale bar: 100 μm. (B) Immunofluorescent imaging of adipogenic differentiated TMSCs. Cells were stained for DAPI (blue), Bodipy (green), and CD49f (red) or CD146 (red). Data show the colocalization of CD49f-stained (red) or CD146-stained (red) TMSCs with Bodipy (green). For double-staining, cells were stained for DAPI (blue), CD49f (green), and CD146 (red). The CD49f expression level was significantly downregulated. Scale bar: 100 μm.
Figure 4
Figure 4
Flow cytometry immunophenotyping of the pre-sort and culture-expand subpopulations. (A) Pre-sort BMSCs consisted of CD49f+CD146+, CD49f+CD146, CD49fCD146+, and CD49fCD146 subpopulations. Sub-culture after sorting partially restored the expression levels of these markers. (B) Pre-sort TMSCs consisted of CD49f+CD146+, CD49f+CD146, and CD49fCD146 subpopulations. Sub-culture after sorting partially restored the expression levels of these markers.
Figure 5
Figure 5
CD49f and CD146 crosstalk modulates differentiation potentials of MSCs. (A,B) Western blotting was used to assess the protein expression levels of adipogenic (A) and osteogenic (B) indicators in BMSCs after 14d of differentiation. C, control; D, differentiation. Bar charts show differentiation indicator quantitation normalized to GAPDH. The results are an average value from three independent experiments and presented as mean ± SD. Alphabet letters indicate statistically significant differences. Bars with different letters are considered statistically significant with p < 0.05. (C,D) Western blotting analysis was used to assess the protein expression levels of adipogenic (C) and osteogenic (D) indicators in TMSCs after 14 d of differentiation. C, control; D, differentiation. Bar charts show differentiation indicator quantitation normalized to GAPDH. The results are an average value from three independent experiments and presented as mean ± SD. Alphabet letters indicate statistically significant differences. Bars with different letters are considered statistically significant with p < 0.05. Full-length blots are presented in Supplementary Information: Full-length western blot images.
Figure 6
Figure 6
siRNA-mediated knockdown of CD49f or CD146 expression level in BMSCs. (A,B) Western blotting was used to analyze the protein expression levels of CD49f and CD146 after siRNA-mediated knockdown in BMSCs. (C,D) The effect of CD49f or CD146 knockdown on adipogenesis (C) and osteogenesis (D) of BMSCs. Bar charts show differentiation indicator quantitation normalized to GAPDH. The results are the average value from three independent experiments and presented as mean ± SD. Alphabet letters indicate statistically significant differences. Bars with different letters are considered statistically significant with p < 0.05. Full-length blots are presented in Supplementary Information: Full-length western blot images.

Similar articles

Cited by

References

    1. Caplan A.I., Correa D. The MSC: An injury drugstore. Cell Stem Cell. 2011;9:11–15. doi: 10.1016/j.stem.2011.06.008. - DOI - PMC - PubMed
    1. Pittenger M.F., Discher D.E., Peault B.M., Phinney D.G., Hare J.M., Caplan A.I. Mesenchymal stem cell perspective: Cell biology to clinical progress. NPJ Regen. Med. 2019;4:22. doi: 10.1038/s41536-019-0083-6. - DOI - PMC - PubMed
    1. Han Y., Yang J., Fang J., Zhou Y., Candi E., Wang J., Hua D., Shao C., Shi Y. The secretion profile of mesenchymal stem cells and potential applications in treating human diseases. Signal Transduct. Target. Ther. 2022;7:92. doi: 10.1038/s41392-022-00932-0. - DOI - PMC - PubMed
    1. Hoang D.M., Pham P.T., Bach T.Q., Ngo A.T.L., Nguyen Q.T., Phan T.T.K., Nguyen G.H., Le P.T.T., Hoang V.T., Forsyth N.R., et al. Stem cell-based therapy for human diseases. Signal Transduct. Target. Ther. 2022;7:272. doi: 10.1038/s41392-022-01134-4. - DOI - PMC - PubMed
    1. Sun C., Wang L., Wang H., Huang T., Yao W., Li J., Zhang X. Single-cell RNA-seq highlights heterogeneity in human primary Wharton’s jelly mesenchymal stem/stromal cells cultured in vitro. Stem Cell Res. Ther. 2020;11:149. doi: 10.1186/s13287-020-01660-4. - DOI - PMC - PubMed

Publication types

LinkOut - more resources