. 2023 Dec 29;13(1):76.
doi: 10.3390/cells13010076.

Metabolic Changes during In Vivo Maturation of PSC-Derived Skeletal Myogenic Progenitors

Affiliations

Metabolic Changes during In Vivo Maturation of PSC-Derived Skeletal Myogenic Progenitors

Phablo Abreu et al. Cells. .

Abstract

In vitro-generated pluripotent stem cell (PSC)-derived Pax3-induced (iPax3) myogenic progenitors display an embryonic transcriptional signature, but upon engraftment, the profile of re-isolated iPax3 donor-derived satellite cells changes toward similarity with postnatal satellite cells, suggesting that engrafted PSC-derived myogenic cells remodel their transcriptional signature upon interaction within the adult muscle environment. Here, we show that engrafted myogenic progenitors also remodel their metabolic state. Assessment of oxygen consumption revealed that exposure to the adult muscle environment promotes overt changes in mitochondrial bioenergetics, as shown by the substantial suppression of energy requirements in re-isolated iPax3 donor-derived satellite cells compared to their in vitro-generated progenitors. Mass spectrometry-based metabolomic profiling further confirmed the relationship of engrafted iPax3 donor-derived cells to adult satellite cells. The fact that in vitro-generated myogenic progenitors remodel their bioenergetic signature upon in vivo exposure to the adult muscle environment may have important implications for therapeutic applications.

Keywords: in vitro; in vivo; metabolism; myogenic progenitors; pluripotent stem cells; satellite cells.


Conflict of interest statement

R.C.R.P. is cofounder and holds equity in Myogenica. T.N. is a cofounder and holds equity in Omix Technologies. All other authors have no competing financial interests.

Figures

Figure 1
Figure 1
Transcriptional profile of metabolic programs in murine iPax3 myogenic progenitors compared to adult satellite cells. (A) Venn diagram of genes annotated to metabolic pathways with the Reactome and KEGG databases. (B) Venn diagram showing overlap between differentially expressed genes (DEGs) after pairwise comparisons and genes annotated to metabolic pathways (top), as well as a breakdown of upregulated (brown) and downregulated (blue) DEGs (bottom). (C) Volcano plot for 986 metabolic genes. (D) Principal component analysis (PCA) of bulk RNA-seq in in vitro iPax3 (orange) and satellite cells (blue). (E,F) Representative gene expression levels of in vitro iPax3 myogenic progenitors (orange) vs. satellite cells (blue) across metabolic pathways enriched in cluster 1 (E) and cluster 2 (F). (G) PCA of microarray in in vivo iPax3 myogenic progenitors (brown) and adult satellite cells (blue). (H,I) Representative gene expression levels of in vivo iPax3 myogenic progenitors (brown) vs. satellite cells (blue) across metabolic pathways previously enriched in cluster 1 (H) and cluster 2 (I). Studies represent three biological samples per group. **** p < 0.0001 by ANOVA with Bonferroni correction. Abbreviations: Tricarboxylic acid (TCA), Electron Transport Chain (ETC).
Figure 2
Figure 2
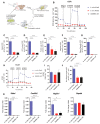
Bioenergetics of PSC-derived myogenic progenitors and re-isolated donor-derived satellite cells. (A) Outline of experiments. (B) Typical traces of real-time OCR before and after the addition of inhibitors to derive several parameters of mitochondrial respiration in Pax3 in vitro, iPax3 in vivo, and adult satellite cells (SC). (C) Initially, basal O2 consumption OCR was measured, from which basal cellular respiration can be derived by subtracting non-mitochondrial respiration. (D) ATP-linked represent the difference in OCR before and after Oligomycin. (E) H+ leak-linked OCR in Pax3 in vitro, iPax3 in vivo, and adult SC represent the difference in OCR after Oligomycin injection and Antimycin A and Rotenone. (F) Maximal OCR was determined via addition of a mitochondrial uncoupler CCCP that stimulates maximal respiration by mimicking a physiological energy demand, leading to an increase in oxygen consumption. (G) Spare respiratory capacity OCR reflects the difference between basal and maximal respiratory rate, and this capacity was determined by measuring OCR after treatment with oligomycin and CCCP. (H) Real-time whole-cell extracellular acidification rate (ECAR) is an indicator of the rate of acid efflux formed during glycolytic energy metabolism used to generate ATP. (I) ECAR quantification in iPax3 in vitro, iPax3 in vivo, and adult SC. (J) Non-mitochondrial respiration OCR has been observed at low levels in iPax3 in vivo and Adult SC. (K) Graphs shows gene expression for Sdhd, Cox6b2, Atp5c1, and gapdh. Results are normalized to Actb. Data are presented as mean ± SEM (n = three biological samples per group). * p < 0.05, ** p < 0.01, and *** p < 0.001 from one-way ANOVA followed by post hoc Tukey.
Figure 3
Figure 3
Metabolomics profiling of in vitro-generated iPax3 myogenic progenitors and post-transplant re-isolated iPax3 donor-derived satellite cells. (A) PCA of metabolomics data generated from in vitro iPax3 myogenic progenitors and re-isolated iPax3 donor-derived satellite cells (in vivo), along with satellite cells (n = four per group). (B) Hierarchical clustering analysis of these data color-coded from blue to red according to z-score. (C) Pathway enrichment analysis of ANOVA significant (p < 0.05) features. The size of each circle corresponds to its enrichment factor and color corresponds to p-value (from white to red). Individual values (log2[peak area in arbitrary units]) are shown for (D) amino acids, (E) glutathione, (GSH) homeostasis, and (F) purine and pyrimidine metabolism are shown. * p < 0.05, ** p < 0.01, *** p < 0.001, **** p < 0.0001, from two-way ANOVA comparisons.
Figure 4
Figure 4
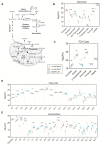
Energy metabolism of in vitro-generated iPax3 myogenic progenitors and re-isolated iPax3 donor-derived satellite cells. (A) A pathway map along with individual values (log2[peak area in arbitrary units]) are shown for (B) glycolysis, (C) tricarboxylic acid (TCA) cycle, (D) fatty acids, and (E) acylcarnitines. * p < 0.05, ** p < 0.01, *** p < 0.001, **** p < 0.0001, from two-way ANOVA comparisons.

Similar articles

Cited by

References

    1. Seale P., Sabourin L.A., Girgis-Gabardo A., Mansouri A., Gruss P., Rudnicki M.A. Pax7 is required for the specification of myogenic satellite cellls. Cell. 2000;102:777–786. doi: 10.1016/S0092-8674(00)00066-0. - DOI - PubMed
    1. Montarras D., Morgan J., Collins C., Relaix F., Zaffran S., Cumano A., Partridge T., Buckingham M. Direct isolation of satellite cells for skeletal muscle regeneration. Science. 2005;309:2064–2067. doi: 10.1126/science.1114758. - DOI - PubMed
    1. Collins C.A., Olsen I., Zammit P.S., Heslop L., Petrie A., Partridge T.A., Morgan J.E. Stem cell function, self-renewal, and behavioral heterogeneity of cells from the adult muscle satellite cell niche. Cell. 2005;122:289–301. doi: 10.1016/j.cell.2005.05.010. - DOI - PubMed
    1. Olguin H.C., Olwin B.B. Pax-7 up-regulation inhibits myogenesis and cell cycle progression in satellite cells: A potential mechanism for self-renewal. Dev. Biol. 2004;275:375–388. doi: 10.1016/j.ydbio.2004.08.015. - DOI - PMC - PubMed
    1. Ikemoto M., Fukada S., Uezumi A., Masuda S., Miyoshi H., Yamamoto H., Wada M.R., Masubuchi N., Miyagoe-Suzuki Y., Takeda S. Autologous transplantation of SM/C-2.6(+) satellite cells transduced with micro-dystrophin CS1 cDNA by lentiviral vector into mdx mice. Mol. Ther. 2007;15:2178–2185. doi: 10.1038/sj.mt.6300295. - DOI - PubMed

Publication types

LinkOut - more resources