. 2023 Dec 29;13(1):77.
doi: 10.3390/cells13010077.

Modulation of Suppressive Activity and Proliferation of Human Regulatory T Cells by Splice-Switching Oligonucleotides Targeting FoxP3 Pre-mRNA

Affiliations

Modulation of Suppressive Activity and Proliferation of Human Regulatory T Cells by Splice-Switching Oligonucleotides Targeting FoxP3 Pre-mRNA

Varvara G Blinova et al. Cells. .

Abstract

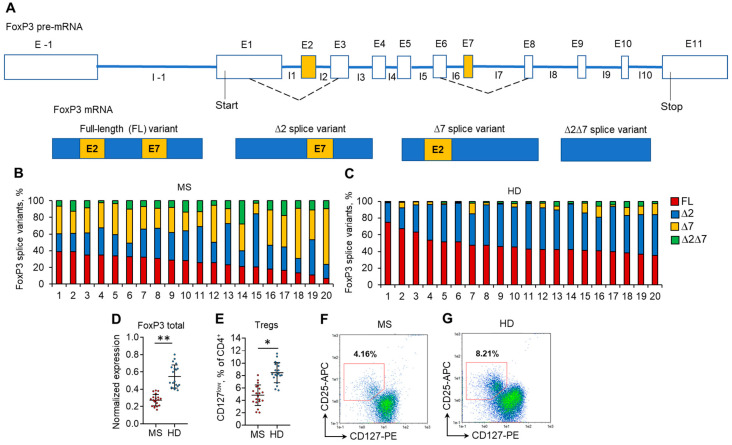
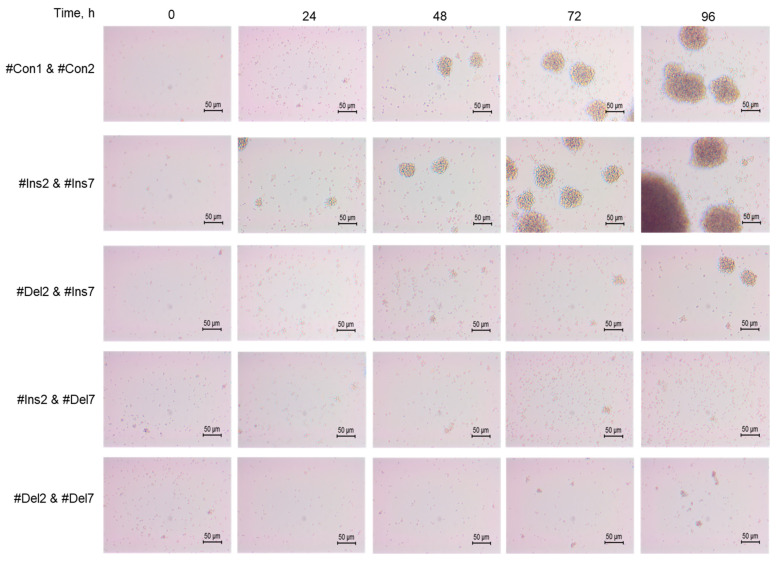
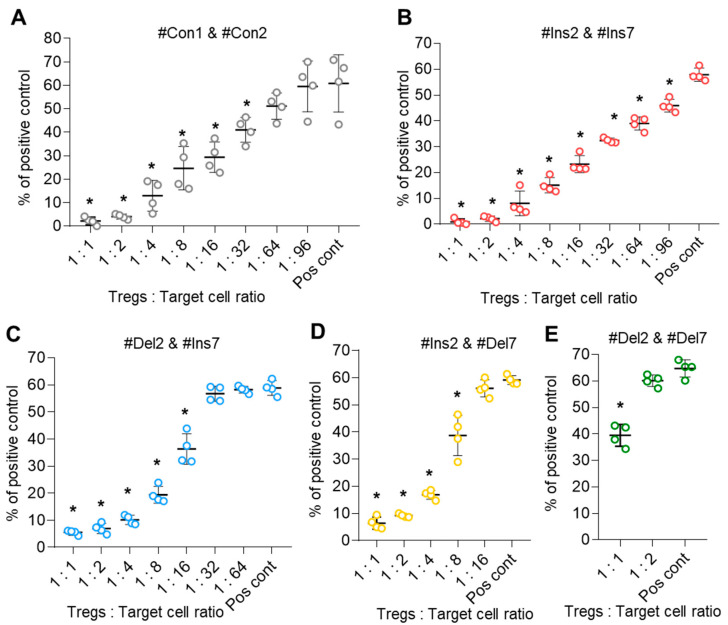
The maturation, development, and function of regulatory T cells (Tregs) are under the control of the crucial transcription factor Forkhead Box Protein 3 (FoxP3). Through alternative splicing, the human FoxP3 gene produces four different splice variants: a full-length variant (FL) and truncated variants with deletions of each of exons 2 (∆2 variant) or 7 (∆7 variant) or a deletion of both exons (∆2∆7 variant). Their involvement in the biology of Tregs as well as their association with autoimmune diseases remains to be clarified. The aim of this work was to induce a single FoxP3 splice variant in human Tregs by splice switching oligonucleotides and to monitor their phenotype and proliferative and suppressive activity. We demonstrated that Tregs from peripheral blood from patients with multiple sclerosis preferentially expressed truncated splice variants, while the FL variant was the major variant in healthy donors. Tregs with induced expression of truncated FoxP3 splice variants demonstrated lower suppressive activity than those expressing FL variants. Reduced suppression was associated with the decreased expression of Treg-associated suppressive surface molecules and the production of cytokines. The deletion of exons 2 and/or 7 also reduced the cell proliferation rate. The results of this study show an association between FoxP3 splice variants and Treg function and proliferation. The modulation of Treg suppressive activity by the induction of the FoxP3 FL variant can become a promising strategy for regenerative immunotherapy.

Keywords: FoxP3; alternative splicing; multiple sclerosis; regulatory T cells; splicing-switching oligonucleotides; suppressive activity.


Conflict of interest statement

All authors declare that no conflict of interest exist.

Figures

Figure 1
Figure 1
Changes in the expression of FoxP3 splice variants are associated with a reduced proportion of Tregs in the peripheral blood of MS patients. (A) Schematic presentation of FoxP3 pre-mRNA AS resulting in the formation of four types of mature splice variant mRNAs: the full-length (FL) variant includes both exon 2 and exon 7; the ∆2 splice variant lacks exon 2 and includes exon 7; the ∆7 splice variant lacks exon 7 and includes exon 2; and the ∆2∆7 lacks both exon 2 and exon 7. Proportions of FoxP3 mRNA splice variants in Tregs isolated from the peripheral blood of (B) 20 MS patients and (C) 20 healthy donors (HD). The levels of investigated mRNAs were normalized to the mean expression of three reference genes: 18S, GAPH, and beta-actin. (D) The level of total FoxP3 mRNA demonstrates its reduced expression in Tregs from MS patients in comparison to HDs. (E) Reduced proportion of CD4+CD25+CD127low Tregs in peripheral blood of MS determined by flow cytometry. Black horizontal lines indicate the median. n = 20 for both the MS and HD groups. * p ≤ 0.05; ** p ≤ 0.01 by the Mann–Whitney U test. Representative flow cytometry diagrams demonstrate a reduced proportion of Tregs in (F) MS patients in comparison to (G) HDs.
Figure 2
Figure 2
Ex vivo expansion has no effect on the level of FoxP3 mRNA splice variants. Expanded Tregs from MS patients demonstrated reduced proliferative and suppressive activities. Tregs isolated from the peripheral blood of MS patients and HDs were multiplied ex vivo for 15 days as described in the Materials and Methods. Representative flow cytometry diagrams demonstrate the homogeneity of expanded Tregs obtained from (A,C) MS patients and (B,D) HDs by the expression of CD127low or FoxP3 in CD25+-positive cells. (E) Number of cells during 15 days of ex vivo expansion demonstrating reduced proliferative activity of cells from MS patients Real-time RT-PCR results demonstrate no changes in the proportion of FoxP3 slice variant mRNA levels in (F) initial Tregs and (G) expanded Tregs. (H) The level of total FoxP3 mRNA demonstrates its reduced expression in expanded Tregs of MS patients in comparison to that of HDs. The levels of investigated mRNAs were normalized to the mean expression of three reference genes: 18S, GAPDH, and beta-actin. The results of the mixed lymphocyte reaction test (MLR) demonstrate the reduced suppressive activity of expanded Tregs in (I) MS patients in comparison to (J) HDs. The results are shown as the percentage of proliferated cells measured by the reduction in the CFSE signal using flow cytometry. Representative flow cytometry proliferation diagrams for the MLR test are shown in Figure S5 in the Supplementary File. Pos. cont.—positive control, CD4+CD25 cells cocultured with accessory cells. n = 4 for both the MS and HD groups. * p ≤ 0.05 by Mann–Whitney U test.
Figure 3
Figure 3
Modulation of FoxP3 pre-mRNA splicing with SSO targeting only exon 2 cis-elements does not allow us to obtain Tregs expressing a single splice variant. (A) Two splicing regulator proteins, SRp40 (shown as green ellipses), interact with their binding sites (shown in bold green font) within exon 2 and are responsible for the inhibition of exon 2 insertion in mature FoxP3 mRNA. The splicing regulator proteins SF2/ASF (shown as a red ellipse) interact with its binding site (shown in bold red font) within intron 2 and are responsible for the inhibition of exon 2 deletion from mature mRNA. (B) Treg transfection with #Ins2, a 36-mer-specific antisense SSO (presented in green italics font), blocks SRp40 from binding to its sensitive cis-elements and induces the insertion of exon 2 into the mature mRNA. (C) Treg transfection with #Del2, a 36-mer-specific antisense SSO (presented in red italics font), blocks SF2/ASF from binding to its sensitive cis-elements and induces the deletion of exon 2 from the mature mRNA. FoxP3 splice variant mRNA levels in cells 96 h after transfection with (D) #Ins2 or (E) #Del2 SSOs. The levels of investigated mRNAs were normalized to the mean expression of three reference genes: 18S, GAPDH, and beta-actin. N = 4. The results are shown as the mean ± SD. FL, full-length splice variant; ∆2, splice variant with deleted exon 2; ∆7, splice variant with deleted exon 7; ∆2∆7, splice variant with deleted both exon 2 and exon 7. ND, not detected.
Figure 4
Figure 4
Modulation of FoxP3 pre-mRNA splicing with SSO targeting only exon 7 cis-elements does not allow us to obtain Tregs expressing a single splice variant. (A) Two splicing regulator proteins, SC35 and SRp75 (shown as green ellipses), interact with their binding sites (shown in bold green font) within exon 7 and are responsible for the inhibition of exon 7 insertion in mature FoxP3 mRNA. The splicing regulator proteins SF2/ASF (shown as a red ellipse) interact with its binding site (shown in bold red font) within intron 7 and are responsible for the inhibition of exon 7 deletion from mature mRNA. (B) Treg transfection with #Ins7, a 36-mer-specific antisense SSO (presented in green italics font), blocks both SC35 and SRp75 from binding to their sensitive cis-elements and induces the insertion of exon 7 into the mature mRNA. (C) Treg transfection with #Del7, a 36-mer-specific antisense SSO (presented in red italics font), blocks SF2/ASF from binding to its sensitive cis-elements and induces the deletion of exon 7 from the mature mRNA. FoxP3 splice variant mRNA levels in cells 96 h after transfection with (D) #Ins7 or (E) #Del7 SSOs. The levels of investigated mRNAs were normalized to the mean expression of three reference genes: 18S, GAPDH, and beta-actin. N = 4. The results are shown as the mean ± SD. FL, full-length splice variant; ∆2, splice variant with deleted exon 2; ∆7, splice variant with deleted exon 7; ∆2∆7, splice variant with deleted both exon 2 and exon 7. ND, not detected.
Figure 5
Figure 5
Modulation of FoxP3 pre-mRNA splicing with SSOs targeting both exon 2 and exon 7 cis-elements allowed us to obtain Tregs expressing a single splice variant. FoxP3 splice variant mRNA levels in Treg cells 96 h after transfection with (A) control nonspecific 36-mer nucleotides #Con1 & #Con2; (B) SSOs #Ins2 & #Ins7, which could induce the expression of the FL variant only; (C) SSOs #Del2 & #Ins7, which could induce the expression of the ∆2 splice variant only; (D) SSOs #Ins2 & #Del7, which could induce the expression of the ∆7 splice variant only; and (E) SSOs #Del2 & #Del7, which could induce the expression of the ∆2∆7 splice variant only. N = 4. The results are shown as the mean ± SD. * p ≤ 0.001 by Mann–Whitney U test. FL, full-length splice variant; ∆2, splice variant with deleted exon 2; ∆7, splice variant with deleted exon 7; ∆2∆7, splice variant with deleted both exon 2 and exon 7. ND, not detected. (F) Western blotting results demonstrate the induction of the ∆2 splice variant. Clone 150D is exon 2 specific, while clone 259D recognizes an epitope after exon 2 common for all FoxP3 splice variants.
Figure 6
Figure 6
Tregs expressing only one FoxP3 splice variant demonstrated different proliferative activities. Tregs were transfected with each SSO, inducing the expression of only one of the FoxP3 splice variants, and expanded for 96 h. (A) Proliferative activity (number of cells) during 4 days of cultivation after transfection, demonstrating increased proliferative activity for cells expressing the FL variant and decreased proliferative activity in cells with exon deletions in splice variants. (B) Percentage of proliferating cells within four days of proliferation after transfection. n = 4. * p ≤ 0.05 vs. cells transfected with #Con1 & #Con2 oligonucleotides by the Mann–Whitney U test.
Figure 7
Figure 7
Development dynamics of Tregs transfected with oligonucleotides within 96 h of cultivation (see description in text). Microphotographs of proliferating cells at 200× magnification.
Figure 8
Figure 8
Immunophenotype of Tregs expressing only one FoxP3 splice variant. The expression of Treg-associated cell markers was determined by flow cytometry in Tregs four days after transfection with each of the SSOs. Cell membrane markers were (A) CD4High, (B) CD25High, (C) CD127Low, and (D) CD152High. Cell membrane markers associated with Treg suppressive activity were (E) CD39High and (F) CD223High. Nuclear markers associated with Treg stability: (G) FoxP3High and (H) HeliosHigh. n = 4. Black horizontal lines indicate the mean ± SEM. * p ≤ 0.05; ** p ≤ 0.01; *** p ≤ 0.005 vs. cells transfected with #Con1 & #Con2 oligonucleotides by the Mann–Whitney U test.
Figure 9
Figure 9
Tregs expressing only one FoxP3 splice variant demonstrated different suppressive activities. Tregs were transfected with each SSO, inducing the expression of only one FoxP3, and subjected to an MLR test at 96 h of proliferation. (AE) The results of the MLR test demonstrate increased suppressive activity in cells expressing the FL variant and decreased suppressive activity in cells with exon deletions in splice variants. The results are shown as the percentage of proliferated cells measured by the reduction in the CFSE signal using flow cytometry. Representative flow cytometry diagrams for the MLR test are shown in Figure S14 in the Supplementary File. Pos. cont.—positive control; CD4+CD25 cells cocultured with accessory cells. n = 4 for both the MS and HD groups. * p ≤ 0.05 by the Student’s t test.
Figure 10
Figure 10
The ability of Tregs to produce apoptosis-inducing molecules (A) granzyme A, (B) granzyme B, and (C) perforin. Transfected Tregs were incubated with stimulators and protein transport inhibitors or only with protein transport inhibitors as a control. Cells were labeled with CD4, CD25, and CD127 antibodies, fixed, permeabilized, and incubated with antibodies against granzyme A, B, or perforin. Levels of marker-positive cells were measured by flow cytometry. n = 4. Black horizontal lines indicate the mean ± SD. * p ≤ 0.05; ** p ≤ 0.01; *** p ≤ 0.005 vs. cells transfected with #Con1 & #Con2 oligonucleotides by the Mann–Whitney U test. Representative flow cytometry diagrams for granzymes A and B and perforin are shown in Figure S15 in the Supplementary File.
Figure 11
Figure 11
Levels of mRNA of molecules associated with Treg suppressive activity. Total mRNA was isolated from Tregs transfected with oligonucleotides and analyzed by real-time RT-PCR. The mRNA levels of (A) CTLA4, (B) LGALS9, and (C) NRP1 were normalized to the mean expression of three reference genes: 18S, GAPDH, and ACTB. n = 4. * p ≤ 0.05; ** p ≤ 0.01; *** p ≤ 0.005 vs. cells transfected with #Con1 & #Con2 oligonucleotides by the Mann–Whitney U test.
Figure 12
Figure 12
Tregs expressing only one FoxP3 splice variant demonstrated different abilities to suppress telomerase. (A) Telomerase activity determined by TRAP assay. (B) Results of TRAP quantification by densitometry. * p ≤ 0.05; ** p ≤ 0.01 vs. cells transfected with #Con1 & #Con2 oligonucleotides by the Mann–Whitney U test.
Figure 13
Figure 13
Treg-associated cytokine concentrations in cell culture from Tregs expressing a single FoxP3 splice variant. Concentrations of (A) IL-10, (B) IL-12 (p40), (C) IL-12 (p70), (D) IL-19, (E) IL-20, (F) IL-22, (G) IL-26, (H) IL-27 (p28), (I) IL-28A/IFN-λ2, (J) IL-29/IFN-λ1, and (K) IL-35 were determined by Bio-Plex assay. n = 4. Black horizontal lines indicate the mean ± SD. * p ≤ 0.05; ** p ≤ 0.01; *** p ≤ 0.005 vs. cells transfected with #Con1 & #Con2 oligonucleotides by the Mann–Whitney U test.

Similar articles

Cited by

References

    1. Sakaguchi S., Sakaguchi N., Asano M., Itoh M., Toda M. Immunologic self-tolerance maintained by activated T cells expressing IL-2 receptor alpha-chains (CD25). Breakdown of a single mechanism of self-tolerance causes various autoimmune diseases. J. Immunol. 1995;155:1151–1164. doi: 10.4049/jimmunol.155.3.1151. - DOI - PubMed
    1. Baecher-Allan C., Hafler D.A. Human regulatory T cells and their role in autoimmune disease. Immunol. Rev. 2006;212:203–216. doi: 10.1111/j.0105-2896.2006.00417.x. - DOI - PubMed
    1. Lifshitz G.V., Zhdanov D.D., Lokhonina A.V., Eliseeva D.D., Lyssuck E.Y., Zavalishin I.A., Bykovskaia S.N. Ex vivo expanded regulatory T cells CD4 + CD25 + FoxP3 + CD127 Low develop strong immunosuppressive activity in patients with remitting-relapsing multiple sclerosis. Autoimmunity. 2016;49:388–396. doi: 10.1080/08916934.2016.1199020. - DOI - PubMed
    1. Christodoulou M.I., Kapsogeorgou E.K., Moutsopoulos N.M., Moutsopoulos H.M. Foxp3+ T-regulatory cells in Sjogren’s syndrome: Correlation with the grade of the autoimmune lesion and certain adverse prognostic factors. Am. J. Pathol. 2008;173:1389–1396. doi: 10.2353/ajpath.2008.080246. - DOI - PMC - PubMed
    1. Nussbaum L., Chen Y.L., Ogg G.S. Role of regulatory T cells in psoriasis pathogenesis and treatment. Br. J. Dermatol. 2021;184:14–24. doi: 10.1111/bjd.19380. - DOI - PubMed

Publication types

LinkOut - more resources