

Editorial
doi: 10.3390/diagnostics14010047.
The Latest Updates in Swept-Source Optical Coherence Tomography Angiography
Affiliations
- PMID: 38201356
- PMCID: PMC10795713
- DOI: 10.3390/diagnostics14010047
Item in Clipboard
Editorial
The Latest Updates in Swept-Source Optical Coherence Tomography Angiography
Diagnostics (Basel).
.
Abstract
Optical coherence tomography (OCT) is a revolutionary imaging technology in the field of ophthalmic medical imaging [...].
Conflict of interest statement
The authors declare no conflicts of interest.
Figures
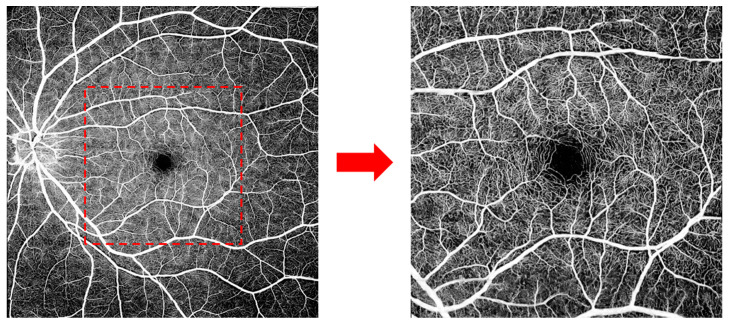
A healthy eye examined via high-resolution, widefield swept-source (SS) optical coherence tomography angiography (OCTA), with a range of 12 × 12 mm. The central area displays copasetic detail of macular capillaries.
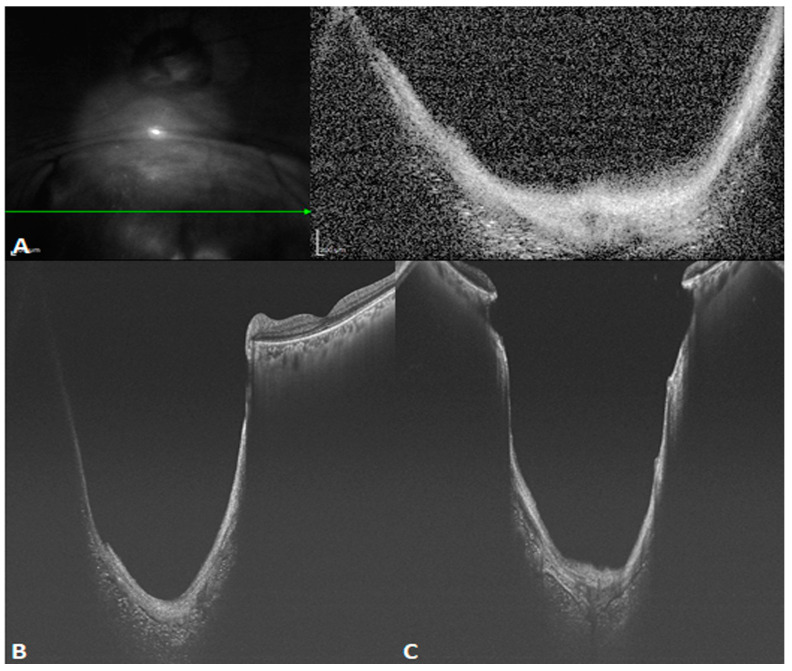
B-scan images of a patient with refractive medium turbidity and a huge choroidal coloboma. (A) Spectral-domain OCT (SD-OCT) image showing a part of the coloboma, but the structure is blurry (The green arrow in the left image indicated the orientation of B scan OCT in the right image). (B) An oblique SS-OCT scan of the same choroidal coloboma and the macular area. Even the posterior scleral space can be visualized. (C) A B-scan SS-OCT image with a range of 20 × 20 mm showing the full extent of the choroidal coloboma.

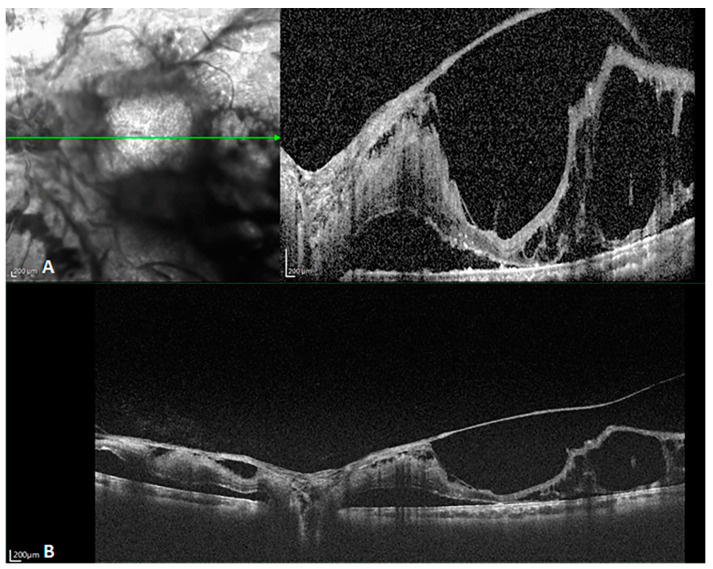
B-scan images of a patient with slightly refractive medium turbidity and a macular hole. (A,C) SD-OCT images revealing a macular hole and a part of the detached retina; the choroid is not visible because the retina detachment is too high. (B,D) SS-OCT images with a depth of 6 mm and width of 24 mm, clearly visualizing the retinal detachment, as well as the choroid and part of the sclera.
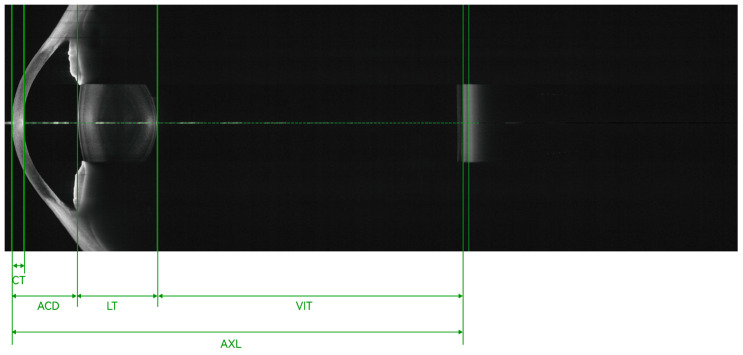
Full-eye, super-depth SS-OCT, achieving an imaging depth up to 40 mm and a 16 mm field of view. CT, cornea thickness; ACD, anterior chamber depth; LT, lens thickness; AXL, axial length; VIT, vitreous.
B-scan images of a patient with proliferative diabetic retinopathy. (A) SD-OCT showing retinal detachment, with the large proliferative membranes, causing a folding artifact. The choroidal layer is incompletely captured. SD-OCT was unable to capture the whole proliferating membrane and the choroidal tissue below because the retinal bulge was too high (The green arrow in the left image indicated the orientation of B scan OCT in the right image). (B) SS-OCT displays an almost identical position. It reveals details of the retina and choroid, even including the choroidal–scleral boundary and part of the sclera. The pre-retinal proliferating membrane extending into the vitreous cavity and the retinal detachment on the nasal side of the optic disk are also clearly visible.
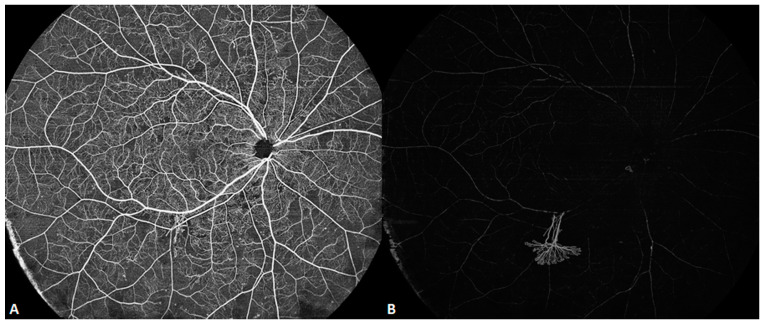
Ultra-wide (24 × 20 mm) SS-OCTA image of a patient with diabetic retinopathy revealing retinal neovascularization at the infratemporal vascular arch, growing into the vitreous. (A) Superficial retinal angiographic image. (B) Vitreous angiographic image.
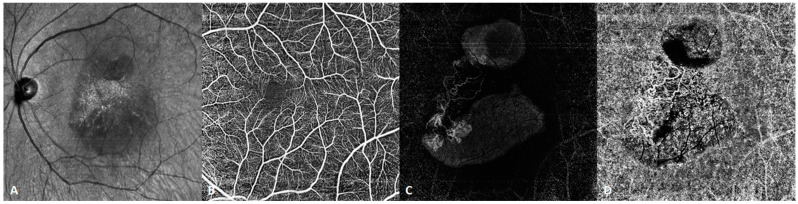
SS-OCTA image of a patient with polypoidal choroidal vasculopathy. (A) Infrared fundus image. (B) Normal retinal superficial vascular network. (C) SS-OCTA demonstrating choroidal neovascularization and a polypoidal lesion under the elevated pigment epithelial detachment (PED) in the avascular layer of the retina. (D) The choriocapillaris exhibits a branching neovascular network. SS-OCT clearly reveals the vascular structure within the PED, which was barely revealed using SD-OCT.
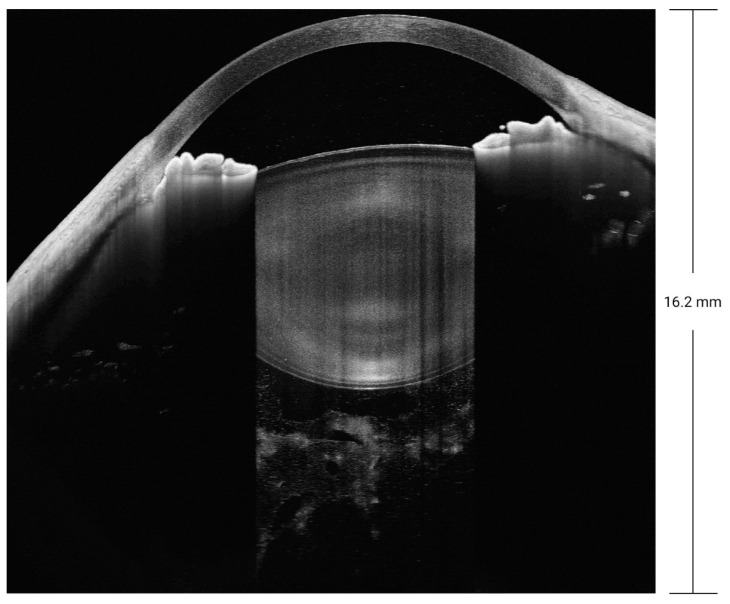
SS-OCT with a depth of 16.2 mm for the anterior segment.
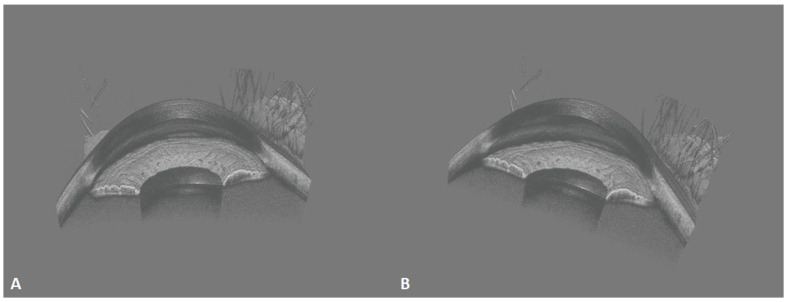
These 400-kHz SS-OCT images demonstrate the normal three-dimensional (3D) anterior segment morphology. (A) Frontal view of sagittal plane; (B) oblique view of sagittal plane. Iris folds, the anterior chamber angle, and the corneoscleral limbus are clearly visible.
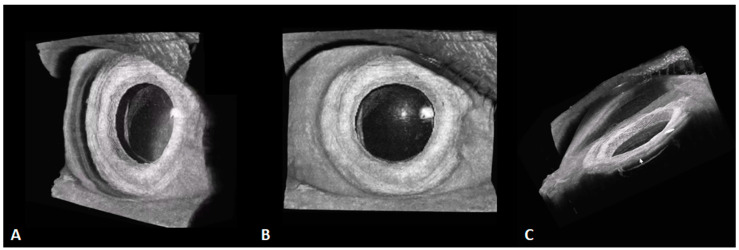
These 3D, 400-kHz SS-OCT images demonstrate an eye with an intraocular lens (IOL) with a small pterygium on the nasal side. (A) The structural relationship between the IOL and the iris is clear. (B) The frontal view. (C) The side view, in which the entire side of the iris is clearly visible (white arrow), as well as the lower interface of the IOL.
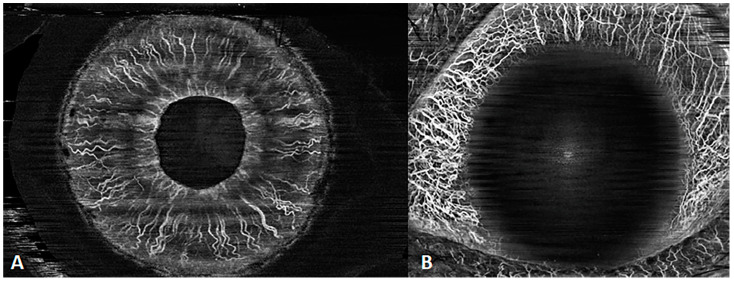
SS-OCTA of the anterior segment. (A) Iris angiography; (B) conjunctival angiography.
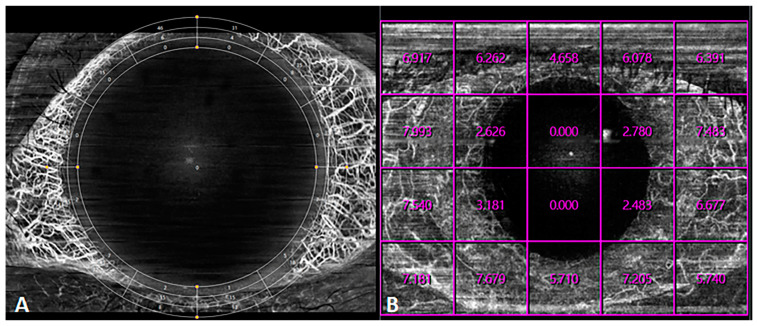
Quantification of anterior-segment OCTA blood flow. (A) EDTRS grid mode for the determination of the vascular density. (B) Grid mode for the determination of the vascular density. In each lattice, the vascular density is displayed in the corresponding region.
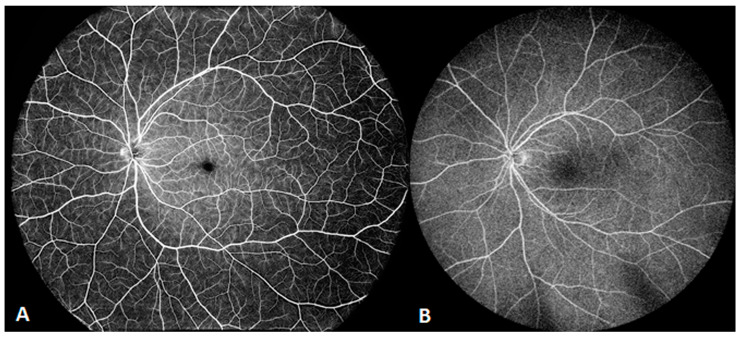
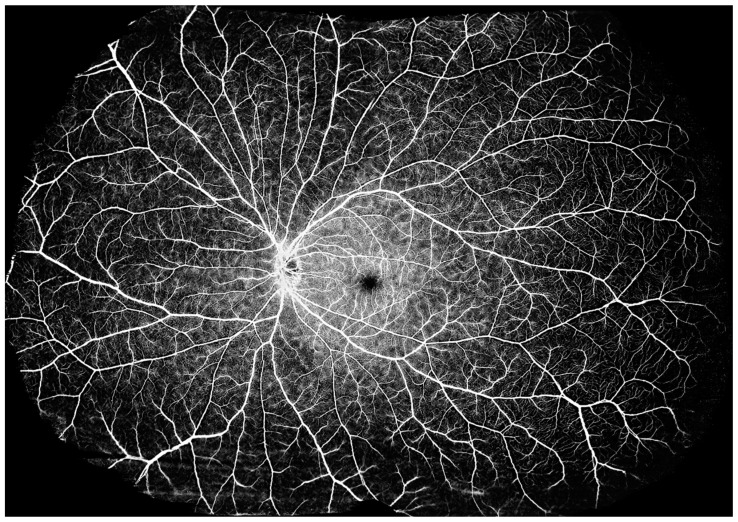
Ultra-wide images of two healthy eyes. (A) An ultra-widefield OCTA image of 29 × 24 mm (inner angle = 150°) for a healthy retina with a single scan. (B) An ultra-widefield fluorescence angiographic image with an inner angle of 102°.
An image of the retina layer as a montage of five ultra-wide angle OCTA images, extending the range to 220° (inner angle). The whole image goes beyond the entire posterior hemisphere, uncovering lesions toward the edge of the retina.
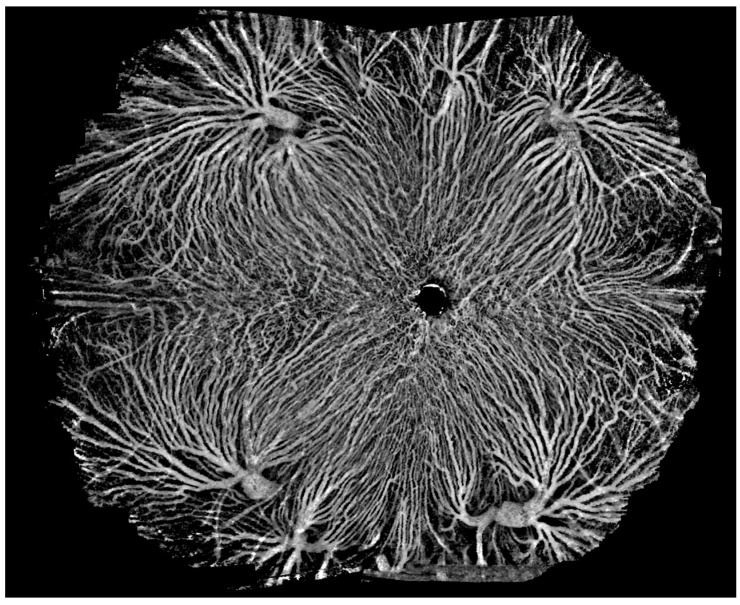
An OCTA image of the choroidal layer as a montage of five ultra-wide angle OCTA images, extending the range to 220° (inner angle). The vortex vein ampullae in all four quadrants are clearly visible.
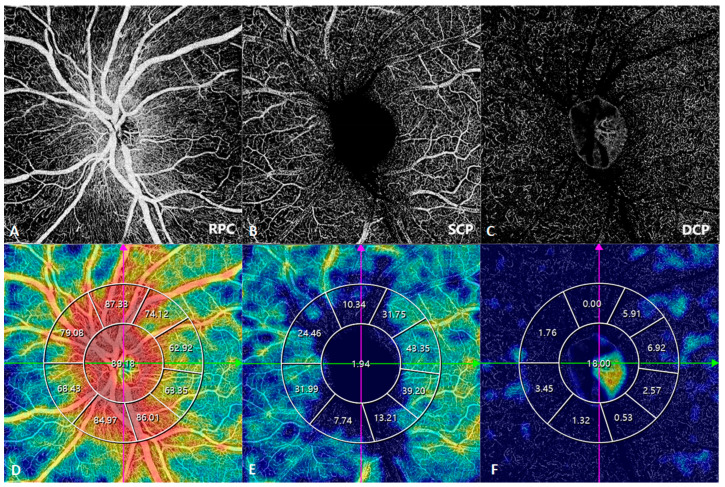
SS-OCTA images of the optic nerve head and corresponding vascular density. (A,D) Radial peripapillary capillary (RPC). (B,E) Superficial capillary plexus (SCP). (C,F) Deep capillary plexus (DCP). Pink and green arrows indicated the orientation of B scan OCT.
References
-
- Trifanov I., Caldas P., Neagu L., Romero R., Berendt M.O., Salcedo J.A.R., Podoleanu A.G., Lobo Ribeiro A.B. Combined neodymium–ytterbium-doped ase fiber-optic source for optical coherence tomography applications. IEEE Photonics Technol. Lett. 2011;23:21–23. doi: 10.1109/LPT.2010.2090039. - DOI
-
- Laíns I., Wang J.C., Cui Y., Katz R., Vingopoulos F., Staurenghi G., Vavvas D.G., Miller J.W., Miller J.B. Retinal applications of swept source optical coherence tomography (OCT) and optical coherence tomography angiography (OCTA) Prog. Retin. Eye Res. 2021;84:100951. doi: 10.1016/j.preteyeres.2021.100951. - DOI - PubMed
Publication types
LinkOut - more resources
Full Text Sources
