. 2024 Jan 3;14(1):107.
doi: 10.3390/diagnostics14010107.

Establishing Normative Values for Acromion Anatomy: A Comprehensive MRI-Based Study in a Healthy Population of 996 Participants

Affiliations

Establishing Normative Values for Acromion Anatomy: A Comprehensive MRI-Based Study in a Healthy Population of 996 Participants

Anne Prietzel et al. Diagnostics (Basel). .

Abstract

Shoulder pain is a common issue often linked to conditions such as subacromial impingement or rotator cuff lesions. The role of the acromion in these symptoms remains a subject of debate. This study aims to establish standardized values for commonly used acromion dimensions based on whole-body MRI scans of a large and healthy population and to investigate potential correlations between acromion shape and influencing factors such as sex, age, BMI, dominant hand, and shoulder pain. The study used whole-body MRI scans from the Study of Health in Pomerania, a German population-based study. Acromion index, acromion tilt, and acromion slope were measured. Interrater variability was tested with two independent, trained viewers on 100 MRI sequences before actual measurements started. Descriptive statistics and logistic regression were used to evaluate the results. We could define reference values based on a shoulder-healthy population for each acromion parameter within the 2.5 to 97.5 percentile. No significant differences were found in acromion slope, tilt, and index between male and female participants. No significant correlations were observed between acromion morphology and anthropometric parameters such as height, weight, or BMI. No significant differences were observed in acromion parameters between dominant and non-dominant hands or stated pain intensity. This study provides valuable reference values for acromion-related parameters, offering insight into the anatomy of a healthy shoulder. The findings indicate no significant differences in acromion morphology based on sex, weight, BMI, or dominant hand. Further research is necessary to ascertain the clinical implications of these reference values. The establishment of standardized reference values opens new possibilities for enhancing clinical decision making regarding surgical interventions, such as acromioplasty.

Keywords: MRI diagnostics; acromion anatomy; acromioplasty; reference values; rotator cuff lesions; shoulder pain; subacromial impingement.


Conflict of interest statement

The authors declare no conflicts of interest. The funders had no role in the design of the study; in the collection, analyses, or interpretation of data; in the writing of the manuscript, or in the decision to publish the results.

Figures

Figure 1
Figure 1
Schematic 3D reconstruction of the glenohumeral joint in anterior–posterior view, illustrating the measurement technique for the acromion index AI = GA/GH. GA indicates the distance between glenoid surface and lateral edge of the acromion, GH the distance between glenoid surface and lateral edge of the humeral head.
Figure 6
Figure 6
Schematic 3D reconstruction of the glenohumeral joint in anterior–posterior view, illustrating the measurement technique for the acromion tilt (α). A1 indicates the ventral end of the acromion’s bottom, A2 the dorsal end of the acromion’s bottom, B1 the lower end of the coracoid process.
Figure 10
Figure 10
Schematic 3D reconstruction of the glenohumeral joint in anterior–posterior view, illustrating the measurement technique for the acromion slope (α). A1 indicates the ventral end of the acromion’s bottom, A2 the dorsal end of the acromion’s bottom, M the middle of the acromion’s bottom.
Figure 2
Figure 2
How to measure acromion index: Axial MRI of the thorax depicting the shoulder joint in T1 weighting (3D-GRE VIBE sequence), with a slice thickness of 3 mm. Point G1 indicates the lower end of the glenoid.
Figure 3
Figure 3
How to measure acromion index: Axial MRI of the thorax depicting the shoulder joint in T1 weighting (3D-GRE VIBE sequence), with a slice thickness of 3 mm. Point G2 indicates the upper end of the glenoid.
Figure 4
Figure 4
How to measure acromion index: Axial MRI of the thorax depicting the shoulder joint in T1 weighting (3D-GRE VIBE sequence), with a slice thickness of 3 mm. Point H indicates the lateral edge of the humeral head.
Figure 5
Figure 5
How to measure acromion index: Axial MRI of the thorax depicting the shoulder joint in T1 weighting (3D-GRE VIBE sequence), with a slice thickness of 3 mm. Point A indicates the lateral edge of the acromion.
Figure 7
Figure 7
How to measure acromion tilt: Axial MRI of the thorax depicting the shoulder joint in T1 weighting (3D-GRE VIBE sequence), with a slice thickness of 3 mm. Point A1 indicates the ventral end of the acromion’s bottom.
Figure 8
Figure 8
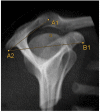
How to measure acromion tilt: Axial MRI of the thorax depicting the shoulder joint in T1 weighting (3D-GRE VIBE sequence), with a slice thickness of 3 mm. Point A2 indicates the dorsal end of the acromion’s bottom.
Figure 9
Figure 9
How to measure acromion tilt: Axial MRI of the thorax depicting the shoulder joint in T1 weighting (3D-GRE VIBE sequence), with a slice thickness of 3 mm. Point B1 indicates the lower end of the coracoid process.
Figure 11
Figure 11
How to measure acromion slope: Axial MRI of the thorax depicting the shoulder joint in T1 weighting (3D-GRE VIBE sequence), with a slice thickness of 3 mm. Point M indicates the middle of the acromion’s bottom.
Figure 12
Figure 12
(ac). Bland–Altman plots for interrater variability: (a) Acromion slope (AS, n = 60), (b) Acromion tilt (AT, n = 85), (c) Acromion index (n = 60).
Figure 12
Figure 12
(ac). Bland–Altman plots for interrater variability: (a) Acromion slope (AS, n = 60), (b) Acromion tilt (AT, n = 85), (c) Acromion index (n = 60).
Figure 13
Figure 13
Amount and Composition of Measured MRIs.

Similar articles

Cited by

References

    1. Urwin M., Symmons D., Allison T., Bramah T. Estimating the Burden of Musculoskeletal Disorders in the Community: The Comparative Prevalence of Symptoms at Different Anatomical Sites, and the Relation to Social Deprivation. Ann. Rheum. Dis. 1998;57:649–655. doi: 10.1136/ard.57.11.649. - DOI - PMC - PubMed
    1. Garving C., Jakob S., Bauer I., Nadjar R., Brunner U.H. Impingement Syndrome of the Shoulder. Dtsch. Arztebl. Int. 2017;114:765–776. doi: 10.3238/arztebl.2017.0765. - DOI - PMC - PubMed
    1. Ostör A.J.K., Richards C.A., Prevost A.T., Speed C.A., Hazleman B.L. Diagnosis and Relation to General Health of Shoulder Disorders Presenting to Primary Care. Rheumatology. 2005;44:800–805. doi: 10.1093/rheumatology/keh598. - DOI - PubMed
    1. Bigliani L.U., Levine W.N. Subacromial Impingement Syndrome. J. Bone Jt. Surg. Am. 1997;79:1854–1868. doi: 10.2106/00004623-199712000-00012. - DOI - PubMed
    1. Tangtrakulwanich B., Kapkird A. Analyses of Possible Risk Factors for Subacromial Impingement Syndrome. World J. Orthop. 2012;3:5–9. doi: 10.5312/wjo.v3.i1.5. - DOI - PMC - PubMed

LinkOut - more resources