Temporal Trend of the SARS-CoV-2 Omicron Variant and RSV in the Nasal Cavity and Accuracy of the Newly Developed Antigen-Detecting Rapid Diagnostic Test
- PMID: 38201428
- PMCID: PMC10802845
- DOI: 10.3390/diagnostics14010119
Temporal Trend of the SARS-CoV-2 Omicron Variant and RSV in the Nasal Cavity and Accuracy of the Newly Developed Antigen-Detecting Rapid Diagnostic Test
Abstract
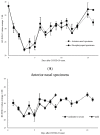
The aim of this work is to analyze the viral titers of severe acute respiratory syndrome coronavirus 2 (SARS-CoV-2) and respiratory syncytial virus (RSV) at the anterior nasal site (ANS) and nasopharyngeal site (NS), evaluate their virological dynamics, and validate the usefulness of a newly developed two-antigen-detecting rapid antigen diagnostic test (Ag-RDT) that simultaneously detects SARS-CoV-2 and RSV using clinical specimens. This study included 195 asymptomatic to severely ill patients. Overall, 668 specimens were collected simultaneously from the ANS and NS. The cycle threshold (Ct) values calculated from real-time polymerase chain reaction were used to analyze temporal changes in viral load and evaluate the sensitivity and specificity of the Ag-RDT. The mean Ct values for SARS-CoV-2-positive, ANS, and NS specimens were 28.8, 28.9, and 28.7, respectively. The mean Ct values for RSV-positive, ANS, and NS specimens were 28.7, 28.8, and 28.6, respectively. SARS-CoV-2 and RSV showed the same trend in viral load, although the viral load of NS was higher than that of ANS. The sensitivity and specificity of the newly developed Ag-RDT were excellent in specimens collected up to 10 days after the onset of SARS-CoV-2 infection and up to 6 days after the onset of RSV infection.
Keywords: RSV; RT-PCR; SARS-CoV-2; omicron; rapid diagnostic test; viral antigens.
Conflict of interest statement
Author Masaki Yoshihiro, Yuta Maehara, Shizuka Ito and Yasushi Ochiai was employed by the company Sekisui Medical Co., Ltd. The authors declare that this study received funding from Sekisui Medical Co., Ltd. The funder was not involved in the study design, collection, analysis, interpretation of data, the writing of this article or the decision to submit it for publication.
Figures


Similar articles
-
Diagnostic accuracy of a novel SARS CoV-2 rapid antigen test and usefulness of specimens collected from the anterior nasal cavity.Int J Infect Dis. 2022 Nov;124:199-205. doi: 10.1016/j.ijid.2022.09.018. Epub 2022 Sep 17. Int J Infect Dis. 2022. PMID: 36122672 Free PMC article.
-
Daily SARS-CoV-2 Nasal Antigen Tests Miss Infected and Presumably Infectious People Due to Viral Load Differences among Specimen Types.Microbiol Spectr. 2023 Aug 17;11(4):e0129523. doi: 10.1128/spectrum.01295-23. Epub 2023 Jun 14. Microbiol Spectr. 2023. PMID: 37314333 Free PMC article.
-
Comparative evaluation of RT-PCR and antigen-based rapid diagnostic tests (Ag-RDTs) for SARS-CoV-2 detection: performance, variant specificity, and clinical implications.Microbiol Spectr. 2024 Jun 4;12(6):e0007324. doi: 10.1128/spectrum.00073-24. Epub 2024 Apr 29. Microbiol Spectr. 2024. PMID: 38683014 Free PMC article.
-
Accuracy of rapid point-of-care antigen-based diagnostics for SARS-CoV-2: An updated systematic review and meta-analysis with meta-regression analyzing influencing factors.PLoS Med. 2022 May 26;19(5):e1004011. doi: 10.1371/journal.pmed.1004011. eCollection 2022 May. PLoS Med. 2022. PMID: 35617375 Free PMC article.
-
Accuracy of novel antigen rapid diagnostics for SARS-CoV-2: A living systematic review and meta-analysis.PLoS Med. 2021 Aug 12;18(8):e1003735. doi: 10.1371/journal.pmed.1003735. eCollection 2021 Aug. PLoS Med. 2021. PMID: 34383750 Free PMC article.
Cited by
-
Surveillance of Respiratory Pathogens Among Rapid Diagnostic Test-Negative Acute Respiratory Infection Patients in Myanmar in 2023, with a Focus on Rhinovirus and Enterovirus Genotyping.Viruses. 2025 Jun 17;17(6):860. doi: 10.3390/v17060860. Viruses. 2025. PMID: 40573450 Free PMC article.
-
Clinical performance of two commercially available rapid antigen tests for influenza, RSV, and SARS-CoV-2 diagnostics.Microbiol Spectr. 2025 Jan 7;13(1):e0163024. doi: 10.1128/spectrum.01630-24. Epub 2024 Nov 26. Microbiol Spectr. 2025. PMID: 39589150 Free PMC article.
References
-
- World Health Organization WHO Coronavirus (COVID-19) Dashboard. [(accessed on 4 February 2023)]. Available online: https://covid19.who.int.
-
- World Health Organization Update on Omicron. [(accessed on 29 May 2023)]. Available online: https://www.who.int/news/item/28-11-2021-update-on-omicron.
-
- Puhach O., Adea K., Hulo N., Sattonnet P., Genecand C., Iten A., Jacquérioz F., Kaiser L., Vetter P., Eckerle I., et al. Infectious Viral Load in Unvaccinated and Vaccinated Individuals Infected with Ancestral, Delta or Omicron SARS-CoV-2. Nat. Med. 2022;28:1491–1500. doi: 10.1038/s41591-022-01816-0. - DOI - PubMed
-
- Tamura T., Ito J., Uriu K., Zahradnik J., Kida I., Anraku Y., Nasser H., Shofa M., Oda Y., Lytras S., et al. Virological characteristics of the SARS-CoV-2 XBB variant derived from recombination of two Omicron subvariants. Nat. Commun. 2023;14:2800. doi: 10.1038/s41467-023-38435-3. - DOI - PMC - PubMed
Grants and funding
LinkOut - more resources
Full Text Sources
Miscellaneous

