. 2023 Dec 19;16(1):9.
doi: 10.3390/cancers16010009.

KLC1-ROS1 Fusion Exerts Oncogenic Properties of Glioma Cells via Specific Activation of JAK-STAT Pathway

Affiliations

KLC1-ROS1 Fusion Exerts Oncogenic Properties of Glioma Cells via Specific Activation of JAK-STAT Pathway

Takashi Fujii et al. Cancers (Basel). .

Abstract

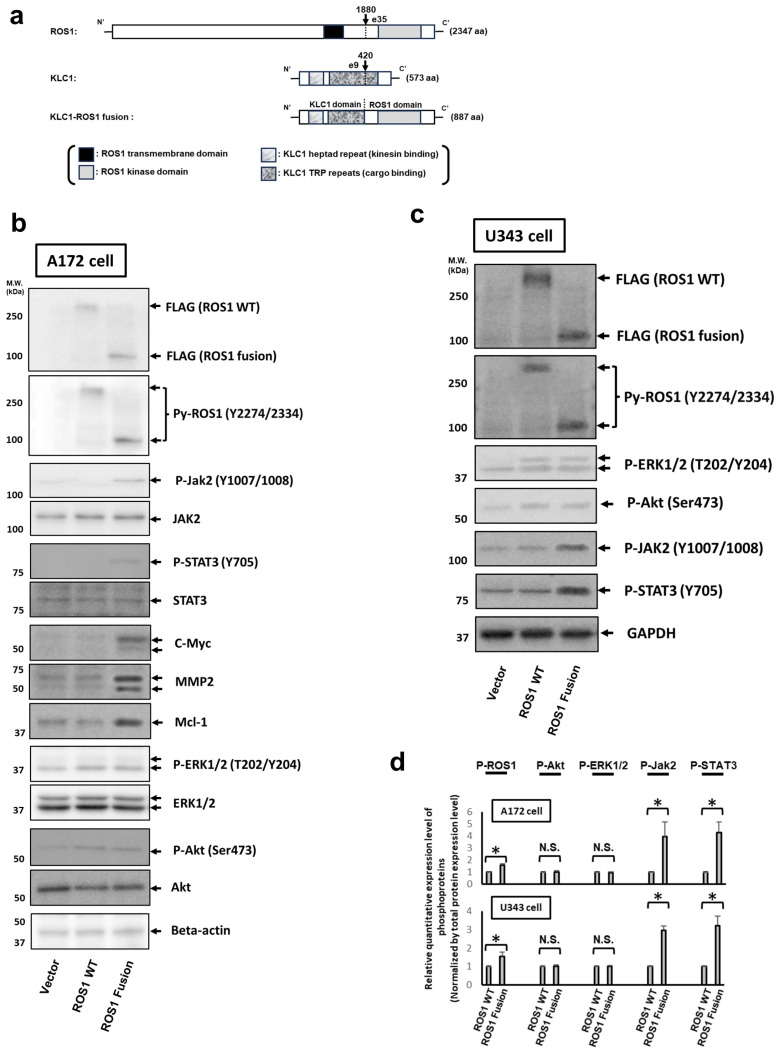
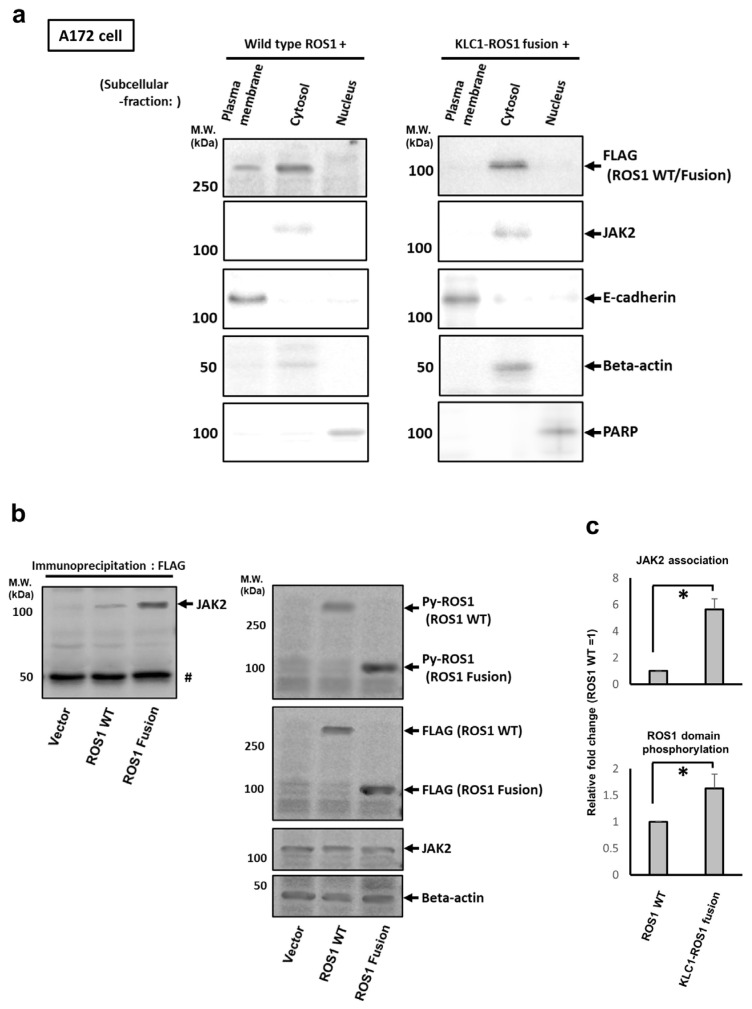
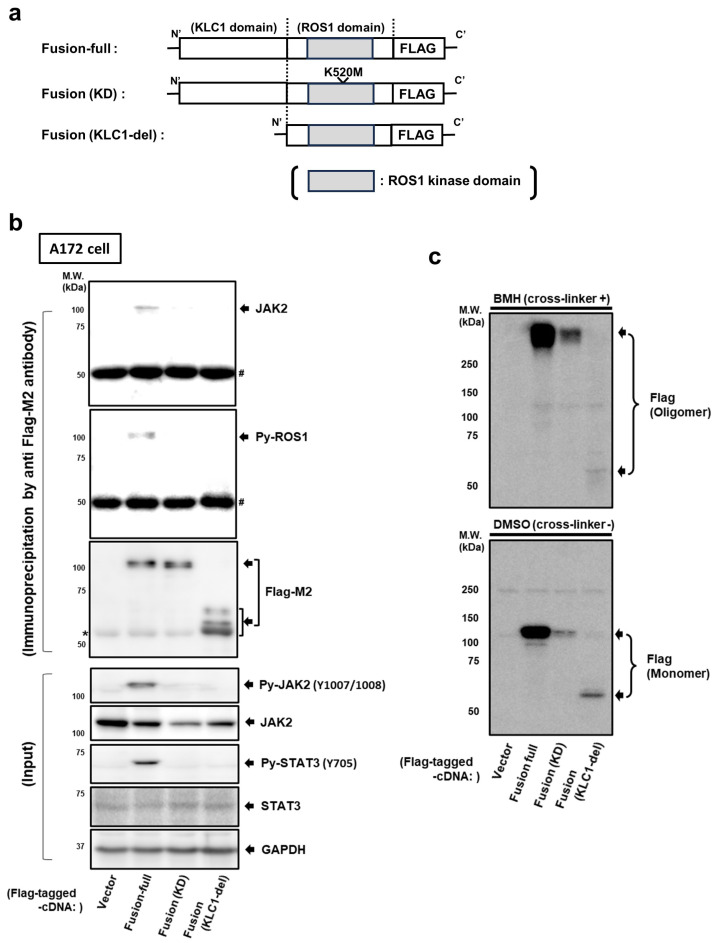
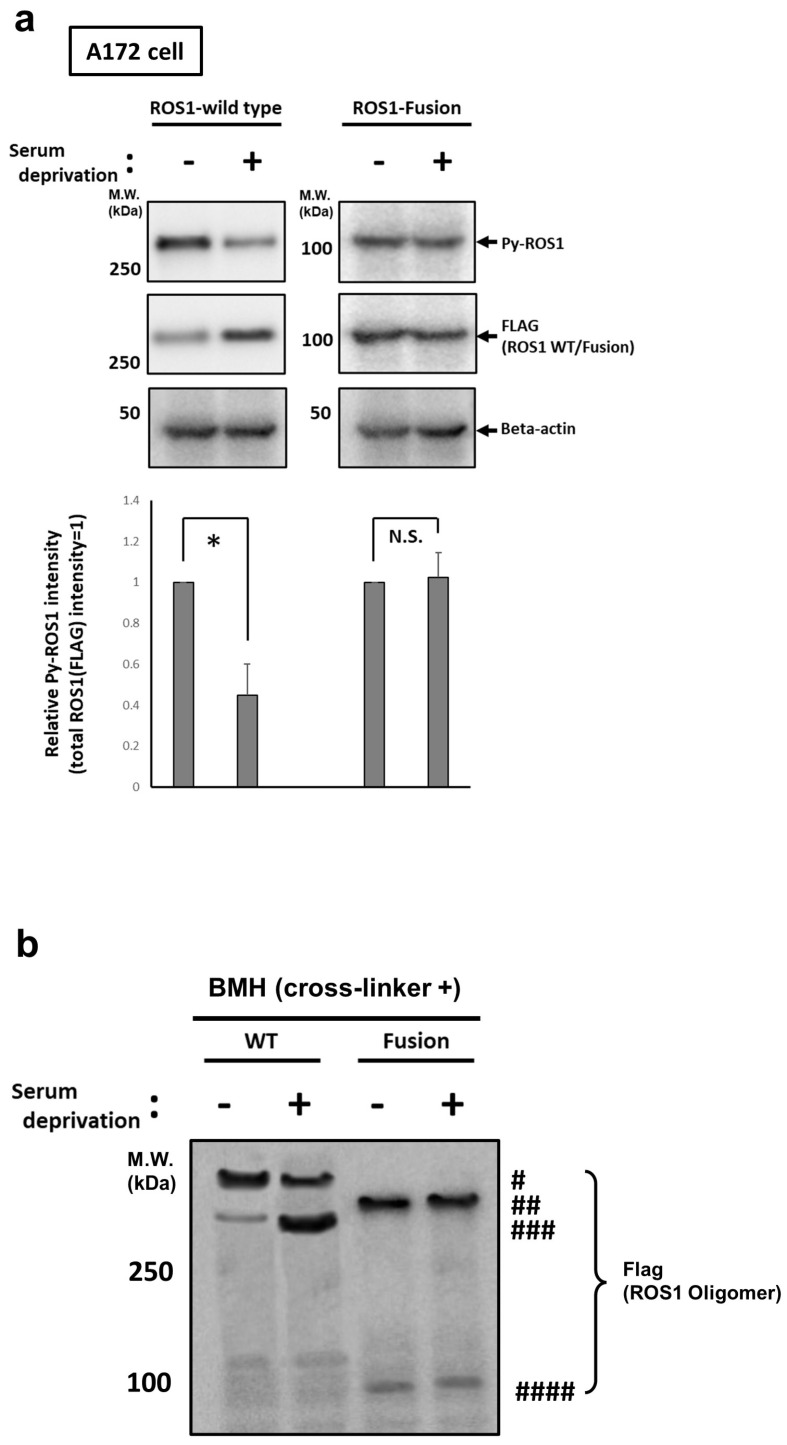
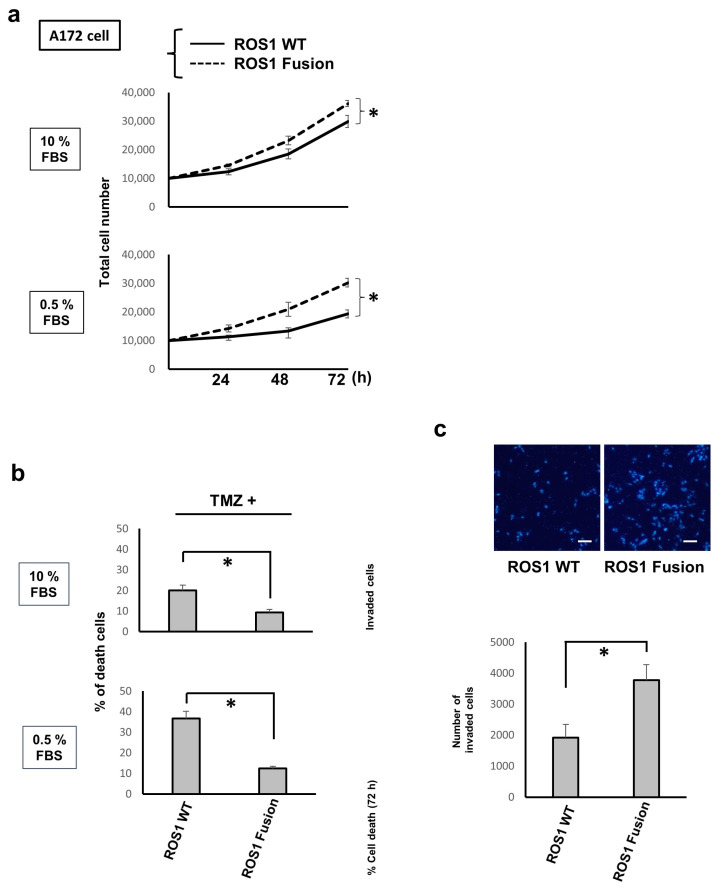
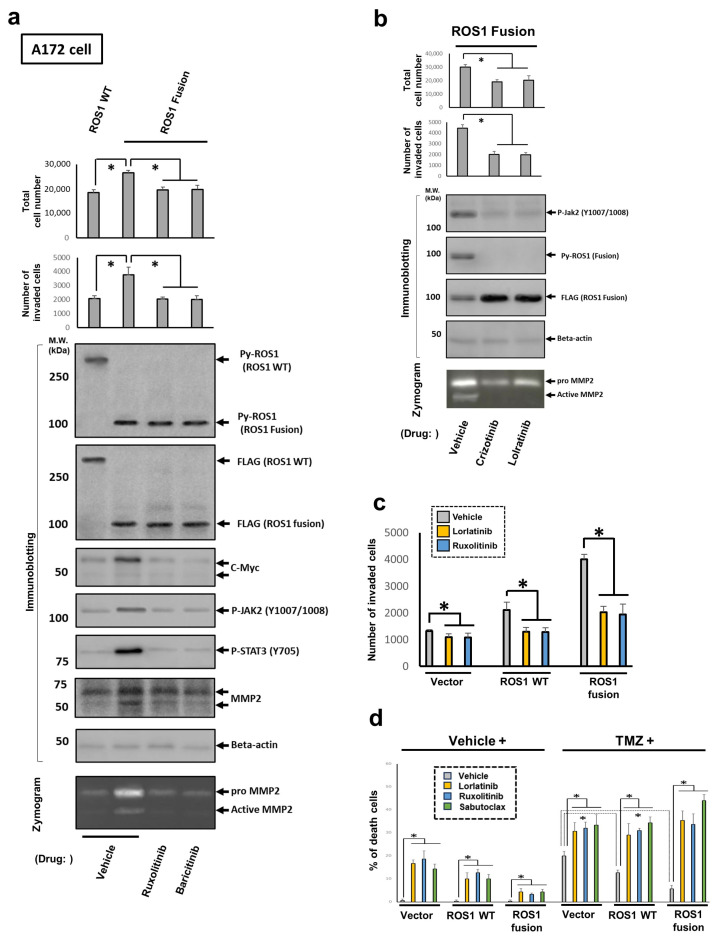
Here, we investigated the detailed molecular oncogenic mechanisms of a novel receptor tyrosine kinase (RTK) fusion, KLC1-ROS1, with an adapter molecule, KLC1, and an RTK, ROS1, discovered in pediatric glioma, and we explored a novel therapeutic target for glioma that possesses oncogenic RTK fusion. When wild-type ROS1 and KLC1-ROS1 fusions were stably expressed in the human glioma cell lines A172 and U343MG, immunoblotting revealed that KLC1-ROS1 fusion specifically activated the JAK2-STAT3 pathway, a major RTK downstream signaling pathway, when compared with wild-type ROS1. Immunoprecipitation of the fractionated cell lysates revealed a more abundant association of the KLC1-ROS1 fusion with JAK2 than that observed for wild-type ROS1 in the cytosolic fraction. A mutagenesis study of the KLC1-ROS1 fusion protein demonstrated the fundamental roles of both the KLC1 and ROS1 domains in the constitutive activation of KLC1-ROS1 fusion. Additionally, in vitro assays demonstrated that KLC1-ROS1 fusion upregulated cell proliferation, invasion, and chemoresistance when compared to wild-type ROS1. Combination treatment with the chemotherapeutic agent temozolomide and an inhibitor of ROS1, JAK2, or a downstream target of STAT3, demonstrated antitumor effects against KLC1-ROS1 fusion-expressing glioma cells. Our results demonstrate that KLC1-ROS1 fusion exerts oncogenic activity through serum-independent constitutive activation, resulting in specific activation of the JAK-STAT pathway. Our data suggested that molecules other than RTKs may serve as novel therapeutic targets for RTK fusion in gliomas.

Keywords: JAK-STAT pathway; KLC1-ROS1 fusion; glioma; oncogene.


Conflict of interest statement

The authors declare no conflict of interest.

Figures

Figure 1
Figure 1
Expression of KLC1-ROS1 fusion specifically activates the JAK-STAT pathway in glioma cells. (a) Schematic illustration of the domain structure of wild-type ROS1 (ROS1), wild-type KLC1 (KLC1), and KLC1-ROS1 fusion. The breakpoints of ROS1 (exon35) and KC1 (exon9) are indicated by an arrowhead with the corresponding amino acid (aa) positions. (b,c) Plasmids encoding the empty vector, FLAG-tagged wild-type (WT) ROS1, and FLAG-tagged KLC1-ROS1 fusion were stably expressed in A172 and U343MG human glioblastoma cell lines ((b) A172 cells, (c) U343MG cells). The cell lysates were analyzed by immunoblotting using the indicated antibodies. Primary anti-beta actin antibody and anti-GAPDH antibodies were used for confirming the protein loading amount of each sample. The uncropped blots are shown in File S1. (c) Three sets of A172 and U343MG cells stably expressing FLAG-tagged WT ROS1 and FLAG-tagged KLC1-ROS1 fusion proteins were established independently, and their cell lysates were analyzed by immunoblotting as shown in Figure 1b,c. (d) Changes in FLAG-tagged WT ROS1, FLAG-tagged KLC1-ROS1 fusion, Akt, ERK1/2, JAK2, and STAT3 activities after expressing FLAG-tagged ROS1 constructs in each cell were quantified by immunoblotting and calculated as follows: (phospho-protein values)/(FLAG-tagged WT ROS1 or FLAG-tagged KLC1-ROS1 fusion values). The mean of the calculated relative activities (value of WT ROS1-expressing cell = 1) is presented as a bar graph. * p > 0.01. N.S.: No Significance.
Figure 2
Figure 2
The KLC1-ROS1 fusion is specifically localized in cytoplasm and associates with JAK2. (a) FLAG-tagged wild-type (WT) ROS1 and FLAG-tagged KLC1-ROS1 fusion were stably expressed in A172 cells. After 72 h, the cell lysates were fractionated into plasma membrane, cytosolic, and nuclear fractions. Fractionated cell lysates were analyzed by immunoblotting using the indicated primary antibodies. Primary antibody for e-cadherin, beta actin, and PARP were used as the fraction marker for plasma membrane, cytosol, and nucleus, respectively. # precipitated IgG. (b) (Left) The cytosolic fractions of cell lysates obtained in Figure 2a were subjected to immunoprecipitation using anti-FLAG M2 affinity gel, and the precipitates were analyzed by immunoblotting using a primary anti-JAK2 antibody. (Right) The input cytosolic fractions were analyzed by immunoblotting using the indicated primary antibodies. Primary anti-beta actin antibody was used for controlling the amount of protein loading in each sample. The uncropped blots are shown in File S1. (c) The ratio of JAK2 association efficiency and the ROS1 domain phosphorylation in WT ROS1 and KLC1-ROS1 fusion were calculated from the quantitative results of Figure 2b. The ratio of JAK2 association efficiency was calculated as follows: (WT ROS1 or KLC1-ROS1 fusion-bound JAK2 value (Figure 2b, left))/(total WT ROS1 or KLC1-ROS1 fusion value (Figure 2b, right)). The ratio of ROS1 domain phosphorylation was calculated as follows: (Py-WT ROS1 or KLC1-ROS1 fusion value (Figure 2b, right))/(total WT ROS1 or KLC1-ROS1 fusion value (Figure 2b, right)). These ratios were expressed as relative values (WT ROS1 = 1) by the graphs. * p > 0.01.
Figure 3
Figure 3
Both the KLC1 domain and ROS1 domain are essential for activation of KLC1-ROS1 fusion. (a) Schematic illustration of FLAG-tagged KLC1-ROS1 fusion with or without mutation used in this study; C’-terminal FLAG-tagged KLC1-ROS1 fusion without mutation (fusion-full); the FLAG-tagged KLC1-ROS1 fusion with kinase dead point mutation of ROS1 (K520M, fusion (KD)); FLAG-tagged KLC1-ROS1 fusion with deletion of KLC1 domain (fusion (KLC1-del)). (b) The full construct and mutants of KLC1-ROS1 fusion protein in Figure 3a were transiently expressed in A172 cells. After 72 h, cell lysates were subjected to immunoprecipitation using a FLAG M2 affinity gel. Precipitates and input cell lysates were analyzed by immunoblotting using the indicated primary antibodies. The primary GAPDH antibody was used to control the amount of protein loading in each sample; * nonspecific bands; # precipitated IgG. (c) The mutants of KLC1-ROS1 fusion mutants generated in Figure 2a were transiently expressed in A172 cells. After 72 h, the cells were treated with vehicle (DMSO) or cell-permeable protein crosslinker (BMH) for in vitro protein crosslinking (see Section 2), and these crosslinked cell lysates were analyzed by immunoblotting using the indicated primary antibodies. The uncropped blots are shown in File S1.
Figure 4
Figure 4
Serum-independent activation of KLC1-ROS1 fusion in glioma cells. (a) (Top) A172 cells, stably expressed FLAG-tagged wild-type (WT) ROS1, and FLAG-tagged KLC1-ROS1 fusion were cultured under serum-reduced condition (0.5%). After 12 h, these cell lysates were analyzed by immunoblotting using indicated primary antibodies. Primary beta actin antibody was used for confirming the protein loading amount of each sample. * p > 0.01. N.S.: No Significance. (Bottom) The relative phosphorylated ROS1 level in each treated cell was calculated by quantitative results of Figure 4a (phospho-ROS1 value/total ROS1 value). (b) A172 cells, stably expressed FLAG-tagged WT ROS1, and FLAG-tagged KLC1-ROS1 fusion were treated as shown in Figure 4a. After 12 h, these cells were subjected to in vitro protein crosslinking assay as shown in Figure 3c, and obtained crosslinked cell lysates were analyzed by immunoblotting using anti-FLAG antibody; # ROS1 WT multimer; ## ROS1 fusion multimer; ### ROS1 WT monomer; #### ROS1 fusion monomer. The uncropped blots are shown in File S1.
Figure 5
Figure 5
KLC1-ROS1 fusion induces enhanced oncogenic properties compared with wild-type ROS1 in fusion in glioma cells. (a) A172 cells stably expressing FLAG-tagged wild-type (WT) ROS1 and FLAG-tagged KLC1-ROS1 fusion, as seen in Figure 1a, were cultured in serum (10% FBS, upper) or serum-reduced conditions (0.5% FBS, lower). At the indicated time points, the total cell number in each cell culture was quantitated using a cell counting assay. * p > 0.01. (b) The A172 cells used in Figure 5a were cultured under treatment with Temozolomide (TMZ treatment. 150 μM) in serum or serum-reduced conditions, the same as seen in Figure 5a. After 72 h, cells were subjected to a cell death assay. * p > 0.01. (c) The A172 cells shown in Figure 5a were subjected to a cell invasion assay. Fluorescence microscopy images of the stained nuclei of invaded cells (bar, 50 μm) (upper) and the quantitative results of the invasion assay (lower) are shown. * p > 0.01.
Figure 6
Figure 6
ROS1–JAK2–STAT3 axis-dependent upregulation of oncogenic properties of KLC1-ROS1 fusion expressed glioma cells compared with wild-type ROS1 expressed cells. (a) A172 cells stably expressing FLAG-tagged wild-type (WT) ROS1 or FLAG-tagged KLC1-ROS1 fusion, established in Figure 1a, were treated with the small-molecule JAK2 inhibitor ruxolitinib (1 μM) or baricitinib (1 μM), as well as vehicle (DMSO; control), as indicated. After 48 h, the total cell number was quantitated, and the cells were subjected to invasion assays. Cell lysates were analyzed using gelatin zymography to detect MMP2 activation. The primary antibody against beta actin was used for confirming the protein loading amount of each sample. * p > 0.01. (b) A172 cells stably expressing FLAG-tagged KLC1-ROS1 fusion were treated with the small-molecule ROS1 inhibitor crizotinib (500 nM), lorlatinib (100 nM), or vehicle (control), as indicated. After 48 h, cells were subjected to proliferation and invasion assays. Cell lysates were analyzed using gelatin zymography to detect MMP2 activation. The primary antibody against beta actin was used for controlling the amount of protein loading in each sample. * p > 0.01. The uncropped blots are shown in File S1. (c) A172 cells stably expressing FLAG-tagged WT ROS1, FLAG-tagged KLC1-ROS1 fusion, or empty vector, as seen in Figure 1a, were treated with the small-molecule ROS1 inhibitor lorlatinib (100 nM), the JAK2 inhibitor ruxolitinib (1 μM), and vehicle (DMSO; control), as indicated. After 48 h, the total cell number was quantitated, and the cells were subjected to invasion assays. * p > 0.01. (d) The A172 cells used in Figure 6c were treated with the small-molecule ROS1 inhibitor lorlatinib (100 nM), JAK2 inhibitor ruxolitinib (1 μM), Mcl-1 inhibitor sabutoclax (1 μM), or vehicle (DMSO; control) with vehicle (DMSO) or TMZ (150 μM), as indicated. After 72 h, the cells were subjected to cell death assay. * p > 0.01.

Similar articles

Cited by

References

    1. Panagopoulos I., Heim S. Interstitial Deletions Generating Fusion Genes. Cancer Genom. Proteom. 2021;18:167–196. doi: 10.21873/cgp.20251. - DOI - PMC - PubMed
    1. Kong Y., Jiang C., Wei G., Sun K., Wang R., Qiu T. Small Molecule Inhibitors as Therapeutic Agents Targeting Oncogenic Fusion Proteins: Current Status and Clinical. Molecules. 2023;28:4672. doi: 10.3390/molecules28124672. - DOI - PMC - PubMed
    1. Mitelman F., Johansson B., Mertens F. The impact of translocations and gene fusions on cancer causation. Nat. Rev. Cancer. 2007;7:233–245. doi: 10.1038/nrc2091. - DOI - PubMed
    1. Pederzoli F., Bandini M., Marandino L., Ali S.M., Madison R., Chung J., Ross J.S., Necchi A. Targetable gene fusions and aberrations in genitourinary oncology. Nat. Rev. Urol. 2020;17:613–625. doi: 10.1038/s41585-020-00379-4. - DOI - PubMed
    1. Rodriguez S.M.B., Kamel A., Ciubotaru G.V., Onose G., Sevastre A.S., Sfredel V., Danoiu S., Dricu A., Tataranu L.G. An Overview of EGFR Mechanisms and Their Implications in Targeted Therapies for Glioblastoma. Int. J. Mol. Sci. 2023;24:11110. doi: 10.3390/ijms241311110. - DOI - PMC - PubMed

LinkOut - more resources