. 2023 Dec 19;16(1):8.
doi: 10.3390/cancers16010008.

High Mitochondrial Protein Expression as a Potential Predictor of Relapse Risk in Acute Myeloid Leukemia Patients with the Monocytic FAB Subtypes M4 and M5

Affiliations

High Mitochondrial Protein Expression as a Potential Predictor of Relapse Risk in Acute Myeloid Leukemia Patients with the Monocytic FAB Subtypes M4 and M5

Frode Selheim et al. Cancers (Basel). .

Abstract

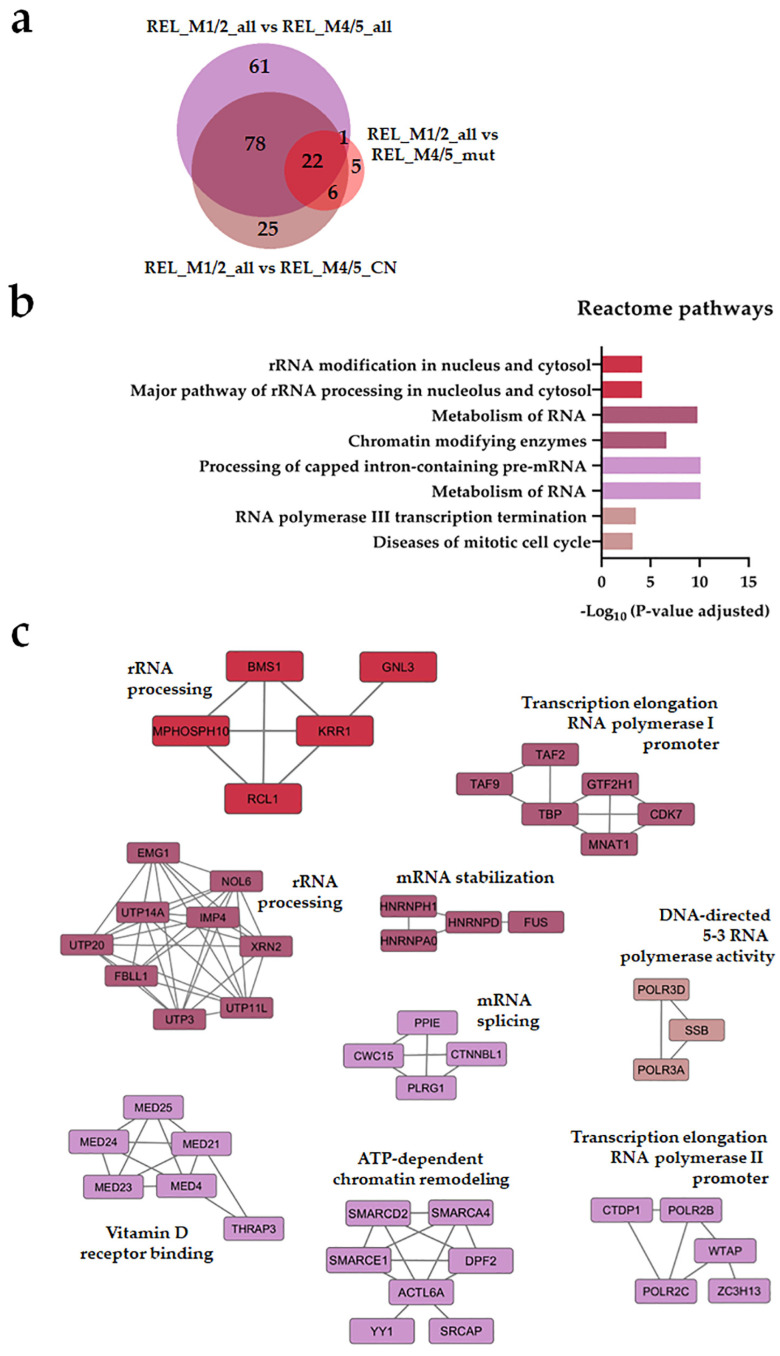
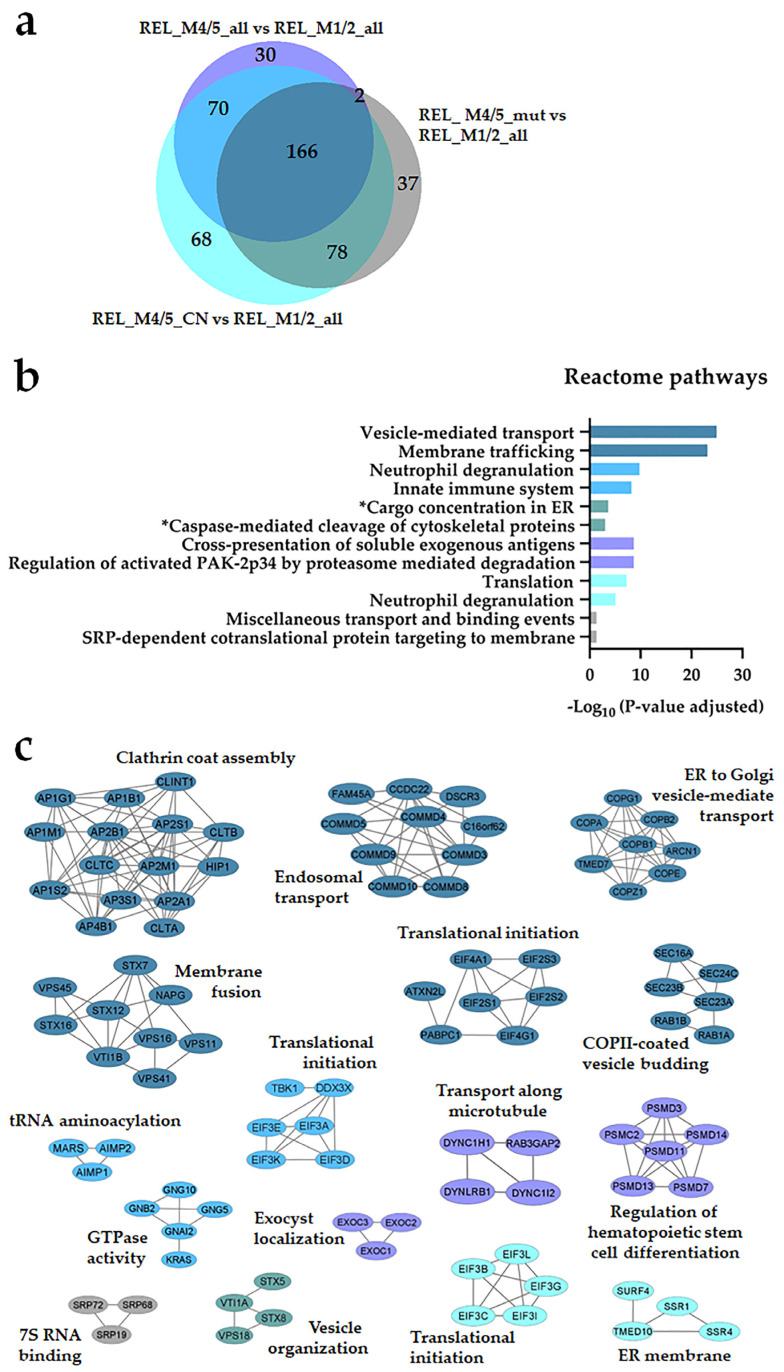
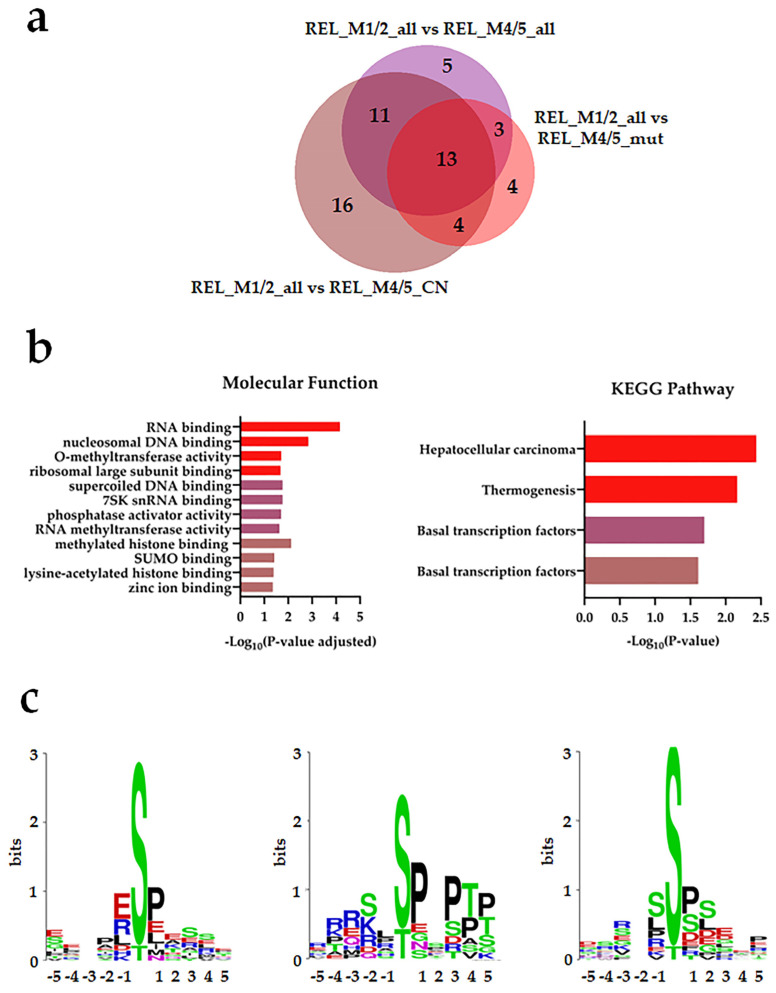
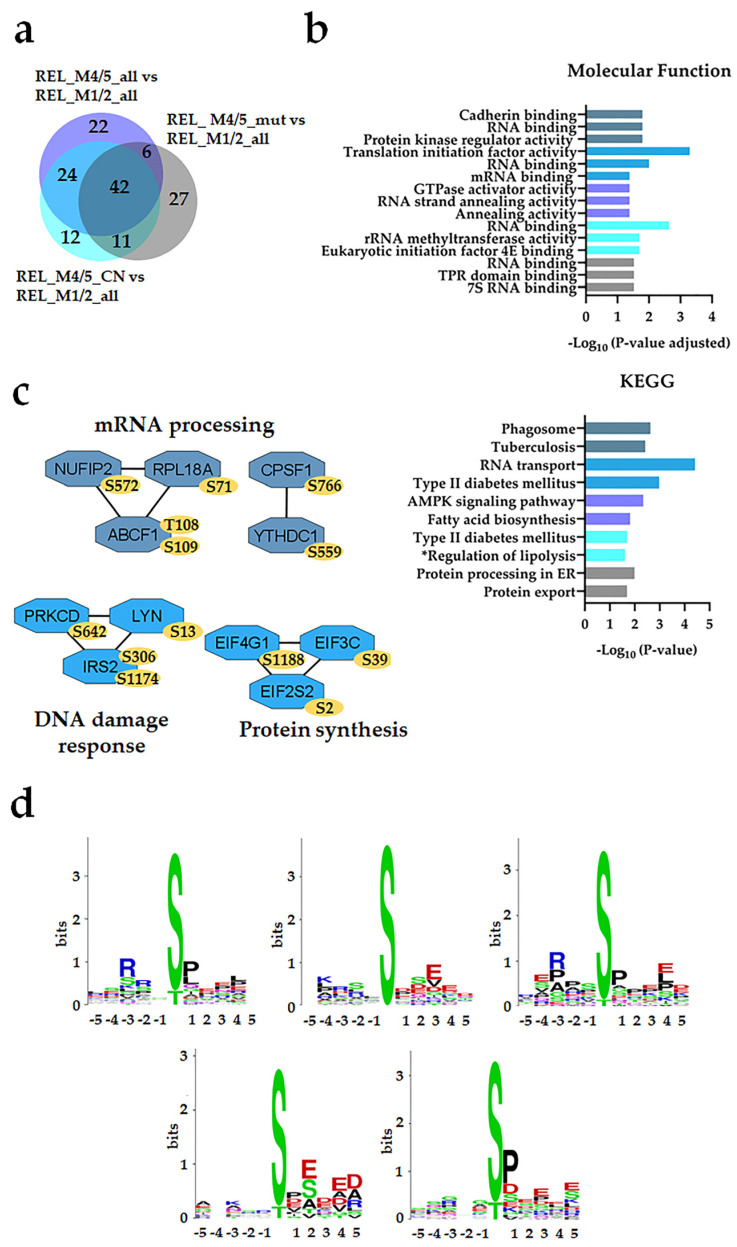
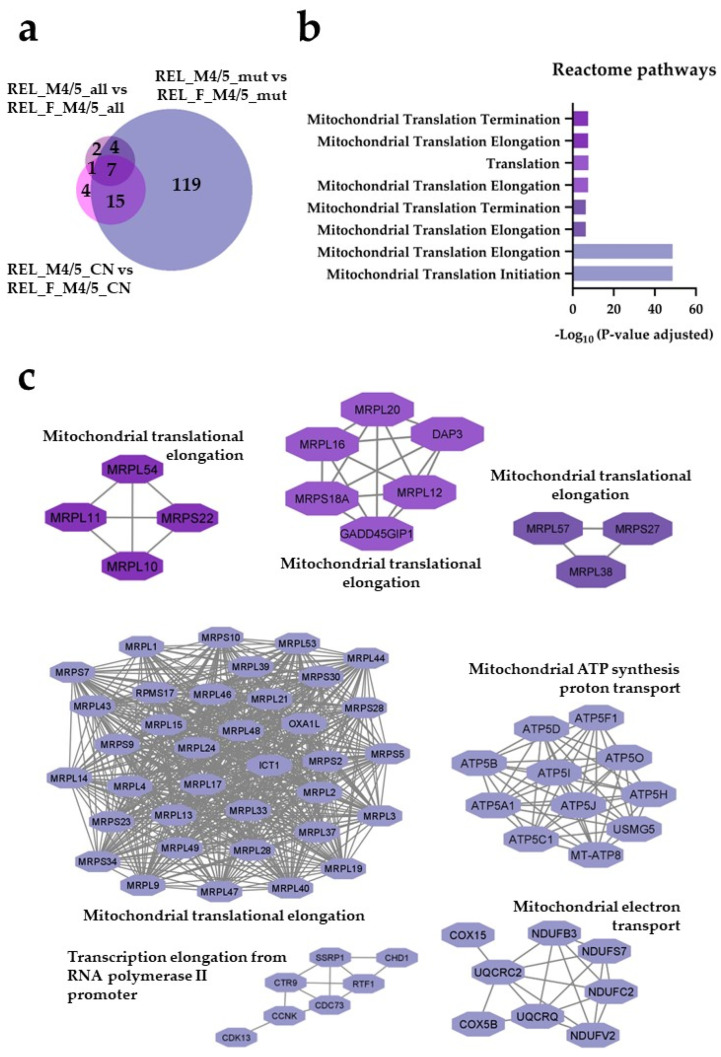
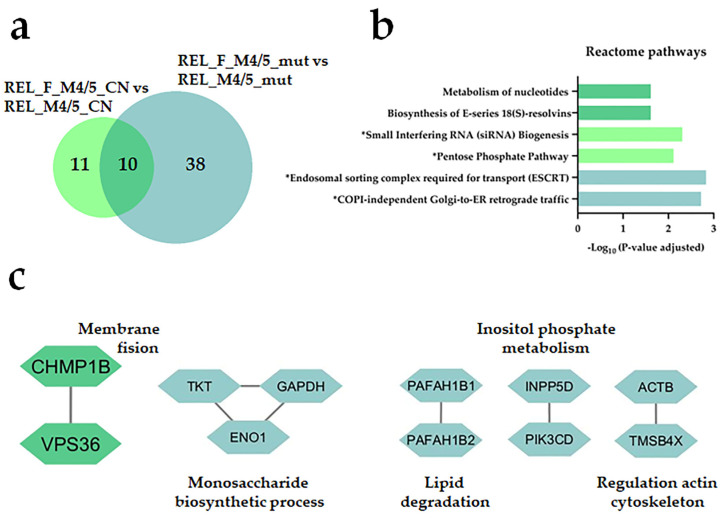
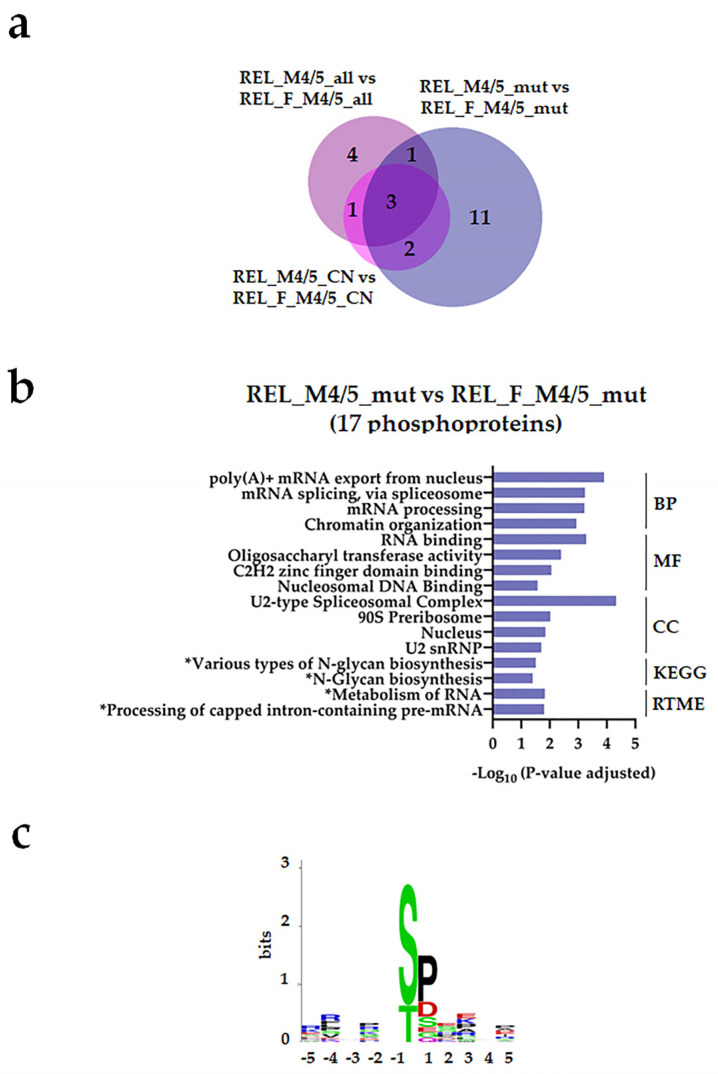
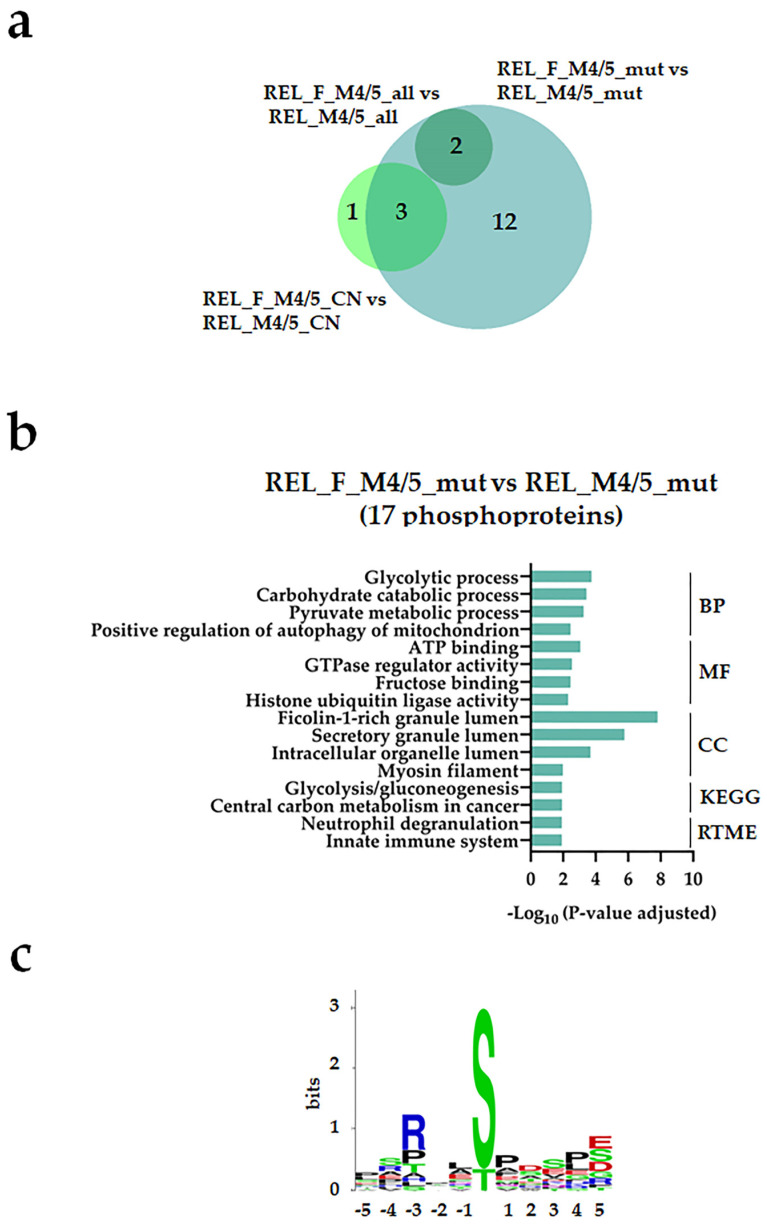
AML is a highly aggressive and heterogeneous form of hematological cancer. Proteomics-based stratification of patients into more refined subgroups may contribute to a more precise characterization of the patient-derived AML cells. Here, we reanalyzed liquid chromatography-tandem mass spectrometry (LC-MS/MS) generated proteomic and phosphoproteomic data from 26 FAB-M4/M5 patients. The patients achieved complete hematological remission after induction therapy. Twelve of them later developed chemoresistant relapse (RELAPSE), and 14 patients were relapse-free (REL_FREE) long-term survivors. We considered not only the RELAPSE and REL_FREE characteristics but also integrated the French-American-British (FAB) classification, along with considering the presence of nucleophosmin 1 (NPM1) mutation and cytogenetically normal AML. We found a significant number of differentially enriched proteins (911) and phosphoproteins (257) between the various FAB subtypes in RELAPSE patients. Patients with the myeloblastic M1/M2 subtype showed higher levels of RNA processing-related routes and lower levels of signaling related to terms like translation and degranulation when compared with the M4/M5 subtype. Moreover, we found that a high abundance of proteins associated with mitochondrial translation and oxidative phosphorylation, particularly observed in the RELAPSE M4/M5 NPM1 mutated subgroup, distinguishes relapsing from non-relapsing AML patient cells with the FAB subtype M4/M5. Thus, the discovery of subtype-specific biomarkers through proteomic profiling may complement the existing classification system for AML and potentially aid in selecting personalized treatment strategies for individual patients.

Keywords: FAB subtypes; acute myeloid leukemia; mass spectrometry; mitochondria; phosphoproteomic; proteomic; relapse.


Conflict of interest statement

The authors declare no conflict of interest.

Figures

Figure 1
Figure 1
The AML cell proteome shows increased abundance of rRNA metabolism and modification proteins for RELAPSE patients with FAB classification M1 and M2. (a) Venn diagram of regulated proteins (ANOVA, post hoc Turkey’s HSD with FDR < 0.05) obtained from REL_M1/2_all vs. REL_M4/5_all, REL_M1/2_all vs. REL_M4/5_mut, and REL_M1/2_all vs. REL_M4/5_CN comparisons. (b) Reactome pathways and (c) protein–protein interaction (PPI) network analyses of comparison-specific (61 and 25) and comparison-overlapping (78 and 22) regulated proteins. Bars and protein nodes are stained according to the colors displayed in the Venn diagram that represent overlapping and nonoverlapping subgroup comparisons.
Figure 2
Figure 2
The AML cell proteome shows increased translation, neutrophil degranulation, and intracellular protein/vesicle transport proteins for RELAPSE patients with FAB classification M4 and M5. (a) Venn diagram of regulated proteins obtained from REL_M4/5_all vs. REL_M1/2_all, REL_M4/5_mut vs. REL_M1/2_all, and REL_M4/5_CN vs. REL_M1/2_all comparisons. (b) Reactome pathways and (c) PPI network analyses of comparison-specific (30, 37, and 68) and comparison-overlapping (70, 166, and 78) regulated proteins. Bars and protein nodes are stained according to the colors displayed in the Venn diagram that represent overlapping and nonoverlapping subgroup comparisons. * It stands for Reactome pathways with unadjusted p-value < 0.05.
Figure 3
Figure 3
The AML cell phosphoproteome shows increased phosphorylation of RNA and DNA binding proteins for RELAPSE patients with FAB classification M1 and M2. (a) Venn diagram of differentially regulated phosphorylation sites (ANOVA, post hoc Turkey’s HSD with FDR < 0.05) obtained from REL_M1/2_all vs. REL_M4/5_all, REL_M1/2_all vs. REL_M4/5_mut, and REL_M1/2_all vs. REL_M4/5_CN comparisons. (b) Gene ontology (GO) with molecular function terms and KEGG pathway analyses of comparison-specific (16) and comparison-overlapping (11 and 13) differentially phosphorylated proteins. Bars are stained according to the colors displayed in the Venn diagram that represent overlapping and nonoverlapping subgroup comparisons. (c) Sequence motif analysis of the ±5 amino acids flanking the differentially regulated phosphorylation sites from the comparison-specific (16) on the right and comparison-overlapping (11 and 13) datasets in the middle and on the left, respectively.
Figure 4
Figure 4
The AML cell phosphoproteome shows increased phosphorylation of RNA binding and transcriptional proteins for RELAPSE patients with FAB classification M4 and M5. (a) Venn diagram of differentially regulated phosphorylation sites obtained from REL_M4/5_all vs. REL_M1/2_all, REL_M4/5_mut vs. REL_M1/2_all, and REL_M4/5_CN vs. REL_M1/2_all comparisons. (b) GO with molecular function terms and KEGG pathway analyses of comparison-specific (22, 12, and 27) and comparison-overlapping (42 and 24) differentially phosphorylated proteins. (c) PPI network analyses of overlapping (42 and 24) differentially phosphorylated proteins. Bars and protein nodes are stained according to the colors displayed in the Venn diagram that represent overlapping and nonoverlapping subgroup comparisons. (d) Sequence motif analysis of the ±5 amino acids flanking the differentially regulated phosphorylation sites from the comparison-specific (22, 12, and 27) on top, right, on bottom, left and bottom, right, respectively, and comparison-overlapping (42 and 24) datasets on top, left and on top, middle, respectively. * A shorter name for “Regulation of lipolysis in adipocytes” KEGG pathway is added for space purposes.
Figure 5
Figure 5
The AML cell proteome shows increased abundance of mitochondrial translational proteins for RELAPSE patients when compared with REL_FREE with FAB classification M4 and M5. (a) Venn diagram of regulated proteins obtained from REL_M4/5_all vs. REL_F_M4/5_all, REL_M4/5_mut vs. REL_F_M4/5_mut, and REL_M4/5_CN vs. REL_F_M4/5_CN comparisons. (b) Reactome pathway and (c) PPI network analyses of comparison-specific (119) and comparison-overlapping (15, 7, and 4) regulated proteins. Bars and protein nodes are stained according to the colors displayed in the Venn diagram that represent overlapping and nonoverlapping subgroup comparisons.
Figure 6
Figure 6
The AML cell proteome shows increased of proteins involved in the metabolism of nucleotides for REL_FREE patients when compared with RELAPSE with FAB classification M4 and M5. (a) Venn diagram of regulated proteins obtained from REL_F_M4/5_mut vs. REL_M4/5_mut, and REL_F_M4/5_CN vs. REL_M4/5_CN comparisons. (b) Reactome pathway and (c) PPI network analyses of comparison-specific (38 and 11) and comparison-overlapping (10) regulated proteins. Bars and protein nodes are stained according to the colors displayed in the Venn diagram that represent overlapping and nonoverlapping subgroup comparisons. * It stands for Reactome pathways with unadjusted p-value < 0.05.
Figure 7
Figure 7
The AML cell phosphoproteome shows increased phosphorylation of RNA and DNA binding proteins for RELAPSE patients with FAB classification M4 and M5 and with the NPM1 Ins mutation. (a) Venn diagram of differentially regulated phosphorylation sites obtained from REL_M4/5_all vs. REL_F_M4/5_all, REL_M4/5_mut vs. REL_F_M4/5_mut, and REL_M4/5_CN vs. REL_F_M4/5_CN comparisons. (b) GO with biological process (BP), molecular function (MF), and cellular compartment (CC) terms, KEGG and Reactome pathway analyses of 17 differentially higher phosphorylated proteins in the REL_M4/5_mut vs. REL_F_M4/5_mut comparison. (c) Sequence motif analysis of the ±5 amino acids flanking the differentially regulated phosphorylation sites in the REL_M4/5_mut vs. REL_F_M4/5_mut comparison. * It stands for KEGG and Reactome pathways with unadjusted p-value < 0.05.
Figure 8
Figure 8
The AML cell phosphoproteome shows increased phosphorylation of glycolysis and gluconeogenesis proteins for RELAPSE_FREE patients with FAB classification M4 and M5 and with the NPM1 Ins mutation. (a) Venn diagram of differentially regulated phosphorylation sites obtained from REL_F_M4/5_all vs. REL_M4/5_all, REL_F_M4/5_mut vs. REL_M4/5_mut, and REL_F_M4/5_CN vs. REL_M4/5_CN comparisons. (b) GO with BP, MF, and CC terms, KEGG and Reactome pathway analyses of 17 differentially higher phosphorylated proteins in the REL_F_M4/5_mut vs. REL_M4/5_mut comparison. (c) Sequence motif analysis of the ±5 amino acids flanking the differentially regulated phosphorylation sites in the REL_F_M4/5_mut subgroup when compared to REL_M4/5_mut patients.

Similar articles

Cited by

References

    1. Dohner H., Wei A.H., Appelbaum F.R., Craddock C., DiNardo C.D., Dombret H., Ebert B.L., Fenaux P., Godley L.A., Hasserjian R.P., et al. Diagnosis and management of AML in adults: 2022 recommendations from an international expert panel on behalf of the ELN. Blood. 2022;140:1345–1377. doi: 10.1182/blood.2022016867. - DOI - PubMed
    1. Khoury J.D., Solary E., Abla O., Akkari Y., Alaggio R., Apperley J.F., Bejar R., Berti E., Busque L., Chan J.K.C., et al. The 5th edition of the World Health Organization Classification of Haematolymphoid Tumours: Myeloid and Histiocytic/Dendritic Neoplasms. Leukemia. 2022;36:1703–1719. doi: 10.1038/s41375-022-01613-1. - DOI - PMC - PubMed
    1. Bennett J.M., Catovsky D., Daniel M.T., Flandrin G., Galton D.A., Gralnick H.R., Sultan C. Proposals for the classification of the acute leukaemias. French-American-British (FAB) co-operative group. Br. J. Haematol. 1976;33:451–458. doi: 10.1111/j.1365-2141.1976.tb03563.x. - DOI - PubMed
    1. Dohner H., Estey E.H., Amadori S., Appelbaum F.R., Buchner T., Burnett A.K., Dombret H., Fenaux P., Grimwade D., Larson R.A., et al. Diagnosis and management of acute myeloid leukemia in adults: Recommendations from an international expert panel, on behalf of the European LeukemiaNet. Blood. 2010;115:453–474. doi: 10.1182/blood-2009-07-235358. - DOI - PubMed
    1. Arber D.A., Orazi A., Hasserjian R., Thiele J., Borowitz M.J., Le Beau M.M., Bloomfield C.D., Cazzola M., Vardiman J.W. The 2016 revision to the World Health Organization classification of myeloid neoplasms and acute leukemia. Blood. 2016;127:2391–2405. doi: 10.1182/blood-2016-03-643544. - DOI - PubMed

LinkOut - more resources