. 2023 Dec 22;16(1):80.
doi: 10.3390/cancers16010080.

Cyclooxygenase-2 Blockade Is Crucial to Restore Natural Killer Cell Activity before Anti-CTLA-4 Therapy against High-Grade Serous Ovarian Cancer

Affiliations

Cyclooxygenase-2 Blockade Is Crucial to Restore Natural Killer Cell Activity before Anti-CTLA-4 Therapy against High-Grade Serous Ovarian Cancer

Fernán Gómez-Valenzuela et al. Cancers (Basel). .

Abstract

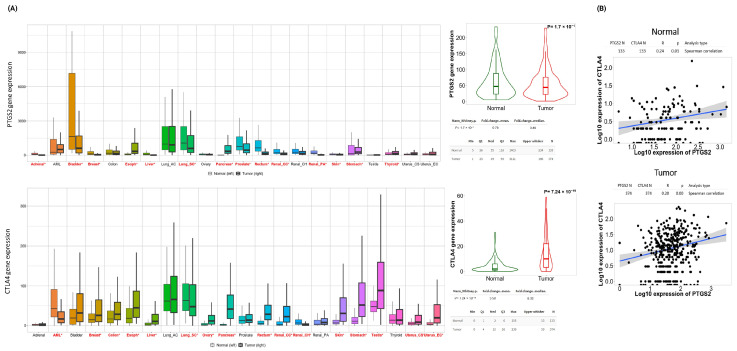
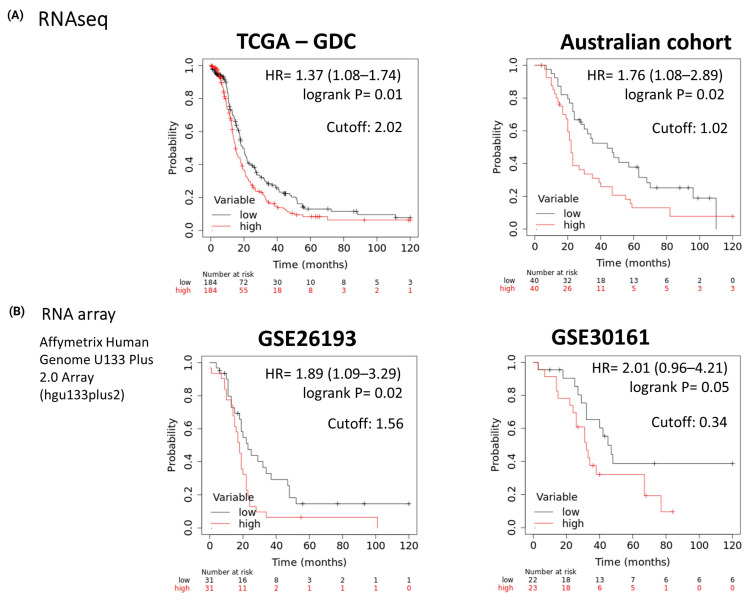
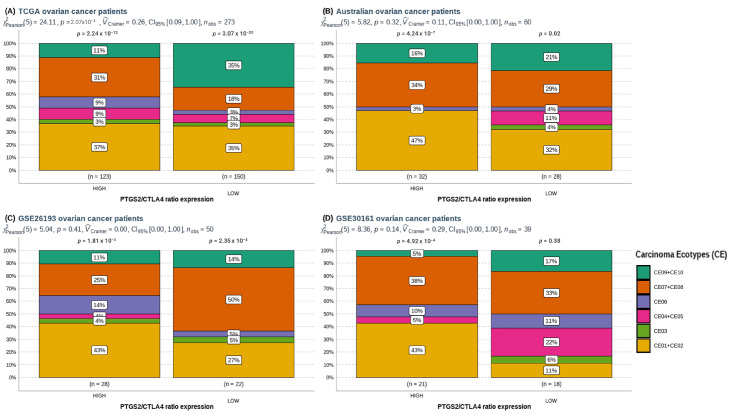
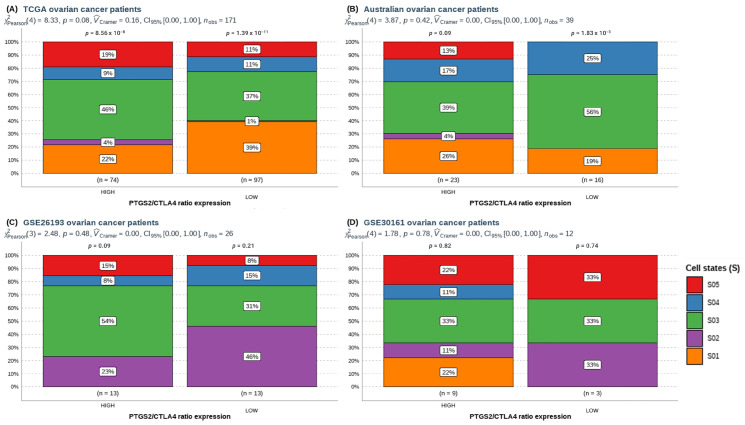
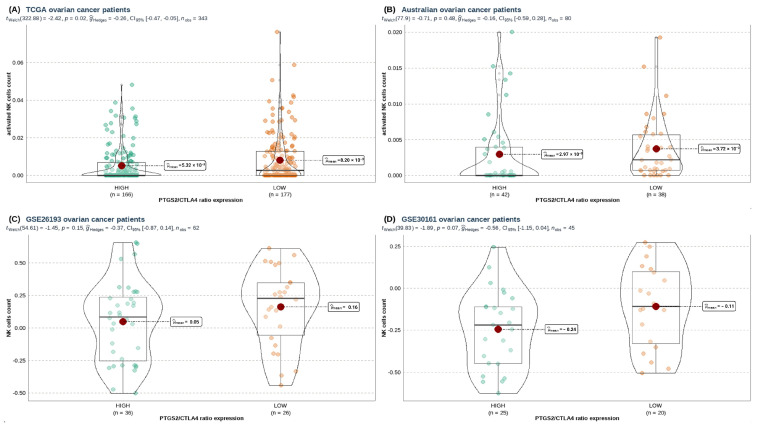
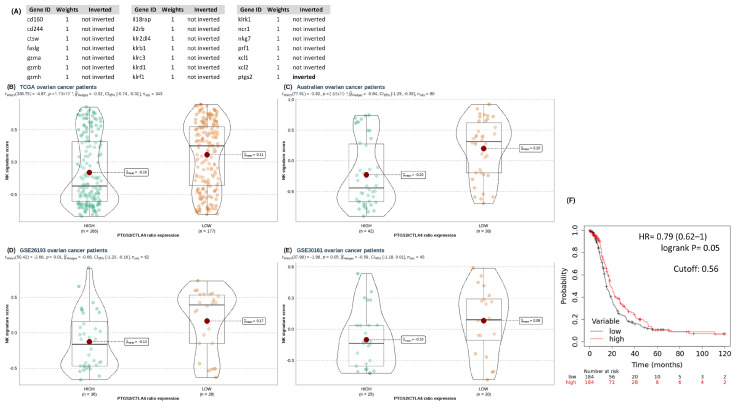
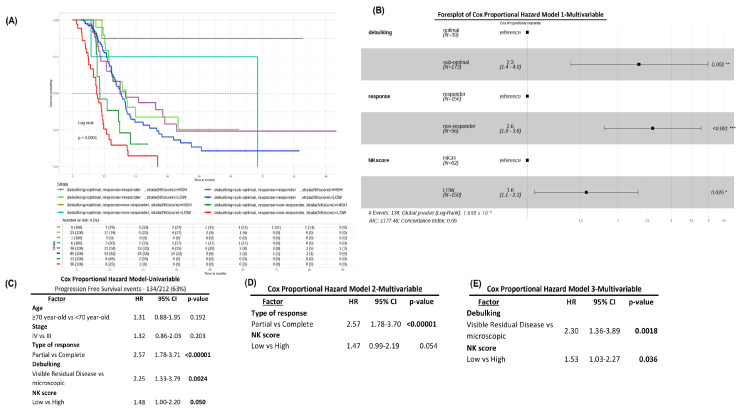
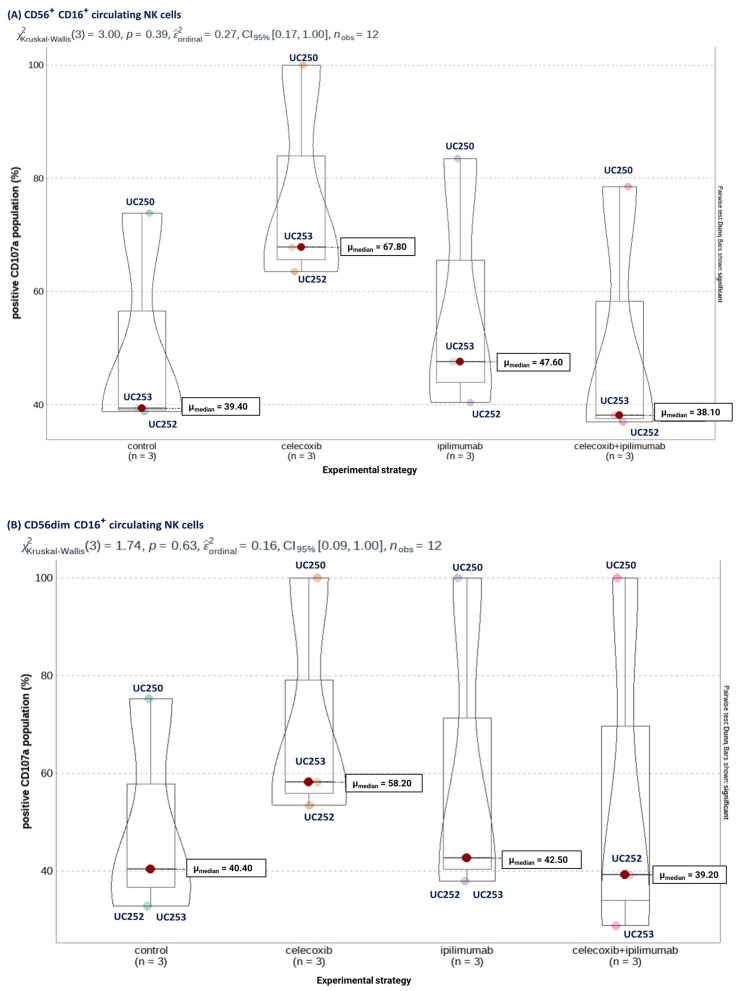
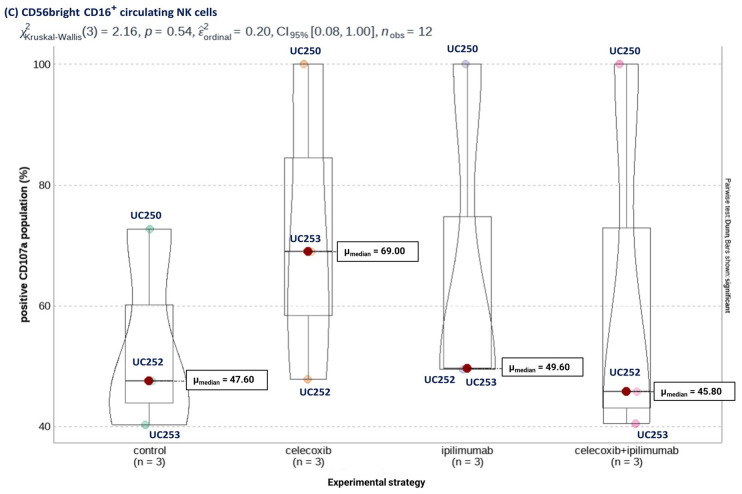
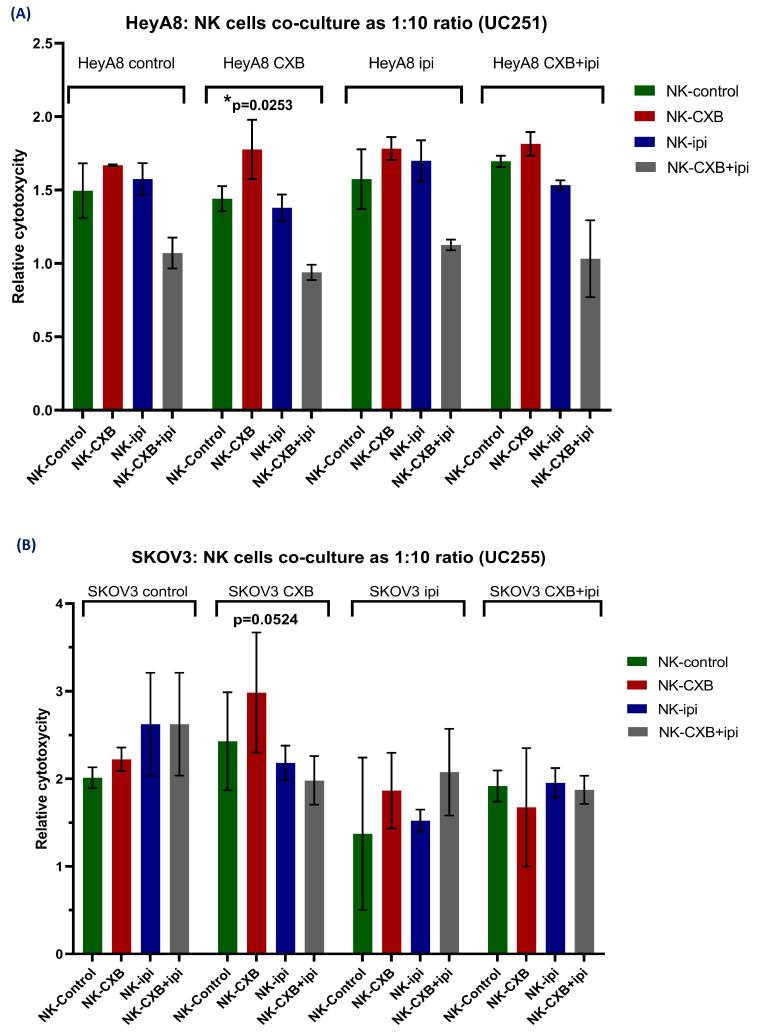
Chronic inflammation influences the tumor immune microenvironment (TIME) in high-grade serous ovarian cancer (HGSOC). Specifically, cyclooxygenase-2 (COX-2) overexpression promotes cytotoxic T-lymphocyte-associated protein-4 (CTLA-4) expression. Notably, elevated COX-2 levels in the TIME have been associated with reduced response to anti-CTLA-4 immunotherapy. However, the precise impact of COX-2, encoded by PTGS2, on the immune profile remains unknown. To address this, we performed an integrated bioinformatics analysis using data from the HGSOC cohorts (TCGA-OV, n = 368; Australian cohort AOCS, n = 80; GSE26193, n = 62; and GSE30161, n = 45). Employing Gene Set Variation Analysis (GSVA), MIXTURE and Ecotyper cell deconvolution algorithms, we concluded that COX-2 was linked to immune cell ecosystems associated with shorter survival, cell dysfunction and lower NK cell effector cytotoxicity capacity. Next, we validated these results by characterizing circulating NK cells from HGSOC patients through flow cytometry and cytotoxic assays while undergoing COX-2 and CTLA-4 blockade. The blockade of COX-2 improved the cytotoxic capacity of NK cells against HGSOC cell lines. Our findings underscore the relevance of COX-2 in shaping the TIME and suggest its potential as a prognostic indicator and therapeutic target. Increased COX-2 expression may hamper the effectivity of immunotherapies that require NK cell effector function. These results provide a foundation for experimental validation and clinical trials investigating combined therapies targeting COX-2 and CTLA-4 in HGSOC.

Keywords: NK cells; cyclooxygenase-2; cytotoxic T-lymphocyte-associated protein-4; high-grade serious ovarian cancer; immunotherapy; tumor immune microenvironment.


Conflict of interest statement

The authors declare no conflict of interest related to this research.

Figures

Figure 1
Figure 1
Pan-cancer comparison of PTGS2 and CTLA4 expression in available normal and tumor samples: (A) RNA-Seq data, and (B) Spearman correlation analysis of PTGS2 and CTLA4 in normal ovarian tissue and ovarian tumor. Analysis realized in TNMplot web tool created by Bartha et al. [38]. Red letters and * symbol indicate a statistical difference between tumor and normal tissue.
Figure 2
Figure 2
Kaplan-Meier plot defined by Progression Free Survival (PFS) of ovarian cancer patients based on (A) RNA-Seq (TCGA-GDC, Australian cohort) and (B) RNA arrays (GSE26193, GSE30161) datasets according to median expression (defined cutoff) of PTGS2/CTLA4 ratio.
Figure 3
Figure 3
Prevalence comparison of carcinoma ecotypes (CE) in (A) TCGA-GDC, (B) Australian patients, (C) GSE26193, (D) GSE30161 ovarian patients’ cohorts according to high or low PTGS2/CTLA4 ratio. For comparison, we grouped CE associated with good prognosis/response to treatment (CE09 + CE10), and analyzed separately those who are associated with worse prognosis/response to treatment (CE03 and CE06). Pearson’s chi-squared test was performed through ggstatsplot R package.
Figure 4
Figure 4
Prevalence comparison of NK cell states (S) defined in patients from (A) TCGA-GDC, (B) AOCS patients, (C) GSE26193, (D) GSE30161 ovarian patients’ cohorts according to high or low PTGS2/CTLA4 ratio expression. Pearson’s chi-squared test performed through ggstatsplot R package.
Figure 5
Figure 5
Comparison of MIXTURE’s activated NK cell estimation for (A) TCGA-GDC and (B) AOCS cohorts; (C) GSVA enrichment of NK cells from Nieto’ signature for GSE26193 and (D) GSE30161 ovarian patients’ cohorts. Selection of groups according to PTGS2/CTLA4 ratio expression. Welch’s t-test performed through ggstatsplot R package.
Figure 6
Figure 6
(A) NK score gene list for survival analysis inversely related with PTGS2 gene. Comparison of GSVA enrichment of NK score signature according to PTGS2/CTLA4 ratio for (B) TCGA-GDC, (C) AOCS cohorts, (D) GSE26193, and (E) GSE30161. (F) Kaplan-Meier plot defined by Progression Free Survival (PFS) of TCGA-GDC ovarian cancer patients according to median expression (defined cutoff) of NK score expression. Welch’s t-test performed through ggstatsplot R package.
Figure 7
Figure 7
Disease Free Progression (PFS) (A) curve and (B) forest plot for multivariate Cox proportional hazard regression analyses based on debulking, response to treatment, and NK score. (CE) Univariate and multivariate Cox proportional regression analyses carried out to assess NK score as an independent risk factor. * p < 0.05, ** p < 0.01, *** p < 0.001.
Figure 8
Figure 8
Comparison of the mean percentage of CD107a+ in (A) total CD56+CD16+, (B) CD56dimCD16+, and (C) CD56brightCD16+ circulating NK cells, according to experimental strategy. Kruskal-Wallis test. Significance was defined as p-value < 0.05.
Figure 8
Figure 8
Comparison of the mean percentage of CD107a+ in (A) total CD56+CD16+, (B) CD56dimCD16+, and (C) CD56brightCD16+ circulating NK cells, according to experimental strategy. Kruskal-Wallis test. Significance was defined as p-value < 0.05.
Figure 9
Figure 9
Relative cytotoxicity (compared to independent cell cultures) of (A) HeyA8 and (B) SKOV3 cell line co-cultured with circulating NK cells from HGSOC patients UC251 and UC252, respectively. The cytotoxicity was measured by bioluminescence for LDH released into the culture medium. Each bar represents n = 3 replicates with standard deviation. CXB, celecoxib. Ipi, ipilimumab. Two-way ANOVA with Tukey’s multiple comparisons. Significance was defined as p-value < 0.05.

Similar articles

Cited by

References

    1. Cheng Z., Mirza H., Ennis D.P., Smith P., Morrill Gavarró L., Sokota C., Giannone G., Goranova T., Bradley T., Piskorz A., et al. The Genomic Landscape of Early-Stage Ovarian High-Grade Serous Carcinoma. Clin. Cancer Res. Off. J. Am. Assoc. Cancer Res. 2022;28:2911–2922. doi: 10.1158/1078-0432.CCR-21-1643. - DOI - PMC - PubMed
    1. Zhang J., Huang D., Saw P.E., Song E. Turning cold tumors hot: From molecular mechanisms to clinical applications. Trends Immunol. 2022;43:523–545. doi: 10.1016/j.it.2022.04.010. - DOI - PubMed
    1. Pinto M.P., Balmaceda C., Bravo M.L., Kato S., Villarroel A., Owen G.I., Roa J.C., Cuello M.A., Ibañez C. Patient inflammatory status and CD4+/CD8+ intraepithelial tumor lymphocyte infiltration are predictors of outcomes in high-grade serous ovarian cancer. Gynecol. Oncol. 2018;151:10–17. doi: 10.1016/j.ygyno.2018.07.025. - DOI - PubMed
    1. Knutson K.L., Maurer M.J., Preston C.C., Moysich K.B., Goergen K., Hawthorne K.M., Cunningham J.M., Odunsi K., Hartmann L.C., Kalli K.R., et al. Regulatory T cells, inherited variation, and clinical outcome in epithelial ovarian cancer. Cancer Immunol. Immunother. CII. 2015;64:1495–1504. doi: 10.1007/s00262-015-1753-x. - DOI - PMC - PubMed
    1. Worzfeld T., Pogge von Strandmann E., Huber M., Adhikary T., Wagner U., Reinartz S., Müller R. The Unique Molecular and Cellular Microenvironment of Ovarian Cancer. Front. Oncol. 2017;7:24. doi: 10.3389/fonc.2017.00024. - DOI - PMC - PubMed