. 2023 Dec 23;16(1):82.
doi: 10.3390/cancers16010082.

A Novel Tissue-Free Method to Estimate Tumor-Derived Cell-Free DNA Quantity Using Tumor Methylation Patterns

Affiliations

A Novel Tissue-Free Method to Estimate Tumor-Derived Cell-Free DNA Quantity Using Tumor Methylation Patterns

Collin A Melton et al. Cancers (Basel). .

Abstract

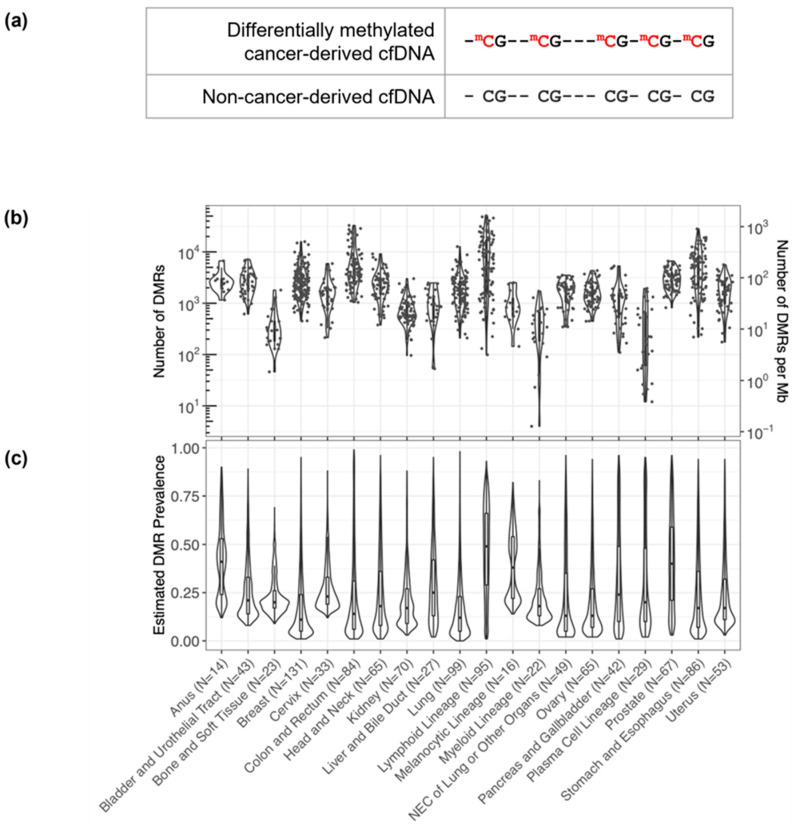
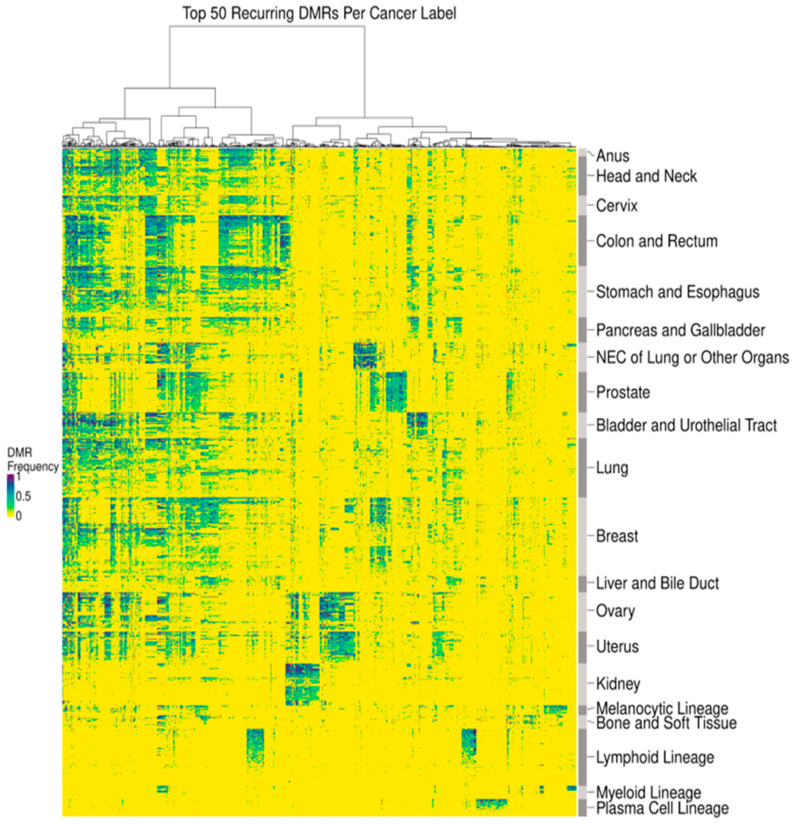
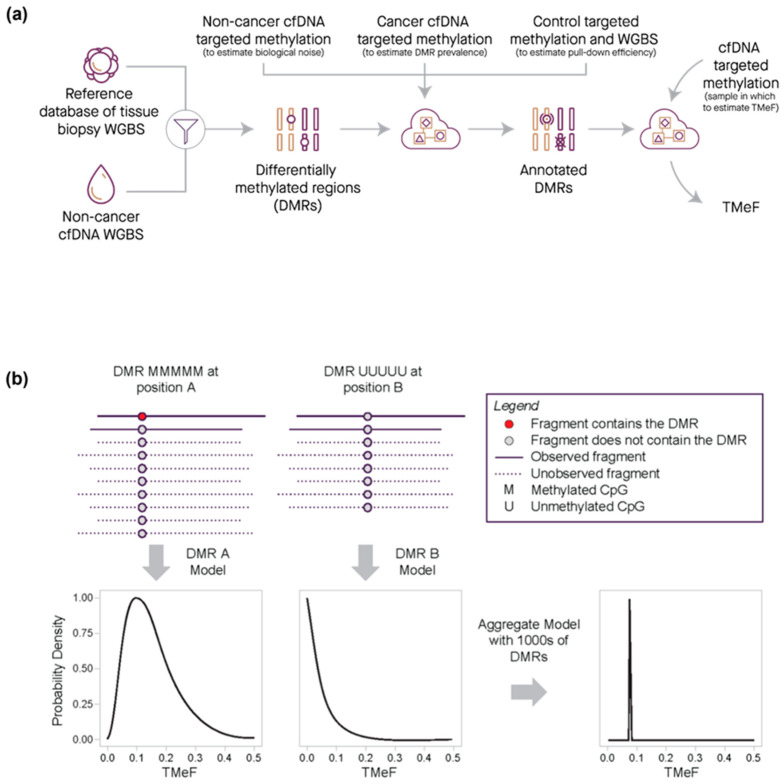
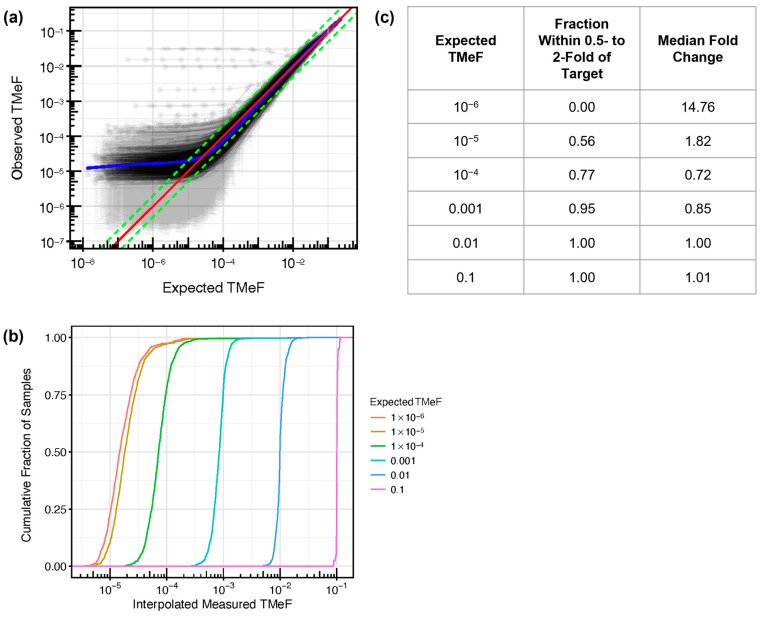
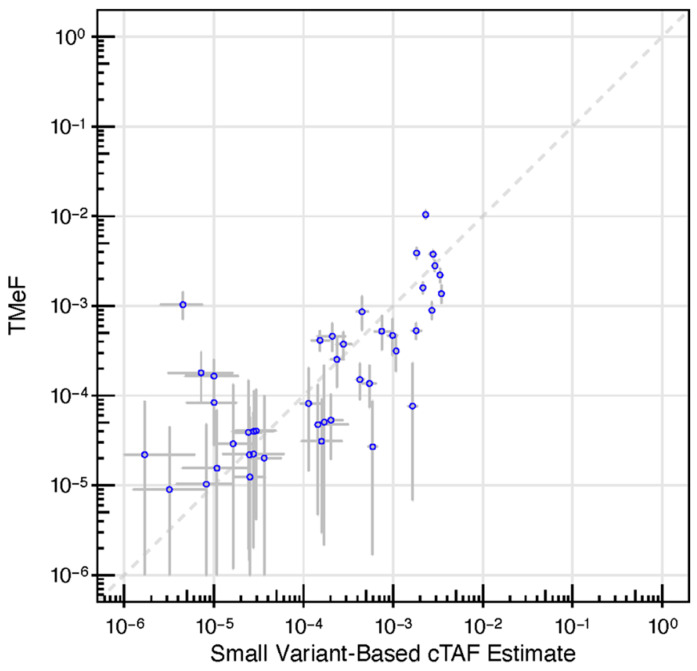
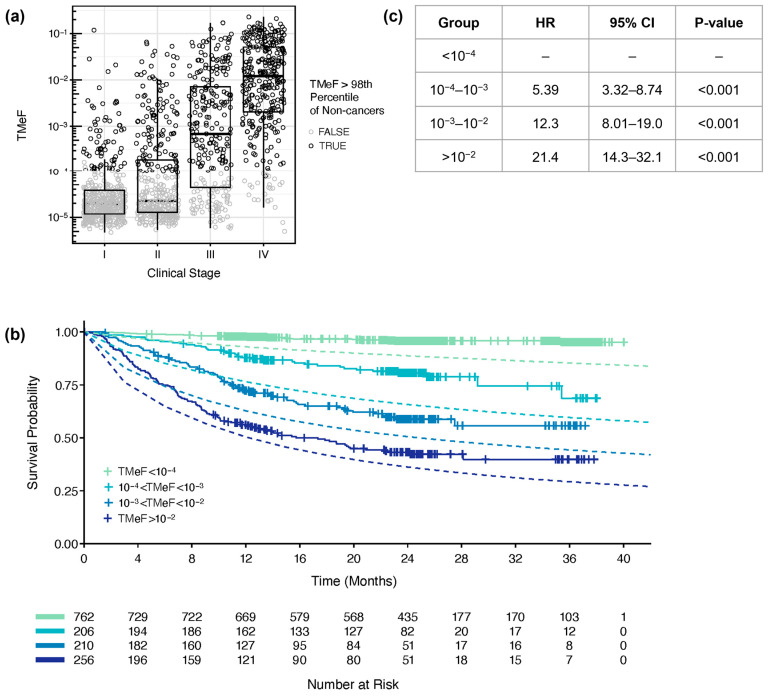
Estimating the abundance of cell-free DNA (cfDNA) fragments shed from a tumor (i.e., circulating tumor DNA (ctDNA)) can approximate tumor burden, which has numerous clinical applications. We derived a novel, broadly applicable statistical method to quantify cancer-indicative methylation patterns within cfDNA to estimate ctDNA abundance, even at low levels. Our algorithm identified differentially methylated regions (DMRs) between a reference database of cancer tissue biopsy samples and cfDNA from individuals without cancer. Then, without utilizing matched tissue biopsy, counts of fragments matching the cancer-indicative hyper/hypo-methylated patterns within DMRs were used to determine a tumor methylated fraction (TMeF; a methylation-based quantification of the circulating tumor allele fraction and estimate of ctDNA abundance) for plasma samples. TMeF and small variant allele fraction (SVAF) estimates of the same cancer plasma samples were correlated (Spearman's correlation coefficient: 0.73), and synthetic dilutions to expected TMeF of 10-3 and 10-4 had estimated TMeF within two-fold for 95% and 77% of samples, respectively. TMeF increased with cancer stage and tumor size and inversely correlated with survival probability. Therefore, tumor-derived fragments in the cfDNA of patients with cancer can be leveraged to estimate ctDNA abundance without the need for a tumor biopsy, which may provide non-invasive clinical approximations of tumor burden.

Keywords: DNA methylation; biomarkers; cell-free DNA; circulating tumor DNA; computational methods; liquid biopsy; machine learning algorithms; tumor fraction; variant allele fraction.


Conflict of interest statement

Y.Z., M.R.-S. and A.H.S. are employees of GRAIL, LLC. C.C., S.S. and G.C. are employees of GRAIL, LLC with equity in Illumina, Inc. C.A.M., A.S., C.C.K., E.S. and P.-Y.C. are employees of GRAIL, LLC with equity in GRAIL, LLC and Illumina, Inc. P.F. and S.B. were previously employed by GRAIL, LLC with equity in GRAIL, LLC and Illumina, Inc.

Figures

Figure 1
Figure 1
Discovery of short DMRs in cancer tissue samples. (a) A pictorial representation of a short 5 CpG DMR highlighting the differential methylation pattern in the cancer-derived pre-treatment cfDNA (red) relative to non-cancer-derived cfDNA. (b) Within each cancer sample, hundreds to thousands of DMRs were identified. The number of DMRs identified per sample per cancer label is plotted and overlaid as a violin plot summarizing the distribution across the samples. (c) For each DMR identified within each cancer label, the prevalence of the DMR (i.e., the fraction of cancer tissue samples in which the DMR occurs) per cancer label was estimated. The distributions of the DMR prevalence estimates per cancer label are each displayed as a violin plot overlaid with a box plot. N values correspond to the number of cancer tissue samples per cancer label.
Figure 2
Figure 2
DMRs delineated cancer type-associated methylation patterns. A heatmap depicting the observed DMR frequency of the 50 most prevalent DMRs per cancer label (x-axis) across tissue samples (y-axis). Samples within each cancer label were clustered using Manhattan distance, and cancer labels were clustered using Spearman’s distance applied to a per cancer label average. DMRs were clustered by Manhattan distance.
Figure 3
Figure 3
Quantification of TMeF by comparing DMR cancer-indicative methylation patterns. (a) Schematic of the information flow for generating a TMeF estimate. First, DMRs were identified that differentiate tissue biopsy methylation WGBS for a particular cancer type from non-cancer cfDNA WGBS. Next, DMRs were annotated with information derived from non-cancer cfDNA targeted methylation (an estimate of biological noise), cancer cfDNA targeted methylation (an estimate of DMR prevalence), and both control sample targeted methylation and WGBS (an estimate of pull-down efficiency). Finally, counts of fragments with annotated DMRs in a targeted methylation cfDNA sample were used to estimate TMeF. (b) Schematic illustrating the TMeF computation. Sequenced fragments are shown as solid lines with DMRs (red dots) and without DMRs (gray dots) at 2 genomic sites (position A and position B). Unobserved fragments both with and without DMRs are depicted by dashed lines. Site specific counts of fragments with DMRs are consistent with a range of possible TMeF levels with each level conveying a specific likelihood. Aggregation of likelihoods across loci results in a sample-level TMeF estimate.
Figure 4
Figure 4
Synthetic dilution analysis assessed TMeF linearity. (a) Synthetic dilutions were generated by mixing each of 457 pre-treatment, solid cancer cfDNA samples from CCGA substudy 3 into a paired randomly matched non-cancer cfDNA background sample. Dilutions were generated in triplicate across a series of dilution levels, and the measured TMeF was plotted against the expected TMeF. The red line indicates y = x (i.e., expected TMeF = observed TMeF). The green lines represent y = 0.5x and y = 2x (in log space this results in a difference in intercept) as a visual reference for how many curves are within 0.5- to 2-fold of the target. The blue line shows the best fit as determined using a general additive model with the restricted maximum likelihood method. A small number of outlier series can be seen with high observed TMeF across all dilution levels. This is due to the high level of background signal in the specific matched non-cancer samples used in each of these cases. (b) For vertical slices in (a) at fixed expected TMeF values, the cumulative fraction of observed TMeF was interpolated and plotted. (c) For each cumulative distribution in (b) at a fixed expected TMeF value, the fraction of measured TMeF within 0.5- to 2-fold of the expected TMeF and the median fold-change deviation from the expected TMeF were calculated. The expected TMeF values include 10−6 to demonstrate the limited TMeF accuracy at this low ctDNA level.
Figure 5
Figure 5
DMRs enabled allele fraction estimation. A scatter plot depicting TMeF (y-axis) vs. patient-specific panel small variant estimates (x-axis) in pre-treatment plasma samples from CCGA substudy 2 participants with solid cancers. TMeF and SVAF estimates correlated with a Spearman’s correlation of 0.73, p = 2.3 × 10⁻⁷. Points indicate posterior median. Error bars represent the 95% credible interval defined by the 2.5 and 97.5 percentiles of the posterior allele fraction distribution.
Figure 6
Figure 6
TMeF correlated with clinical stage and survival. (a) TMeF for 1434 pre-treatment plasma samples from CCGA substudy 3 participants with solid cancers is plotted against clinical stage. Points are colored gray if the sample’s TMeF was lower than the 98th percentile of TMeFs computed on a set of 1051 non-cancer samples to indicate that these TMeF values were less accurate. TMeF and stage correlated with a Spearman’s correlation of 0.65, p = 1.2 × 10−173. (b) In total, 1434 solid cancer participant plasma samples were stratified by their TMeF, and Kaplan–Meier plots of overall survival were generated for each stratified set of participants. Dashed lines depict the expected time-dependent overall survival based on SEER populations matched for sex, age, cancer type, and stage for each TMeF stratum. (c) The Cox proportional hazards model HRs and p-values were calculated for TMeF-stratified participant groups. Caveats of the model and associated HRs are described in the Results.

Similar articles

Cited by

References

    1. Jia B., Zhang X., Mo Y., Chen B., Long H., Rong T., Su X. The Study of Tumor Volume as a Prognostic Factor in T Staging System for Non-Small Cell Lung Cancer: An Exploratory Study. Technol. Cancer Res. Treat. 2020;19:1533033820980106. doi: 10.1177/1533033820980106. - DOI - PMC - PubMed
    1. Narod S.A. Tumour Size Predicts Long-Term Survival among Women with Lymph Node-Positive Breast Cancer. Curr. Oncol. 2012;19:249–253. doi: 10.3747/co.19.1043. - DOI - PMC - PubMed
    1. Dall’Olio F.G., Marabelle A., Caramella C., Garcia C., Aldea M., Chaput N., Robert C., Besse B. Tumour Burden and Efficacy of Immune-Checkpoint Inhibitors. Nat. Rev. Clin. Oncol. 2022;19:75–90. doi: 10.1038/s41571-021-00564-3. - DOI - PubMed
    1. Dawson S.-J., Tsui D.W.Y., Murtaza M., Biggs H., Rueda O.M., Chin S.-F., Dunning M.J., Gale D., Forshew T., Mahler-Araujo B., et al. Analysis of Circulating Tumor DNA to Monitor Metastatic Breast Cancer. N. Engl. J. Med. 2013;368:1199–1209. doi: 10.1056/NEJMoa1213261. - DOI - PubMed
    1. Eisenhauer E.A., Therasse P., Bogaerts J., Schwartz L.H., Sargent D., Ford R., Dancey J., Arbuck S., Gwyther S., Mooney M., et al. New Response Evaluation Criteria in Solid Tumours: Revised RECIST Guideline (Version 1.1) Eur. J. Cancer Oxf. Engl. 1990. 2009;45:228–247. doi: 10.1016/j.ejca.2008.10.026. - DOI - PubMed

Grants and funding

LinkOut - more resources