. 2023 Dec 23;16(1):89.
doi: 10.3390/cancers16010089.

Synergistic Suppression of NF1 Malignant Peripheral Nerve Sheath Tumor Cell Growth in Culture and Orthotopic Xenografts by Combinational Treatment with Statin and Prodrug Farnesyltransferase Inhibitor PAMAM G4 Dendrimers

Affiliations

Synergistic Suppression of NF1 Malignant Peripheral Nerve Sheath Tumor Cell Growth in Culture and Orthotopic Xenografts by Combinational Treatment with Statin and Prodrug Farnesyltransferase Inhibitor PAMAM G4 Dendrimers

John J Reiners Jr et al. Cancers (Basel). .

Abstract

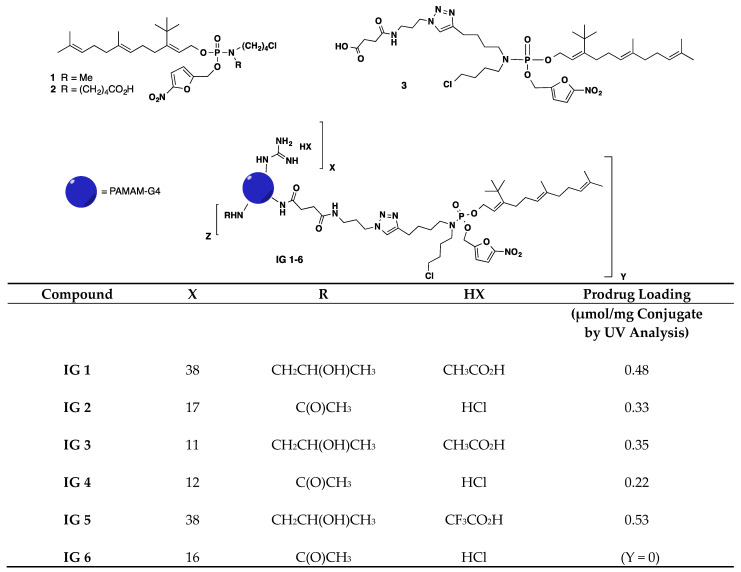
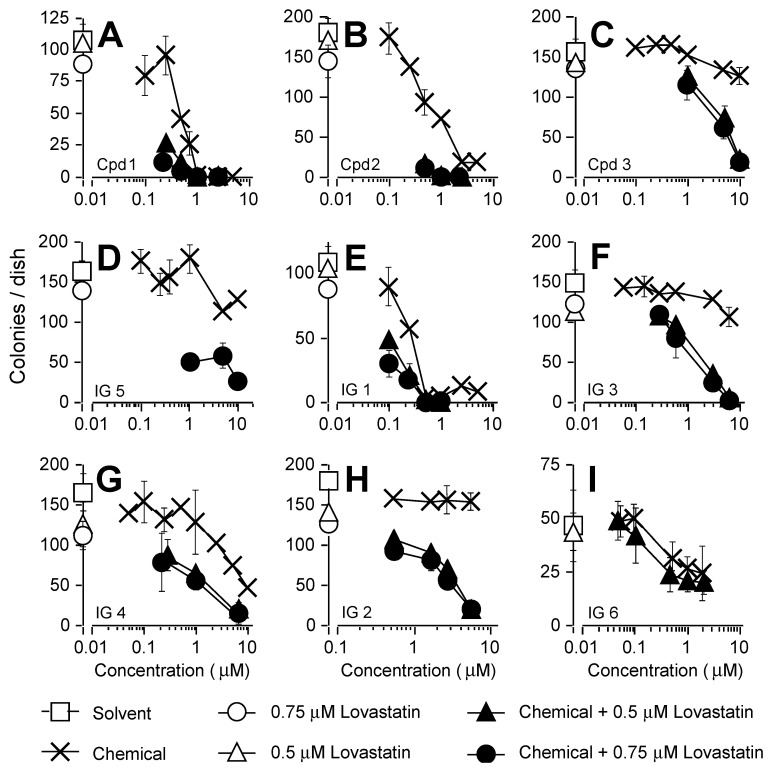
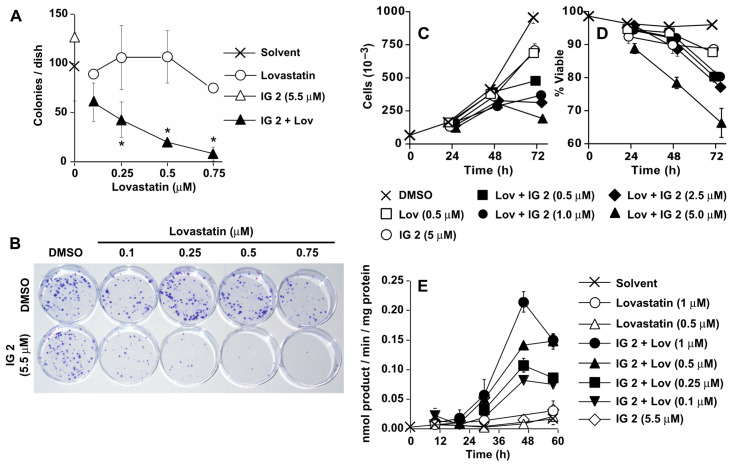
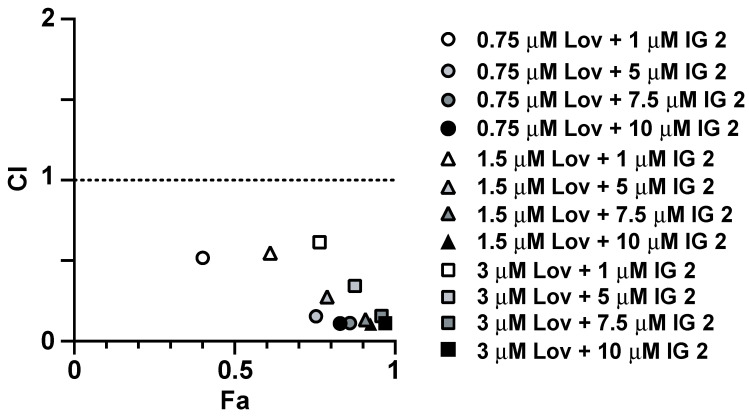
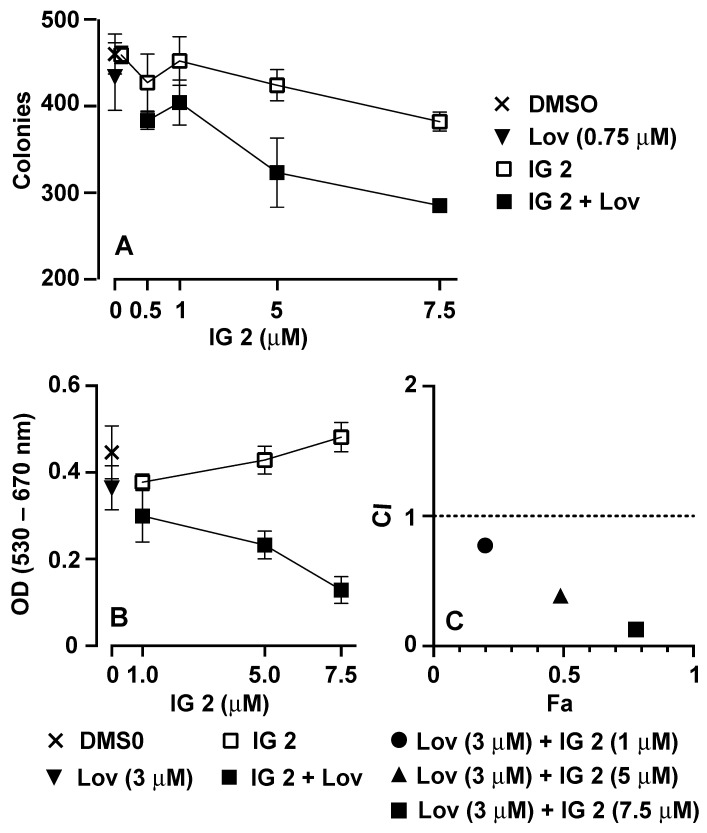
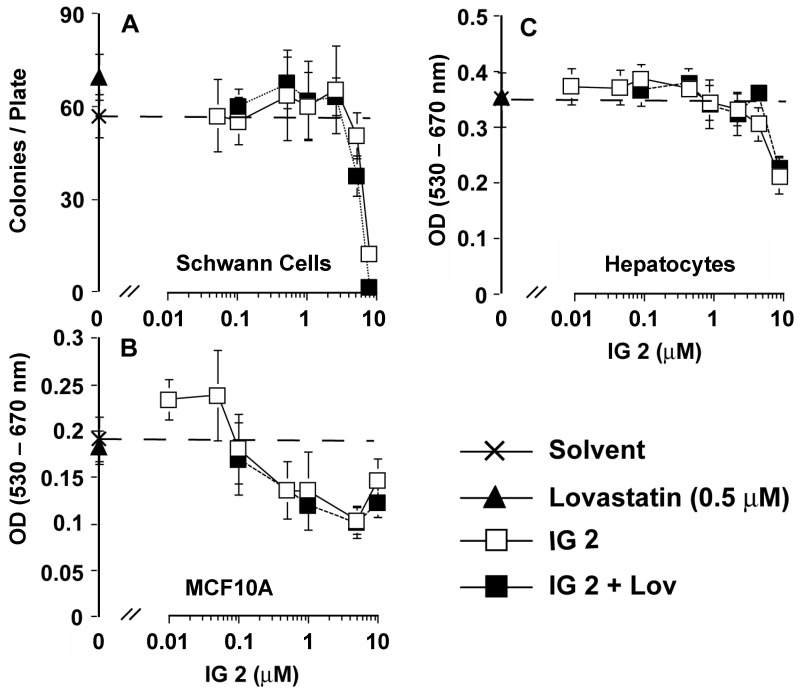
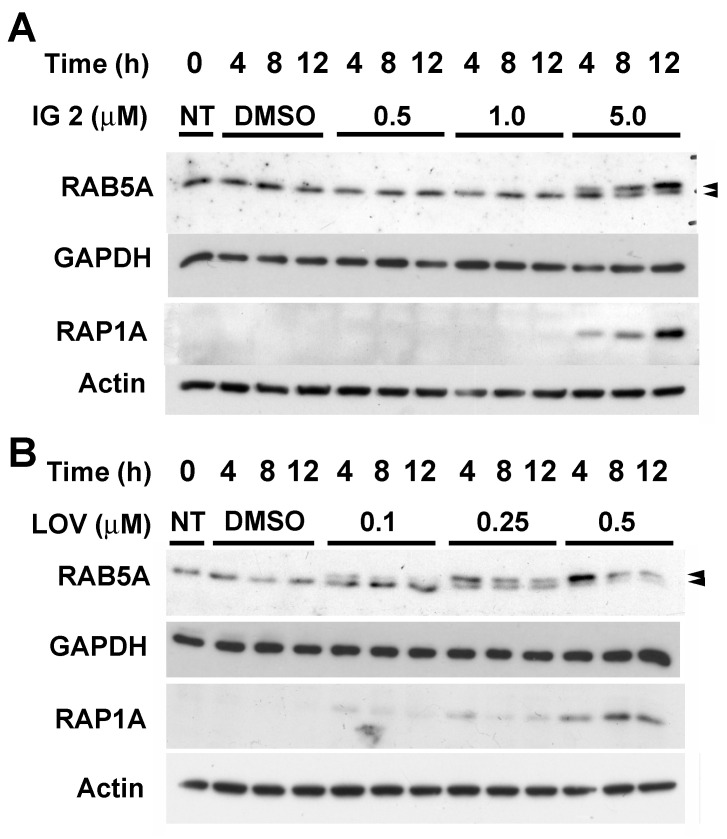
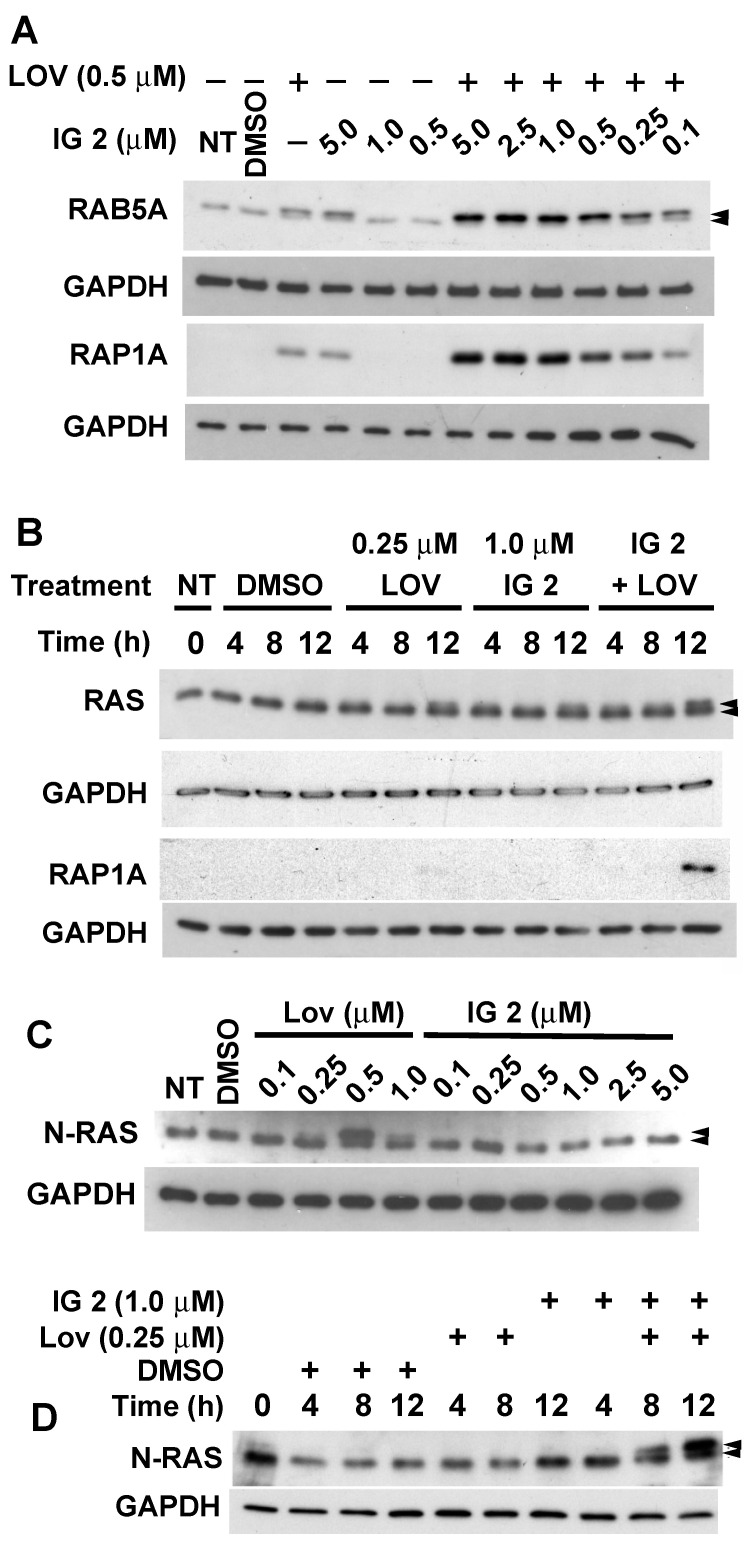
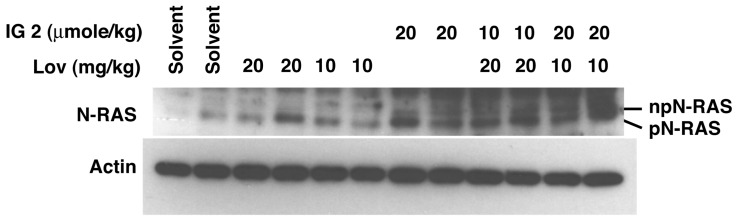
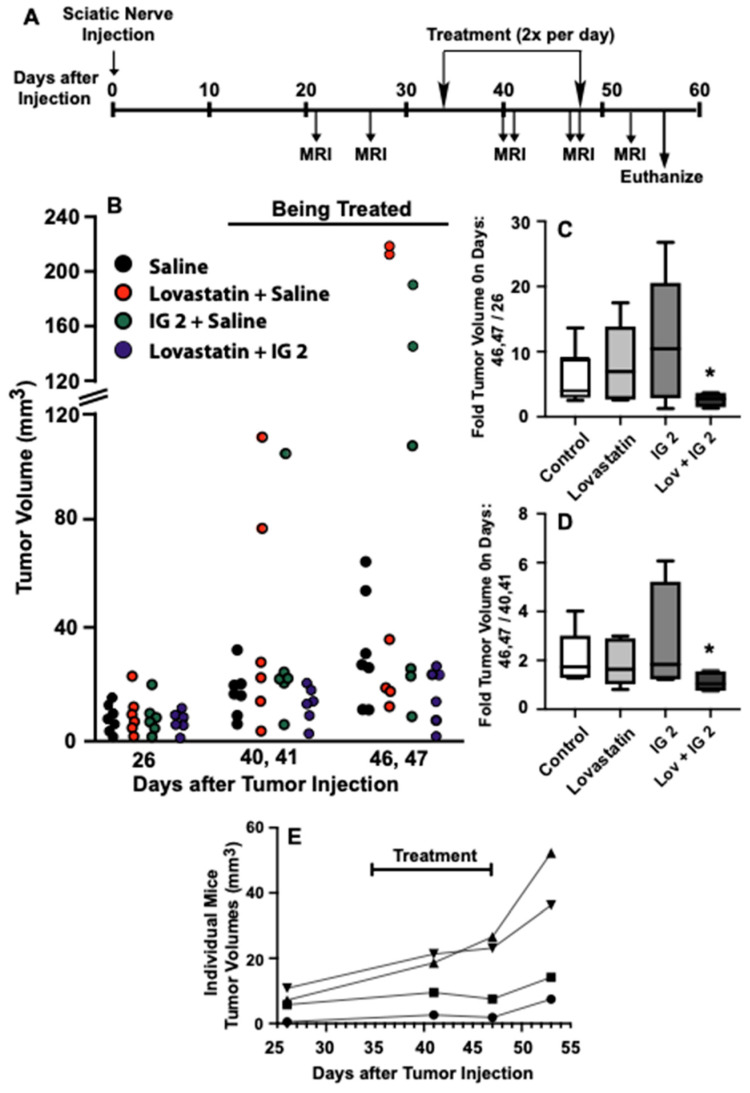
Neurofibromatosis type 1 (NF1) is a disorder in which RAS is constitutively activated due to the loss of the Ras-GTPase-activating activity of neurofibromin. RAS must be prenylated (i.e., farnesylated or geranylgeranylated) to traffic and function properly. Previous studies showed that the anti-growth properties of farnesyl monophosphate prodrug farnesyltransferase inhibitors (FTIs) on human NF1 malignant peripheral nerve sheath tumor (MPNST) cells are potentiated by co-treatment with lovastatin. Unfortunately, such prodrug FTIs have poor aqueous solubility. In this study, we synthesized a series of prodrug FTI polyamidoamine generation 4 (PAMAM G4) dendrimers that compete with farnesyl pyrophosphate for farnesyltransferase (Ftase) and assessed their effects on human NF1 MPNST S462TY cells. The prodrug 3-tert-butylfarnesyl monophosphate FTI-dendrimer (i.e., IG 2) exhibited improved aqueous solubility. Concentrations of IG 2 and lovastatin (as low as 0.1 μM) having little to no effect when used singularly synergistically suppressed cell proliferation, colony formation, and induced N-RAS, RAP1A, and RAB5A deprenylation when used in combination. Combinational treatment had no additive or synergistic effects on the proliferation/viability of immortalized normal rat Schwann cells, primary rat hepatocytes, or normal human mammary epithelial MCF10A cells. Combinational, but not singular, in vivo treatment markedly suppressed the growth of S462TY xenografts established in the sciatic nerves of immune-deficient mice. Hence, prodrug farnesyl monophosphate FTIs can be rendered water-soluble by conjugation to PAMAM G4 dendrimers and exhibit potent anti-tumor activity when combined with clinically achievable statin concentrations.

Keywords: MPNST; RAS prenylation; farnesyltransferase inhibitor; sciatic nerve.


Conflict of interest statement

The authors declare no conflict of interest.

Figures

Figure 1
Figure 1
Structures of prodrug farnesyl transferase inhibitors (FTIs), dendrimers, and prodrug FTI PAMAM G4 dendrimers.
Figure 2
Figure 2
Suppression of colony formation by prodrug FTIs (panels AC), prodrug FTI PAMAM G4 dendrimers (panels DH), and PAMAM G4 dendrimer lacking conjugated FTI (panel I). Overnight cultures of S462TY cells were treated with DMSO, 0.5 or 0.75 μM of lovastatin, or varied concentrations of a prodrug FTI, dendrimer, or prodrug FTI dendrimers. After four days of treatment, the cultures were washed and refed with fresh medium lacking any drugs. Cultures were fixed and stained 5 days later for assessment of colony formation. Treatments are noted in the figure legend. All data represent the means ± SD of 4–5 plates per treatment group. The data are representative of a minimum of 2 to 4 independent experiments.
Figure 3
Figure 3
Suppression of S462TY proliferation in culture by IG 2 and lovastatin co-treatment. In all panels, overnight cultures of S462TY cells were treated with DMSO, IG 2, lovastatin, or varied concentrations of lovastatin ± IG 2. Treatments and concentrations are noted in each panel. (A,B) After four days of treatment, cultures were washed and refed with fresh medium lacking any drugs. Cultures were fixed and stained 5 days later for colony counting (A) and photographing (B). The data in (A) represent the means ± SD of 4 plates per group and are representative of 3 independent experiments. * Significantly less than values for cultures treated with only solvent, lovastatin, or IG 2, p < 0.05. (C,D) Overnight cultures were treated as indicated and subsequently treated with trypsin at the indicated times for estimates of total cell count (C) and the percentage of trypan blue non-permeable (viable) cells (D). The percent of viable cells was calculated as the number of trypan blue impermeable cells divided by the sum of trypan blue permeable and non-permeable cells multiplied by 100. The data represent the means ± SD of 4 plates per treatment. (E) Overnight cultures were treated as indicated and harvested at varied times for analyses of DEVDase activities (measure of procaspase-3/7 activation). The data represent the means ± SD of triplicate analyses.
Figure 4
Figure 4
Synergistic inhibition of S462TY proliferation by combinational lovastatin plus IG 2 treatment. Overnight cultures of S462TY cells plated in 96-well culture plates were treated with six different concentrations of lovastatin and IG 2 for 48 h before being processed for MTT assays in order to establish concentration response curves. Based upon these data, three fixed concentrations of lovastatin (0.75, 1.5, and 3 μΜ) were incubated with varied concentrations of IG 2 (1, 5, 7.5, and 10 μM) for 48 h before being processed for MTT assays. The resulting data were used to construct CI vs. Fa plots. Data points below a CI value of 1 represent a synergistic interaction. MTT assays entailed 6–7 wells per treatment.
Figure 5
Figure 5
Synergistic inhibition of MPNST ST88-14 cell proliferation by combinational lovastatin and IG 2 treatment. In all panels, overnight cultures of ST88-14 cells were treated with DMSO, IG 2, lovastatin, or varied concentrations of lovastatin ± IG 2. Treatments and concentrations are noted in each panel. (A) After four days of treatment, cultures were washed and refed with fresh medium lacking any drugs. Cultures were fixed and stained 5 days later for colony counting. The data represent the means ± SD of 4 plates per group. (B) Overnight cultures in 96-well plates were treated as indicated for two days before being processed for MTT assays. (C) Overnight cultures plated in 96-well culture plates were treated with six different concentrations of lovastatin and IG 2 for 48 h before being processed for MTT assays in order to establish concentration response curves. Based upon these data, a fixed concentration of lovastatin (3 μM) was incubated with 1, 7.5, or 10 μM of IG 2 for 48 h before being processed for MTT assays. The resulting data were used to construct CI vs. Fa plots. Data points below a CI value of 1 represent synergism.
Figure 6
Figure 6
Effects of IG 2 and lovastatin co-treatment on the growth/viability of non-tumor cells. (A) Overnight cultures of immortalized, non-tumorigenic rat iSC cells were treated with DMSO, 0.5 μM of lovastatin, or varied concentrations of IG 2 ± lovastatin. After five days, the cultures were washed and refed with fresh medium. The cultures were subsequently refed a second time and harvested for staining and counting 3 days later. The data represent the means ± SD of 5 culture dishes per treatment group and are representative of two independent experiments. Cultures of human breast MCF10A epithelial cells (B) and primary rat liver hepatocytes (C) were treated as described in (A) and processed for MTT assays 48 h later. The data in panels (B,C) represent the means ± SD of 6 culture wells per treatment and are representative of two independent experiments with each cell type. The dashed line in the panels represents the value of the DMSO control.
Figure 7
Figure 7
Effects of IG 2 and lovastatin on RAB5A and RAP1A prenylation. Two-day-old S462TY cultures were left untreated or treated with DMSO or varied concentrations of either IG 2 (A) or lovastatin (B) before being harvested for western blot analyses of RAB5A and RAP1A. The antibody used for RAP1A detects the nonprenylated form of the protein. The upper of the two bands detected with anti-RAB5A represents non-prenylated RAB5A. Each lane contained 25 μg of protein. Similar results were obtained in a second independent experiment.
Figure 8
Figure 8
Combinational effects of IG 2 and lovastatin on prenylation. S462TY cultures were left untreated (NT) or treated with DMSO, fixed or varied concentrations of only lovastatin or IG 2, or combinations of lovastatin and IG 2, as indicated in the individual panels. Cultures were harvested 12 h after treatment (A,C) or at varied times after treatment (B,D) for subsequent western blot analyses of prenylation. The upper of the two bands detected with antibodies to pan-RAS, N-RAS, and RAB5A represent the non-prenylated protein. The antibody used for the identification of RAP1A recognizes only the non-prenylated protein. Each lane contained 25 μg of protein.
Figure 9
Figure 9
In vivo effects of lovastatin and IG 2 on N-Ras prenylation. Female Balb/c mice were treated twice a day, for 7 days, with i.p. plus i.v. injections of physiological saline, i.v. injections of physiological saline plus i.p. injections of 10 or 20 mg/kg of lovastatin, i.p. injections of physiological saline plus i.v. injections of 20 μmole/kg of IG 2, or i.p. injections of 10 or 20 mg/kg of lovastatin plus i.v. injections of 10 or 20 μmole/kg of IG 2. Mice were euthanized 6–8 h after the final treatment for harvesting of lung tissues and analyses of prenylated (pN-Ras) and non-prenylated N-Ras (npN-Ras). Each lane contains 25 μg of protein and represents tissue isolated from an individual mouse.
Figure 10
Figure 10
Suppression of S462TY sciatic nerve xenograft growth by combinational lovastatin and IG 2 treatment. (A) Diagram of the tumor treatment protocol. The left sciatic nerves of 25 female NOD SCID mice were injected with suspensions of S462TY cells at time zero. The xenograft’s development was monitored by MRI. Mice were treated twice a day by i.v. and i.p. with saline, or i.v. with 10 μmole/kg of IG 2 and i.p. with saline, or i.v. with saline and i.p. with 10 mg/kg of lovastatin, or i.v. with IG 2 and i.p. with lovastatin. (B) Volumes of individual sciatic nerve xenografts during different stages of the study. (C) Box plots of the ratios of individual tumor volumes at the end of treatment (days 46,47) by their volumes prior to treatment (day 26). * Significantly less than the control group, p < 0.05. (D) Box plots of the ratios of individual tumor volumes at the end of treatment (days 46,47) by their volumes halfway through treatment (days 40,41). * Significantly less than the control group, p < 0.05. (E) Tumor rebound in the IG 2 and lovastatin combinational treatment group following termination of treatment. The symbols identify 4 mice whose tumors were monitored over the time course.

Similar articles

References

    1. Friedman J.M. Epidemiology of neurofibromatosis type 1. Am. J. Med. Genet. 1999;89:1–6. doi: 10.1002/(SICI)1096-8628(19990326)89:1<1::AID-AJMG3>3.0.CO;2-8. - DOI - PubMed
    1. Arun D., Gutmann D.H. Recent advances in neurofibromatosis type 1. Curr. Opin. Neurol. 2004;17:101–105. doi: 10.1097/00019052-200404000-00004. - DOI - PubMed
    1. Lynch T.M., Gutmann D.H. Neurofibromatosis 1. Neurol. Clin. 2002;20:841–865. doi: 10.1016/S0733-8619(01)00019-6. - DOI - PubMed
    1. Perry A., Roth K.A., Banerjee R., Fuller C.E., Gutmann D.H. NF1 deletions in S-100 protein-positive and negative cells of sporadic and neurofibromatosis 1 (NF1)-associated plexiform neurofibromas and malignant peripheral nerve sheath tumors. Am. J. Pathol. 2001;159:57–61. doi: 10.1016/S0002-9440(10)61673-2. - DOI - PMC - PubMed
    1. Ward B.A., Gutmann D.H. Neurofibromatosis 1: From lab bench to clinic. Pediatr. Neurol. 2005;32:221–228. doi: 10.1016/j.pediatrneurol.2004.11.002. - DOI - PubMed