. 2023 Dec 25;16(1):115.
doi: 10.3390/cancers16010115.

Thymic Carcinoma: Unraveling Neuroendocrine Differentiation and Epithelial Cell Identity Loss

Affiliations

Thymic Carcinoma: Unraveling Neuroendocrine Differentiation and Epithelial Cell Identity Loss

Yosuke Yamada et al. Cancers (Basel). .

Abstract

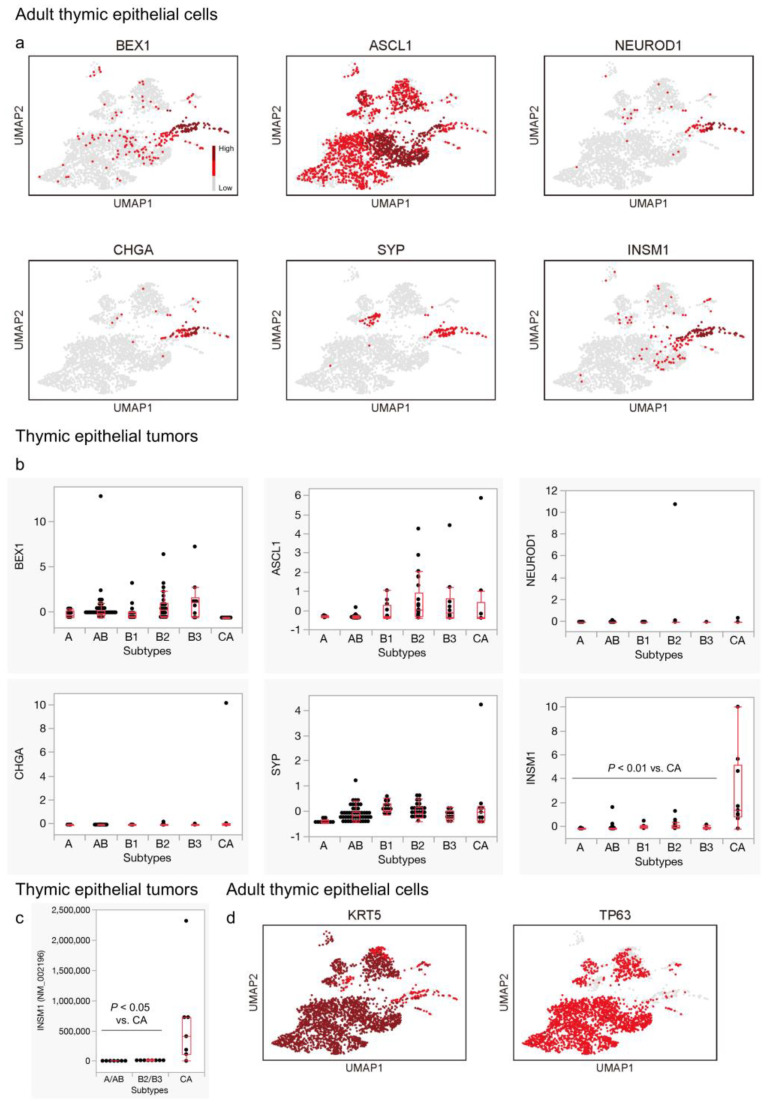
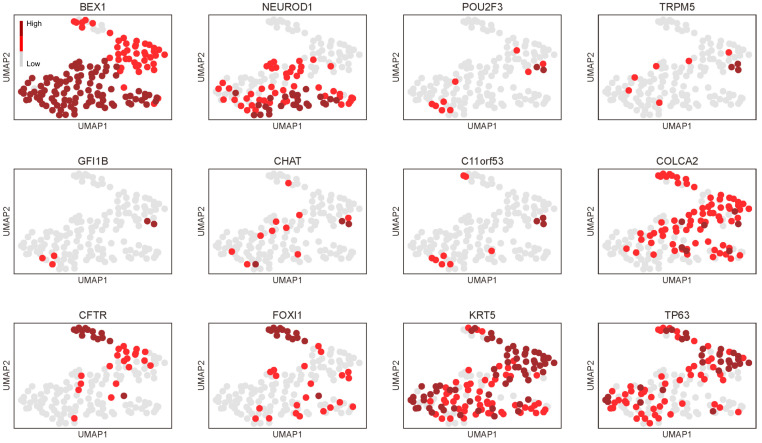
Background: The histogenesis of thymic epithelial tumors (TETs) has been a subject of debate. Recent technological advancements have revealed that thymic carcinomas often exhibit a phenotype akin to tuft cells, which is a subset of medullary TECs. Here, we further explored the gene expression signatures of thymic carcinomas in relation to tuft cells and their kinships-ionocytes and neuroendocrine cells (neuroendocrine group).

Methods: We analyzed a single-cell RNA sequencing dataset from the normal human thymus. Concurrently, we examined publicly available datasets on the mRNA expression and methylation status of TECs and lung cancers. Real-time quantitative PCR was also conducted with our tissue samples.

Results: Thymic carcinomas displayed a neuroendocrine phenotype biased toward tuft cells and ionocytes. When exploring the possible regulators of this phenotype, we discovered that HDAC9 and NFATC1 were characteristically expressed in the neuroendocrine group in adult TECs and thymic carcinomas. Additionally, the pan-thymic epithelium markers, exemplified by PAX9 and SIX1, were significantly suppressed in thymic carcinomas.

Conclusions: Thymic carcinomas might be characterized by unique neuroendocrine differentiation and loss of identity as thymic epithelial cells. Future studies investigating the role of HDAC9 and NFATC1 in thymic epithelium are warranted to explore their potential as therapeutic targets in TETs.

Keywords: HDAC9; NFATC1; PAX9; SIX1; ionocytes; neuroendocrine cells; thymic carcinoma; thymic epithelial tumors; thymoma; tuft cells.


Conflict of interest statement

The authors declare that they have no competing interest.

Figures

Figure 1
Figure 1
Profiling of human thymic epithelial cells. (a) Re-analysis of publicly available single-cell RNA sequencing (scRNA-seq) data reveals that the adult (N = 1, 25 years old) and postnatal (N = 2, both 10 months) thymic epithelial cells (TECs) can be categorized into 16 clusters. (b,c) However, the distribution of TECs (b), including those expressing POU2F3 (c), significantly differs between the postnatal and adult thymuses. (d) Adult TECs alone also can be separated into 16 clusters. (e) Each cluster was assigned to one of eight cell lineages, including cortical TECs (cTECs), immature TECs, medullary TECs, mTEC lo (low), mTEC hi (high), corneocyte-like, neuroendocrine, myoid, and myelin +, as originally described, based on the expression patterns of the marker genes [22]. The neuroendocrine group encompasses clusters 9 and 15 ((ae) Bautista et al., 2021 [22]. GSE1475220).
Figure 2
Figure 2
Expression of representative tuft cell- and ionocyte-related genes in adult thymic epithelial cells (TECs) and thymic epithelial tumors. (a) A subset of adult TECs expresses representative tuft cell markers (POU2F3, GFI1B, TRPM5, CHAT) and co-factors of POU2F3 (POU2AF2/C11orf53 and POU2AF3/COLCA2). TECs expressing these genes are predominantly found in a confined area, which is closely associated with cluster 9, especially adjacent to cluster 15. (b) Thymic carcinomas significantly upregulate POU2F3, POU2AF3, and POU2AF3 compared to thymomas (p < 0.05), except for POU2AF3 when compared to type B3 thymoma (p = 0.07, Wilcoxon test). (c) POU2AF3, POU2AF3, and representative ionocyte markers (FOXI1 and CFTR) are significantly upregulated in thymic carcinomas compared to thymomas in another dataset (p < 0.05, Wilcoxon test). (d) A subset of adult TECs expresses FOXI1 and CFTR and is enriched in cluster 9, partly overlapping with cells expressing most tuft cell markers. (e) Thymic carcinomas significantly upregulate FOXI1 compared to thymomas. Regarding CFTR, the thymic carcinoma shows almost a significant upregulation of this gene (p = 0.06, Wilcoxon test) when compared to type B1 thymoma, but not when compared to other thymoma subtypes ((a,d) Bautista et al., 2021 [22]. GSE1475220; (b,e) Thymoma, TCGA PanCancer Atlas [Y-axis: RNA-seq, mRNA Z score]; (c) Petrini et al., 2014 [34] [Y-axis: RNA-seq, fragments per kilobase of exon per million reads mapped, FPKM]).
Figure 2
Figure 2
Expression of representative tuft cell- and ionocyte-related genes in adult thymic epithelial cells (TECs) and thymic epithelial tumors. (a) A subset of adult TECs expresses representative tuft cell markers (POU2F3, GFI1B, TRPM5, CHAT) and co-factors of POU2F3 (POU2AF2/C11orf53 and POU2AF3/COLCA2). TECs expressing these genes are predominantly found in a confined area, which is closely associated with cluster 9, especially adjacent to cluster 15. (b) Thymic carcinomas significantly upregulate POU2F3, POU2AF3, and POU2AF3 compared to thymomas (p < 0.05), except for POU2AF3 when compared to type B3 thymoma (p = 0.07, Wilcoxon test). (c) POU2AF3, POU2AF3, and representative ionocyte markers (FOXI1 and CFTR) are significantly upregulated in thymic carcinomas compared to thymomas in another dataset (p < 0.05, Wilcoxon test). (d) A subset of adult TECs expresses FOXI1 and CFTR and is enriched in cluster 9, partly overlapping with cells expressing most tuft cell markers. (e) Thymic carcinomas significantly upregulate FOXI1 compared to thymomas. Regarding CFTR, the thymic carcinoma shows almost a significant upregulation of this gene (p = 0.06, Wilcoxon test) when compared to type B1 thymoma, but not when compared to other thymoma subtypes ((a,d) Bautista et al., 2021 [22]. GSE1475220; (b,e) Thymoma, TCGA PanCancer Atlas [Y-axis: RNA-seq, mRNA Z score]; (c) Petrini et al., 2014 [34] [Y-axis: RNA-seq, fragments per kilobase of exon per million reads mapped, FPKM]).
Figure 3
Figure 3
Expression of general neuroendocrine markers in adult thymic epithelial cells and thymic epithelial tumors. (a) General neuroendocrine markers, including BEX1, NEUROD1, CHGA, SYP, and INSM1, exhibit characteristic expression patterns in the neuroendocrine group among the adult thymuses. Surprisingly, ASCL1 shows broad expression across different cell types. (b) INSM1 displays significant upregulation in thymic carcinomas compared to thymomas (p < 0.01, Wilcoxon test), whereas the differences in expression of the other genes between thymic carcinomas and thymomas are less pronounced. (c) Higher expression of INSM1 in thymic carcinomas than in thymomas is consistent with the findings from another dataset (p < 0.05, Wilcoxon test). (d) The common squamous cell markers, KRT5 and TP63, are expressed in many adult thymic epithelial cells (TECs). Notably, TECs with a strong expression of general neuroendocrine markers (enriched in the upper half of cluster 9) tend to exhibit weaker KRT5 expression compared to other cells and do not express TP63 ((a,c) Bautista et al., 2021 [22]. GSE1475220; (b) Thymoma, TCGA PanCancer Atlas [Y-axis: RNA-seq, mRNA Z score]).
Figure 4
Figure 4
Profiling of adult thymic epithelial cells focusing on the neuroendocrine group with a higher resolution. Neuroendocrine cells (high in BEX1/NEUROD1), tuft cells (high in POU2F3 to C11ORF53/POU2AF2, and COLCA2/POU2AF3), and ionocytes (high in FOXI1/CFTR) can be distinctly identified. Neuroendocrine cells tend to exhibit a weaker expression of squamous cell markers (KRT5/TP63), whereas ionocytes retain their expression.
Figure 5
Figure 5
Expression of genes potentially regulating tuft cell development in adult thymic epithelial cells and thymic epithelial tumors. (a) Through a literature search, nine genes were identified as potential regulators of thymic tuft cell development: IL33, DHX9, LTBR, SOX4, HIPK2, IL4R, SIRT6, HDAC9, and FEZF2. HIPK2, SIRT6, HDAC9, and FEZF2 exhibit relatively selective expressions within the neuroendocrine group. (b) HIPK2, HDAC9, and FEZF2 are significantly upregulated in thymic carcinomas (HIPK2: p = 0.18 for type A vs. thymic carcinoma (CA); p < 0.05 for AB, B1, B2 vs. CA; p = 0.39 for B3 vs. CA; HDAC9: p < 0.05 for all thymoma subtypes vs. CA; FEZF2: p < 0.05 for type A, AB, B3 vs. CA; p = 0.08 for B1 vs. CA; p = 0.09 for B2 vs. CA, Wilcoxon test). (c) A higher expression of HIPK2, HDAC9, and FEZF2 was also observed in another dataset (HIPK2: p = 0.13 for type A/AB vs. CA; p = 0.12 for B2/B3 vs. CA; HDAC9: p = 0.25 for A/AB vs. CA; p = 0.77 for B2/B3 vs. CA; FEZF2: p < 0.05 for A/AB, B2/B3 vs. CA, Wilcoxon test). (d,e) The tuft cell-like subset does not exhibit a clear increase in HIPK2, HDAC9, and FEZF2 expressions compared to the non-tuft cell-like subset in small cell carcinomas (d) and large cell neuroendocrine carcinomas (e) of the lung ((a) Bautista et al., 2021 [22]. GSE1475220; (b) Thymoma, TCGA PanCancer Atlas [Y-axis: RNA-seq, Z score]; (c) Petrini et al., 2014 [34] [Y-axis: RNA-seq, FPKM]; (d) George et al., 2015 [35] [Y-axis: RNA-seq Z score]; (e) George et al., 2018 [37] [Y-axis: RNA-seq, FPKM]).
Figure 6
Figure 6
NFATC1 expression in thymic epithelial tumors and adult thymic epithelial cells. (a,b) NFATC1 exhibits significant expression in thymic carcinomas compared to thymomas in the TCGA dataset (p < 0.05, Wilcoxon test). (b,c) Similar trends are observed in another publicly available RNA-seq dataset and our quantitative real-time PCR (qPCR) with our own samples, although statistical significance is not reached. (d) NFATC1 is characteristically expressed in cluster 15, which is nearly identical to ionocytes. CD5-expressing cells are found in a distinct area within the neuroendocrine group ((a) Thymoma, TCGA PanCancer Atlas [Y-axis: RNA-seq, Z score]; (b) Petrini et al., 2014 [34] [Y-axis: RNA-seq, FPKM]; (c) qPCR with our sample; (d) Bautista et al., 2021 [22]. GSE1475220).
Figure 7
Figure 7
Expression of pan-thymic epithelium markers in thymic epithelial cells/tumors and the correlation with mRNA expression and methylation status of the genes of interest. (a) PAX9 and SIX1, which are general pan-thymic epithelium markers, are widely expressed in adult thymic epithelial cells (TECs), whereas FOXN1 expression is relatively limited. (b) The expressions of PAX9 and SIX1 are significantly suppressed in thymic carcinomas compared to thymomas (PAX9: p < 0.05 for type A, AB, B2, B3 vs. thymic carcinoma [CA], p = 0.17 for B1 vs. CA; SIX1: p < 0.05 for type A, AB, B3 vs. CA, p = 0.64 for B1 vs. CA, p = 0.05 for B2 vs. CA). The lower expression level in type B1 thymoma is likely because the majority of RNAs originated not from neoplastic epithelial cells but from the accompanying immature T cells. A significantly lower expression of FOXN1 in thymic carcinoma is not evident. (c) A lower expression of PAX9 and SIX1 in thymic carcinomas than in thymomas is consistent with the findings obtained from another dataset (p < 0.05, Wilcoxon test). (d) mRNA expression of genes that are significantly downregulated (PAX9 and SIX1) and upregulated (HDAC9, HIPK2, and NFATC1) is negatively correlated with their methylation proportion ((a) Bautista et al., 2021 [22] GSE1475220; (b) Thymoma, TCGA, PanCancer Atlas [Y-axis: RNA-seq, Z score]; (c) Petrini et al., 2014 [34] [Y-axis: RNA-seq, FPKM]; (d) Thymoma, TCGA, PanCancer Atlas and Thymoma, Firehose [X-axis: methylation proportion, Y-axis: RNA-seq, Z score, ρ values indicate Pearson’s correlation]).

Similar articles

Cited by

References

    1. Marino M., Müller-Hermelink H.K. Thymoma and thymic carcinoma. Relation of thymoma epithelial cells to the cortical and medullary differentiation of thymus. Virchows Arch. A Pathol. Anat. Histopathol. 1985;407:119–149. doi: 10.1007/BF00737071. - DOI - PubMed
    1. Yamada Y., Tomaru U., Ishizu A., Kiuchi T., Marukawa K., Matsuno Y., Kasahara M. Expression of proteasome subunit β5t in thymic epithelial tumors. Am. J. Surg. Pathol. 2011;35:1296–1304. doi: 10.1097/PAS.0b013e3182237f5d. - DOI - PubMed
    1. Tomaru U., Yamada Y., Ishizu A., Kuroda T., Matsuno Y., Kasahara M. Proteasome subunit β5t expression in cervical ectopic thymoma. J. Clin. Pathol. 2012;65:858–859. doi: 10.1136/jclinpath-2012-200820. - DOI - PubMed
    1. Yamada Y., Tomaru U., Ishizu A., Kiuchi T., Kasahara M., Matsuno Y. Expression of thymoproteasome subunit β5t in type AB thymoma. J. Clin. Pathol. 2014;67:276–278. doi: 10.1136/jclinpath-2013-201930. - DOI - PubMed
    1. Ströbel P., Hartmann E., Rosenwald A., Kalla J., Ott G., Friedel G., Schalke B., Kasahara M., Tomaru U., Marx A. Corticomedullary differentiation and maturational arrest in thymomas. Histopathology. 2014;64:557–566. doi: 10.1111/his.12279. - DOI - PubMed

LinkOut - more resources