. 2023 Dec 27;16(1):143.
doi: 10.3390/cancers16010143.

PI3Kδ Inhibition Potentiates Glucocorticoids in B-lymphoblastic Leukemia by Decreasing Receptor Phosphorylation and Enhancing Gene Regulation

Affiliations

PI3Kδ Inhibition Potentiates Glucocorticoids in B-lymphoblastic Leukemia by Decreasing Receptor Phosphorylation and Enhancing Gene Regulation

Jessica A O Zimmerman et al. Cancers (Basel). .

Abstract

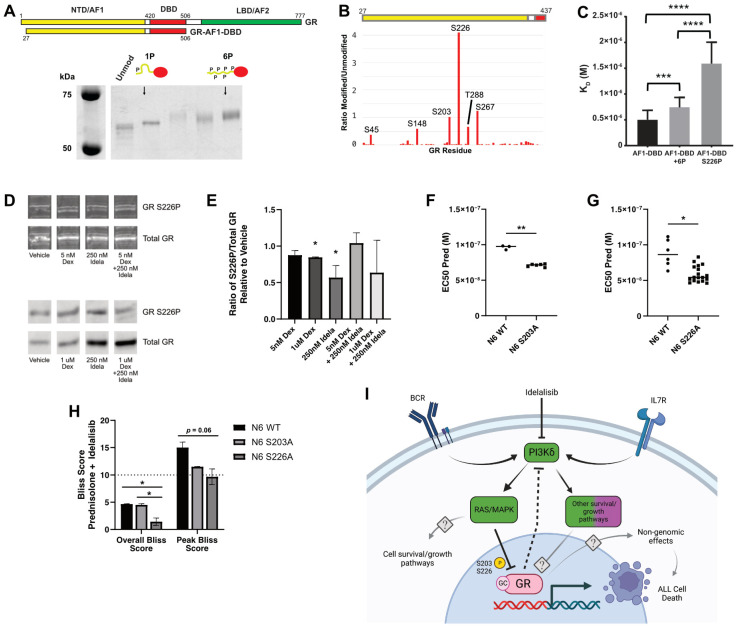
Glucocorticoids are the cornerstone of B-lymphoblastic leukemia (B-ALL) therapy. Because response to glucocorticoids alone predicts overall outcomes for B-ALL, enhancing glucocorticoid potency should improve treatment. We previously showed that inhibition of the lymphoid-restricted PI3Kδ with idelalisib enhances glucocorticoid activity in B-ALL cells. Here, we show that idelalisib enhances glucocorticoid potency in 90% of primary B-ALL specimens and is most pronounced at sub-saturating doses of glucocorticoids near the EC50. Potentiation is associated with enhanced regulation of all glucocorticoid-regulated genes, including genes that drive B-ALL cell death. Idelalisib reduces phosphorylation of the glucocorticoid receptor (GR) at PI3Kδ/MAPK1 (ERK2) targets S203 and S226. Ablation of these phospho-acceptor sites enhances sensitivity to glucocorticoids with ablation of S226 in particular reducing synergy. We also show that phosphorylation of S226 reduces the affinity of GR for DNA in vitro. We propose that PI3Kδ inhibition improves glucocorticoid efficacy in B-ALL in part by decreasing GR phosphorylation, increasing DNA binding affinity, and enhancing downstream gene regulation. This mechanism and the response of patient specimens suggest that idelalisib will benefit most patients with B-ALL, but particularly patients with less responsive, including high-risk, disease. This combination is also promising for the development of less toxic glucocorticoid-sparing therapies.

Keywords: chemotherapy; drug resistance; glucocorticoids; neoplasia-lymphoid leukemias; pediatric hematology/oncology.


Conflict of interest statement

J.A.O.Z. discloses spouse employment at Integrated DNA Technologies. The remaining authors declare no competing financial interests.

Figures

Figure 1
Figure 1
Prednisolone and idelalisib synergistically induce cell death in B-ALL cell lines and primary patient specimens in vitro. Evaluation of synergy in (A) NALM6 cells and (B) RS4;11 cells treated with the combination of prednisolone and idelalisib. A Bliss score greater than 10 indicates synergy, 10 to −10 indicates additivity, and less than −10 indicates antagonism. Overall Bliss score is at the top of each plot, and the peak Bliss score from the black outlined area is given in the box at the top right corner of each plot. Horizontal dashed line indicates the EC50 for prednisolone. (C) Correlations (Pearson coefficient R) of prednisolone AUC for patient specimens, NALM6, and RS4;11 cells with overall Bliss score (top) and peak Bliss score (bottom) demonstrate a trend toward decreased prednisolone sensitivity correlating with increased synergy with idelalisib, although neither has a p ≤ 0.05. (DG) Overall (black bars) and peak (pink bars) Bliss scores for the combination treatment of prednisolone plus idelalisib in (D) NCI standard-risk specimens, (E) NCI high-risk specimens, (F) infant specimens, and (G) a relapsed specimen do not reveal an association between synergy and risk grouping or cytogenetic features. Cytogenetic features of these specimens are favorable/fav (ETV6::RUNX1 or double trisomy), unfavorable/unfav (KMT2A rearrangement, iAMP21, or hypodiploidy), Ph-like (P2RY8::CRLF2), or neutral (all other cytogenetic features).
Figure 2
Figure 2
Idelalisib enhances dexamethasone regulation of effector genes in NALM6 cells. (A) The numbers of genes up- and downregulated (p ≤ 0.01) for NALM6 cells treated with combinations of dexamethasone (dex) and idelalisib (idela) for 24 h. (B) The log2 fold change in genes regulated by 5 nM dexamethasone is enhanced by idelalisib (left), whereas the enhancement by idelalisib at 50 nM dexamethasone (right) is less pronounced for most genes. The linear regression fit is a black line compared to the red line for no effect. (C) Box plots of upregulation (left) and downregulation (right) by 5 nM dexamethasone show significantly enhanced regulation by the addition of idelalisib. (D) Plot of the effect of each gene on dex-sensitivity (x-axis) versus regulation by 50 nM dexamethasone (y-axis). Positive effector (purple) and negative effector (green) genes are those whose regulation contributes to dex-induced NALM6 cell death, whereas buffering genes (yellow) oppose dex-induced cell death. (E) The log2 fold change of effector genes in response to combinations of dexamethasone and idelalisib. The vertical red line depicts no change in expression (log2FC = 0). In 2B and 2C, R = Pearson correlation coefficient. Idelalisib concentration is 250 nM in all experiments.
Figure 3
Figure 3
Idelalisib enhances glucocorticoid-induced gene regulation in primary patient specimens. (A) Overall number of genes upregulated (red) and downregulated (blue) in five glucocorticoid-sensitive primary patient specimens treated with idelalisib only (idela), prednisolone only (pred), prednisolone + idelalisib (pred + idela), dexamethasone only (dex), or dexamethasone + idelalisib (dex + idela). (B) Box plots of upregulation (left) and downregulation (right) in five glucocorticoid-sensitive specimens treated with dex vs. dex + idela. (C) Box plots of upregulated (left) and downregulated (right) genes in five glucocorticoid-sensitive specimens treated with pred vs. pred + idela. (D) Overall number of genes regulated in two primary patient specimens with an additive response (MAP014 Bliss score 3 and MAP031 Bliss score −5) to combination pred + idela treatment in viability assays at the concentrations used for RNA-seq. (E) Box plots of upregulated (left) and downregulated (right) genes in the two additive specimens treated with dex vs. dex + idela. (F) Box plots of upregulated (left) and downregulated (right) genes in the two additive specimens treated with pred vs. pred + idela. (G) Overall number of genes regulated in two primary patient specimens with a synergistic response (MAP015 Bliss score 22 and MAP019 Bliss score 14) to combination pred + idela treatment in viability assays at the concentrations used for RNA-seq. (H) Box plots of upregulated (left) and downregulated (right) genes in the two synergistic specimens treated with dex vs. dex + idela. (I) Box plots of upregulated (left) and downregulated (right) genes in the two synergistic specimens treated with pred vs. pred + idela. For all box plots, p-values for paired t-tests are reported.
Figure 4
Figure 4
Phosphorylation of GR at S226 inhibits DNA binding, decreases phosphorylation of GR, and increases glucocorticoid sensitivity. (A) Purified GR-AF1-DBD was expressed and phosphorylated with ERK2 (NTD/AF1 = N-terminal domain/activation function 1, DBD = DNA binding domain, LBD = ligand binding domain/activation function 2). Phosphorylated species of GR-AF1-DBD were separated by strong anion exchange, isolating species with primarily one (1P) and six (6P) phosphates. (B) Mass spectrometry of phosphorylated GR-AF1-DBD-6P maps phosphorylation at six residues after ERK2 phosphorylation and isolation of GR-6P, including S203, with S226 being the most prevalent. (C) Unmodified GR-AF1-DBD binds with higher affinity than 6P. GR-1P (S226P) binding is more strongly inhibited. Dissociation constants (KD) were measured by electrophoretic mobility shift assays. Adjusted p-values from one-way ANOVA are 0.0036 (***) and <0.0001 (****). (D) Bands from representative Western blots illustrating phosphorylated S226 of GR in NALM6 cells treated with vehicle, dexamethasone (Dex) only, idelalisib (Idela) only, and dexamethasone with idelalisib (Dex + Idela) for 24 h. Both low-dose dexamethasone (5 nM, top) and high-dose dexamethasone (1 μM, bottom) were used. Phosphorylated S226 and total GR were blotted on the same membrane for each set of treatment conditions. (E) Quantification of the ratio of phosphorylated S226 to total GR normalized to vehicle control. Two biological replicates were performed for each condition except for idelalisib alone, which had 4 biological replicates. Phosphorylation of S226 is significantly reduced with both 1 μM Dex (p = 0.02) and 250 nM Idela (p = 0.01) compared to a normalized ratio of 1. (F) EC50 of prednisolone for CRISPR mutants with GR S203A compared to wild-type (WT) NALM6 cells. Two GR S203A clones were evaluated, with 3 biological replicates for each cell type. Welch’s t test p = 0.0010 (**). (G) EC50 of prednisolone for CRISPR mutants with GR S226A compared to wild-type (WT) NALM6 cells. Three GR S226A clones were evaluated, with 3 biological replicates per cell type. Welch’s t test p = 0.0111 (*). (H) Overall, Bliss scores for NALM6 S226A mutants are significantly decreased compared to WT NALM6 cells (*, p = 0.04) and NALM6 S203A mutants (*, p = 0.04). Peak Bliss scores for NALM6 S226A are decreased compared to NALM6 WT but not statistically significant (p = 0.06). NALM6 S203A mutants are not significantly different from NALM6 WT for either overall or peak Bliss scores. Bliss scores above 10 (dashed line) are considered synergistic. (I) Working model of idelalisib-induced glucocorticoid potentiation, where idelalisib inhibits PI3Kδ and subsequently reduces the inhibitory phosphorylation of GR at S226. BCR = B-cell receptor. IL7R = interleukin 7 receptor. GR = glucocorticoid receptor. GC = glucocorticoid. Created with BioRender.com.

Update of

Similar articles

References

    1. National Cancer Institute SEER Cancer Stat Facts: Childhood Leukemia. [(accessed on 3 October 2023)]; Available online: https://seer.cancer.gov/statfacts/html/childleuk.html.
    1. Dordelmann M., Reiter A., Borkhardt A., Ludwig W.D., Gotz N., Viehmann S., Gadner H., Riehm H., Schrappe M. Prednisone response is the strongest predictor of treatment outcome in infant acute lymphoblastic leukemia. Blood. 1999;94:1209–1217. doi: 10.1182/blood.V94.4.1209. - DOI - PubMed
    1. Schrappe M., Arico M., Harbott J., Biondi A., Zimmermann M., Conter V., Reiter A., Valsecchi M.G., Gadner H., Basso G., et al. Philadelphia chromosome-positive (Ph+) childhood acute lymphoblastic leukemia: Good initial steroid response allows early prediction of a favorable treatment outcome. Blood. 1998;92:2730–2741. - PubMed
    1. de Vries M.A.G., van Litsenburg R.R.L., Huisman J., Grootenhuis M.A., Versluys A.B., Kaspers G.J.L., Gemke R.J.B.J. Effect of dexamethasone on quality of life in children with acute lymphoblastic leukaemia: A prospective observational study. Health Qual. Life Outcomes. 2008;6:103. doi: 10.1186/1477-7525-6-103. - DOI - PMC - PubMed
    1. Pound C.M., Clark C., Ni A., Athale U., Lewis V., Halton J.M. Corticosteroids, Behavior, and Quality of Life in Children Treated for Acute Lymphoblastic Leukemia; A Multicentered Trial. J. Pediatr. Hematol. Oncol. 2012;34:517–523. doi: 10.1097/MPH.0b013e318257fdac. - DOI - PubMed

LinkOut - more resources