. 2023 Dec 29;16(1):183.
doi: 10.3390/cancers16010183.

EBP50 Depletion and Nuclear β-Catenin Accumulation Engender Aggressive Behavior of Colorectal Carcinoma through Induction of Tumor Budding

Affiliations

EBP50 Depletion and Nuclear β-Catenin Accumulation Engender Aggressive Behavior of Colorectal Carcinoma through Induction of Tumor Budding

Takashi Itou et al. Cancers (Basel). .

Abstract

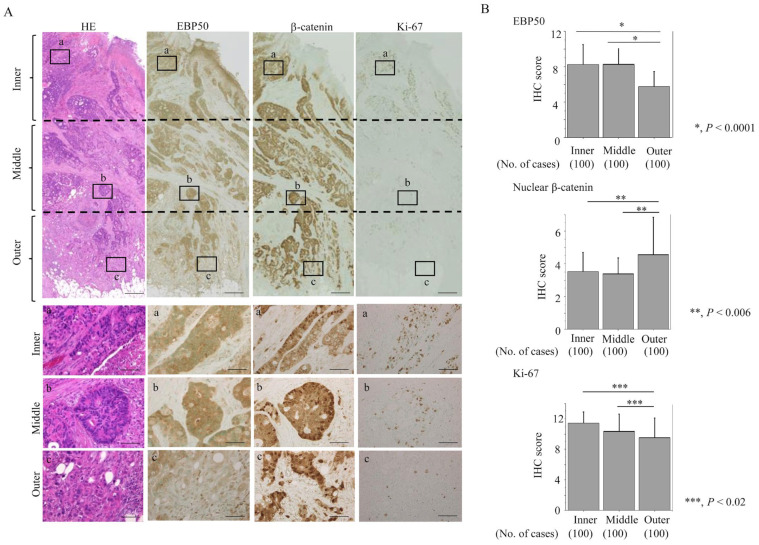
Ezin-radixin-moesin-binding phosphoprotein 50 (EBP50) is a scaffold protein that interacts with several partner molecules including β-catenin. Here, we examined the crosstalk between EBP50 and nuclear catenin during colorectal carcinoma (CRC) progression. In clinical samples, there were no correlations between the subcellular location of EBP50 and any clinicopathological factors. However, EBP50 expression was significantly lower specifically in the outer areas of tumor lesions, in regions where tumor budding (BD) was observed. Low EBP50 expression was also significantly associated with several unfavorable prognostic factors, suggesting that EBP50 depletion rather than its overexpression or subcellular distribution plays an important role in CRC progression. In CRC cell lines, knockout of EBP50 induced epithelial-mesenchymal transition (EMT)-like features, decreased proliferation, accelerated migration capability, and stabilized nuclear β-catenin due to disruption of the interaction between EBP50 and β-catenin at the plasma membrane. In addition, Slug expression was significantly higher in outer lesions, particularly in BD areas, and was positively correlated with nuclear β-catenin status, consistent with β-catenin-driven transactivation of the Slug promoter. Together, our data suggest that EBP50 depletion releases β-catenin from the plasma membrane in outer tumor lesions, allowing β-catenin to accumulate and translocate to the nucleus, where it transactivates the Slug gene to promote EMT. This in turn triggers tumor budding and contributes to the progression of CRC to a more aggressive phase.

Keywords: EBP50; colorectal carcinoma; tumor budding; β-catenin.


Conflict of interest statement

The authors declare no conflicts of interest.

Figures

Figure 1
Figure 1
EBP50 depletion in BD areas of outer lesions: (A) Staining with HE and IHC for the indicated proteins in tumor budding (BD) and non-BD areas in outer lesions. Note the decreased immunoreactivity for EBP50 and Ki-67 (indicated by arrowheads) in BD areas, in contrast to the increased nuclear β-catenin accumulation (indicated by arrowheads). The closed boxes in upper panels are magnified in insets. Original magnification, ×100 and ×400 (insets). Scale bar = 50 μm and 10 μm. (B) IHC scores for the indicated proteins between BD and non-BD areas in outer lesions. The scores shown are means ± SDs. Statistical analyses were carried out using the Mann–Whitney U-test. No., number. (C) Double immunofluorescence analysis for the indicated proteins in BD and non-BD areas in outer lesions. Note the membranous staining of EBP50 (indicated by arrowheads: non-BD area in membranous EBP50 type) and the nuclear β-catenin accumulation (indicated by arrowheads: BD areas in membranous and cytoplasmic EBP50 type). Closed boxes (a,b) in the upper panels are magnified in the middle (a) and lower panels (b). Original magnification, ×100 and ×400 (insets). Scale bar = 50 μm and 10 μm.
Figure 2
Figure 2
EBP50 depletion in outer lesions of CRC: (A) Staining with HE and IHC for the indicated proteins. Note the decreased immunoreactivity for EBP50 and Ki-67 in outer lesions as compared to inner and middle areas, in contrast to the increased nuclear β-catenin accumulation in the former. Closed boxes (a,b,c) in the upper panels are magnified in the lower panels (a,b,c). Original magnification, ×2 and ×200 (lower three panels). Scale bar = 10 μm (upper three panels) and 50 μm (lower three panels). (B) IHC scores for the indicated proteins in inner, middle, and outer lesions. The scores shown are means ± SDs. Statistical analyses were carried out using the Mann–Whitney U-test. No., number.
Figure 3
Figure 3
Changes in morphology and proliferation following EBP50 knockout in CRC cells: (A) Upper: phase contrast images of EBP50-KO#30 cells, revealing switch towards a fibroblastic morphology. Scale bar = 30 μm. Lower: ratios of long (‘a’ in upper panels) and short (‘b’ in upper panels) diameters in cells. The values shown are means ± SDs. Statistical analyses were carried out using the Mann–Whitney U-test. No., number. (B) Upper: EBP50-KO#30 and mock cells were seeded at low density. Cell numbers are presented as means ± SDs. P0, P3, P6, and P9 are 0, 3, 6, and 9 days after seeding, respectively. The experiments were performed in triplicate. Statistical analyses were carried out using the Mann–Whitney U-test. Lower: flow cytometry analysis of EBP50-KO#30 and mock cells 3 days after seeding (P3). (C) Western blot analysis for the indicated proteins in total lysates from EBP50-KO#30 and mock cells following re-stimulation of serum-starved (24 h) cells with 10% serum for the indicated times. The uncropped blots are shown in File S1.
Figure 4
Figure 4
Changes in migration but not cancer stem cell properties in EBP50-KO cells: (A) Upper: EBP50-KO and mock cells were seeded in 24-well Transwell plates and incubated for 24 h in medium without serum. Cells (indicated by arrows) were stained with HE and counted using a light microscope. Lower: numbers of migrated cells are presented as means ± SDs. The experiments were performed in triplicate. Statistical analyses were carried out using the Mann–Whitney U-test. Scale bar = 30 μm. (B) Upper: wound-healing assay with EBP50-KO#30 and mock cells. A scratch ‘wound’ was introduced to the middle of wells containing cells grown to confluency, and phase contrast images were taken after 20 h. Scale bar = 50 μm. Lower: the values of wound areas at 0 h were set as 1. The fold wound areas are presented as means ± SDs. The experiments were performed in triplicate. Statistical analyses were carried out using the Mann–Whitney U-test. #30, EBP50-KO#30. (C) Western blot analysis for the indicated proteins in total lysates from EBP50-KO#30 and mock cells. The experiments were performed in duplicate. The uncropped blots are shown in File S1. (D) Aldefluor analysis in EBP50-KO#50 and mock cells. Region R1 includes the ALDHhigh population with cancer-stem-cell-like features. The experiments were performed in triplicate. (E) Upper: phase contrast photographs of spheroids formed by EBP50-KO#30 and mock cells following 2 weeks of growth. Scale bar = 50 μm. Lower: spheroid numbers are presented as means ± SDs. The experiments were performed in triplicate. Statistical analyses were carried out using the Mann–Whitney U-test.
Figure 5
Figure 5
Interaction between EBP50 and β-catenin in CRC cells: (A) Western blot (WB) with anti-β-catenin (upper panel), anti-FLAG (middle panel), and anti-EBP50 antibodies (lower panel) after immunoprecipitation (IP) with the indicated antibodies using HCT116 cell lysates. Input represents 5% of the total cell extract. Normal mouse IgG was used as a negative control. (B) Schematic representation of the cytosolic PSD-95/Drosophila discs large/ZO-1 (PDZ) and EB domains of EBP50. (C) Upper: proteins bound to the beads were analyzed followed by Western blot analysis for β-catenin in HCT116 cells. Lower: detection of GST-bound EBP protein by Coomassie Brilliant Blue (CBB). The experiments were performed in duplicate. (D) Double immunofluorescence analysis for the indicated proteins. Note the nuclear β-catenin accumulation (indicated by arrows) in EBP50-KO#30 cells (upper panels), in contrast to colocalization of EBP50 and β-catenin at membranous sites in mock cells (lower panels). Scale bar = 20 μm. (E) Numbers of cells with nuclear β-catenin accumulation are presented as means ± SDs. The experiments were performed in triplicate. Statistical analyses were carried out using the Mann–Whitney U-test. (F) Western blot analysis for the indicated proteins in cytoplasmic (Cyt), membranous (Me), nuclear (Nu), and cytoskeletal fractions (Skel). Ratios of β-catenin relative to β-actin are calculated using ImageJ version 1.41. The uncropped blots are shown in File S1.
Figure 6
Figure 6
Relationship between Slug and β-catenin expression in BD areas of outer lesions: (A) Upper: staining with HE and IHC for the indicated proteins in CRC. Note the increased immunoreactivity for nuclear β-catenin and Slug in BD areas. The closed boxes are magnified in the insets. Original magnification, ×100 and ×400 (insets). Scale bar = 50 μm and 10 μm (insets). Lower: double immunofluorescence analysis for the indicated proteins. Red, cytoplasmic or membranous EBP50 expression; Blue, membranous beta-catenin; Brawn, nuclear beta-catenin. Note the colocalization of nuclear β-catenin and Slug in BD areas (indicated by arrows). The closed boxes are magnified in the insets. Original magnification, ×100 and ×400 (insets). Scale bar = 50 μm and 10 μm (insets). (B) IHC scores for Slug in the inner, middle, and outer lesions. The scores shown are means ± SDs. Statistical analyses were carried out using the Mann–Whitney U-test. No., number. (C) HCT116 cells were transfected with Slug promoter constructs, together with β-catenin and p300. Relative activity was determined based on arbitrary light units of luciferase activity normalized to pRL-TK activity. The activities of the reporter plus the effector relative to that of the reporter plus empty vector are shown as means ± SDs. The experiments were performed in triplicate. (D) Schematic representation of the interplay between EBP50 and nuclear (Nu) β-catenin during CRC progression. Me, membranous, Cyt, cytoplasmic, Nu, nuclear, BD, tumor budding, EMT, epithelial–mesenchymal transition.

Similar articles

Cited by

References

    1. Onyoh E.F., Hsu W.-F., Chang L.-C., Lee Y.-C., Wu M.-S., Chiu H.-M. The Rise of colorectal cancer in Asia: Epidemiology, screening, and management. Curr. Gastroenterol. Rep. 2019;21:36. doi: 10.1007/s11894-019-0703-8. - DOI - PubMed
    1. Koo J.H., Leong R.W., Ching J., Yeoh K.-G., Wu D.-C., Murdani A., Cai Q., Chiu H.-M., Chong V.H., Rerknimitr R., et al. Knowledge of attitudes toward, and barriers to participation of colorectal cancer screening tests in the Asia-Pacific region: A multicenter study. Gastrointest. Endosc. 2012;76:126–135. doi: 10.1016/j.gie.2012.03.168. - DOI - PubMed
    1. Wong M.C., Ding H., Wang J., Chan P.S., Huang J. Prevalence and risk factors of colorectal cancer in Asia. Intest. Res. 2019;17:317–329. doi: 10.5217/ir.2019.00021. - DOI - PMC - PubMed
    1. Donowitz M., Cha B., Zachos N.C., Brett C.L., Sharma A., Tse C.M., Li X. NHERF family and NHE3 regulation. Pt 1J. Physiol. 2005;567:3–11. doi: 10.1113/jphysiol.2005.090399. - DOI - PMC - PubMed
    1. Viswanatha R., Bretscher A., Garbett D. Dynamics of ezrin and EBP50 in regulating microvilli on the apical aspect of epithelial cells. Biochem. Soc. Trans. 2014;42:189–194. doi: 10.1042/BST20130263. - DOI - PMC - PubMed