. 2023 Dec 20;16(1):19.
doi: 10.3390/nu16010019.

The Impact of Diet and Physical Activity on Fat-to-Lean Mass Ratio

Affiliations

The Impact of Diet and Physical Activity on Fat-to-Lean Mass Ratio

Elvira Padua et al. Nutrients. .

Abstract

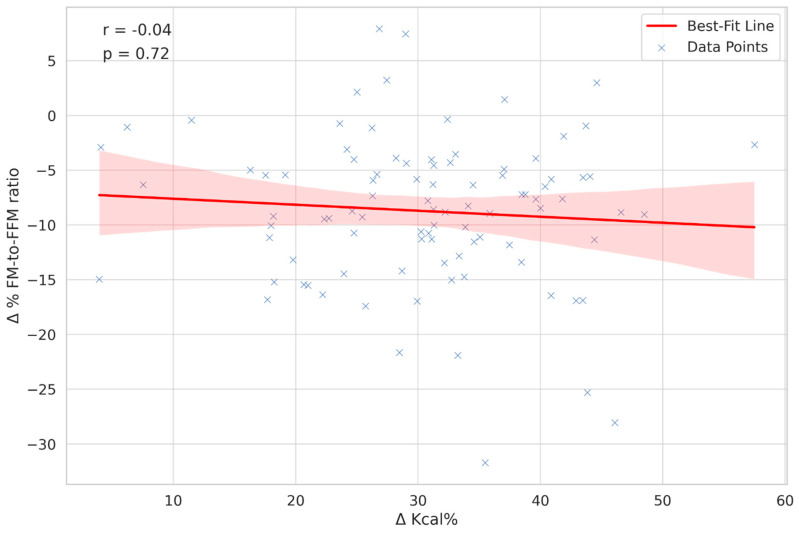
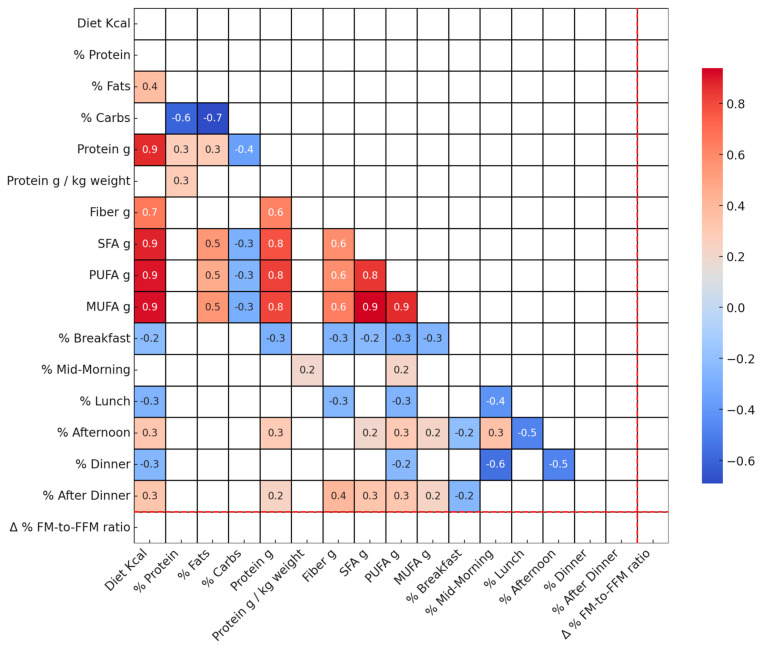
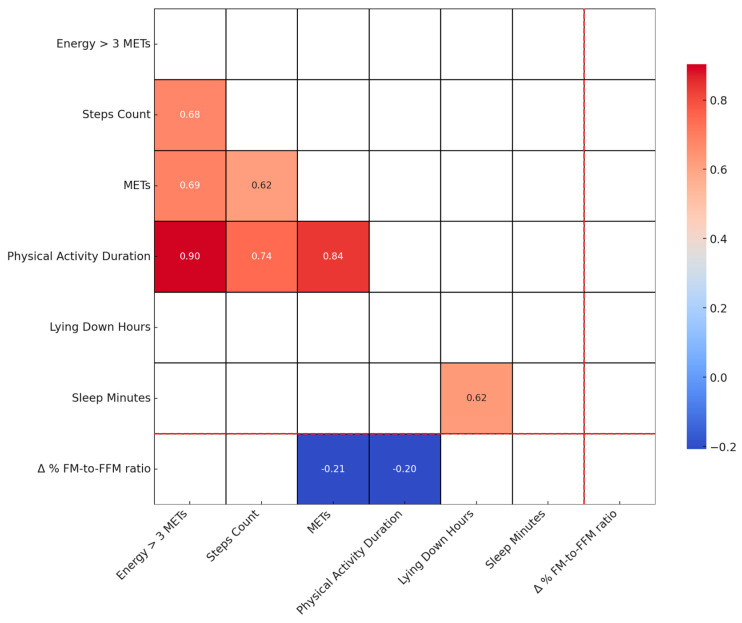
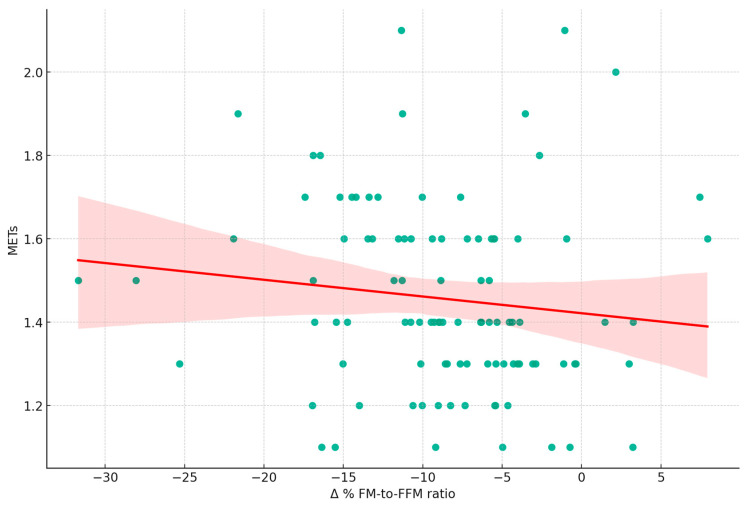
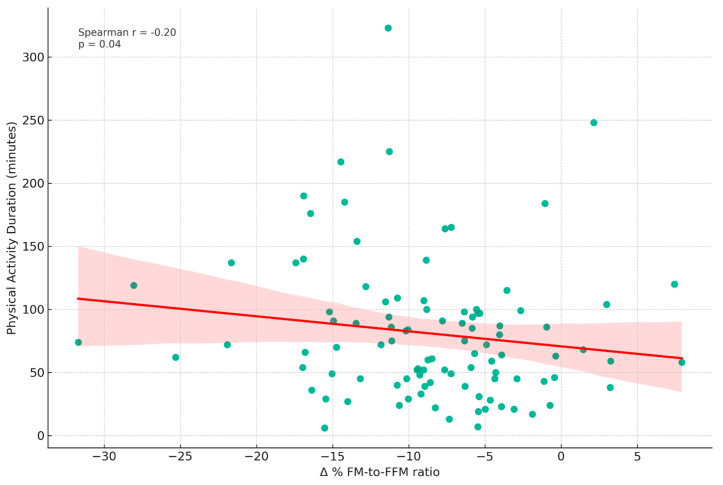
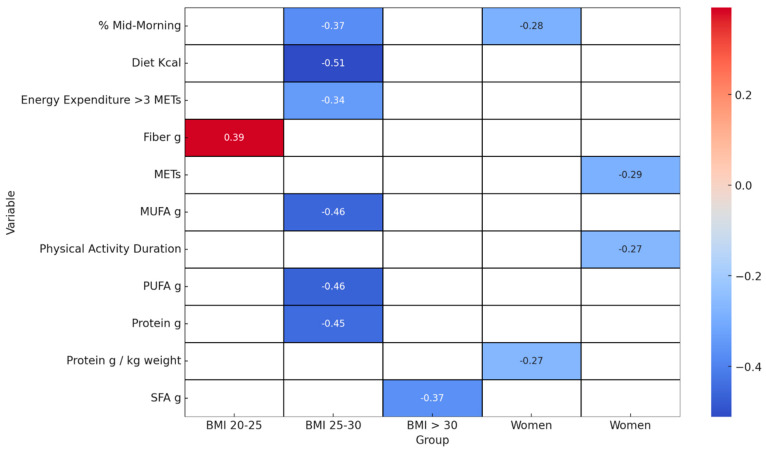
In this retrospective study, we evaluated the efficacy of a personalised low-calorie Mediterranean Diet (MD) in promoting fat mass (FM) reduction while preserving fat-free mass (FFM). This study involved 100 Caucasian adults aged 18-65 years who followed a tailored low-calorie MD for two months. The total energy expenditure was assessed using a multi-sensor armband. The change in body composition (BC) was evaluated using the Δ% FM-to-FFM ratio, calculated as the difference in the FM to FFM ratio before and after the diet, divided by the ratio before the diet, and multiplied by 100. A negative value indicates a greater decrease in FM than FFM, while a positive value suggests a greater increase in FM than FFM. This study demonstrated a significant FM reduction, with an average decrease of 5% (p < 0.001). However, the relationship between caloric reduction and the Δ% FM-to-FFM ratio showed a weak negative correlation (r = -0.03, p > 0.05). This suggests that the calorie deficit had a minimal direct impact on the BC changes. Subjects over the age of 30 showed an increase in muscle mass, while younger subjects showed no significant changes. Moreover, a direct correlation was observed between the changes in MET (Metabolic Equivalent of Task) values and the Δ% FM-to-FFM ratio, indicating that improved average physical activity intensity positively influences BC. In the female subgroup, high protein intake, exercise intensity, and the duration of physical activity were positively correlated with an improvement in the Δ% FM-to-FFM ratio. However, for individuals with BMI 20-25 kg/m2, high fibre intake was surprisingly negatively correlated with the Δ% FM-to-FFM ratio. This study underscores the intricate interplay between calorie restriction, physical activity intensity, and BC changes. It also suggests that individual factors, including age, gender, and BMI, may influence the response to a low-calorie MD. However, further prospective studies with larger sample sizes are necessary to confirm and expand upon these findings.

Keywords: body composition; caloric restriction; diet mediterranean; energy metabolism; exercise.


Conflict of interest statement

The authors declare no conflicts of interest.

Figures

Figure 1
Figure 1
Correlation analysis between caloric intake change and body composition shift. Figure 1 illustrates the correlation between Δ Kcal% and Δ% FM-to-FFM ratio. A scatter plot is presented, with a best-fit line to demonstrate the correlation trend among 100 subjects. Spearman’s correlation coefficient of −0.04 suggests a very weak negative correlation, underlining the complexity of the relationship. Abbreviations are elucidated as follows: Δ Kcal% = Percent change in caloric intake; Δ% FM-to-FFM ratio = Percent change in fat mass to fat-free mass ratio. The Δ Kcal% is depicted as an absolute value to illustrate its correlation with the Δ FM-to-FFM ratio%. This approach allows for a clear visualization of the relationship between changes in caloric intake and alterations in body composition. The presentation of Δ Kcal% as an absolute value highlights the varying degrees of caloric intake change, either increase or decrease, among participants.
Figure 2
Figure 2
Spearman correlation heatmap of dietary variables at baseline and Δ% FM-to-FFM ratio. This figure displays Spearman correlation coefficients among dietary variables measured at T0 and the change in the FM-to-FFM ratio between T0 and T1. Correlations significant at a p-value less than 0.05 are shown. The following variables are included: SFA g: Saturated Fats, PUFA g: Polyunsaturated Fats, MUFA g: Monounsaturated Fats, FM: Fat Mass, FFM: Fat-Free Mass.
Figure 3
Figure 3
Spearman correlation heatmap of physical activity parameters at baseline and Δ% FM-to-FFM ratio. This Figure shows Spearman correlation coefficients between physical activity parameters measured at baseline (T0) and the percentage change in FM-to-FFM ratio from T0 to T1. Only correlations with a p-value less than 0.05 are displayed.
Figure 4
Figure 4
Relationship between changes in fat mass to fat-free mass ratio and exercise intensity. This scatter plot illustrates the relationship between the percentage change in Fat Mass to Fat-Free Mass Ratio (Δ% FM-to-FFM ratio) from T0 to T1 and average Metabolic Equivalent of Task (METs) measured at T0 (r = −0.20, p = 0.042). The following variables are included: FM: Fat Mass; FFM: Fat-Free Mass; METs: Metabolic Equivalent of Task; Δ% FM-to-FFM ratio.
Figure 5
Figure 5
Correlation between physical activity duration and changes in fat mass to fat-free mass ratio. This scatter plot displays the relationship between Physical Activity Duration (in minutes) measured at T0 and the Δ% FM-to-FFM ratio from T0 to T1. A weak negative Spearman correlation (r = −0.20, p = 0.042) was observed. The following variables were included: FM: Fat Mass; FFM: Fat-Free Mass.
Figure 6
Figure 6
Significant Spearman correlations of the Δ% FM-to-FF ratio: comparison of dietary and sport variables and BMI categories and gender. This heatmap of Spearman correlation coefficients focuses on the significant relationships between various variables and the change in the percentage of fat mass to fat-free mass (Δ% FM-to-FFM ratio) across different gender and BMI categories. Only statistically significant values are included, and these are as follows: SFA g: Saturated Fats in grams, PUFA g: Polyunsaturated Fats in grams, MUFA g: Monounsaturated Fats in grams.

Similar articles

Cited by

References

    1. Willoughby D., Hewlings S., Kalman D. Body Composition Changes in Weight Loss: Strategies and Supplementation for Maintaining Lean Body Mass, a Brief Review. Nutrients. 2018;10:1876. doi: 10.3390/nu10121876. - DOI - PMC - PubMed
    1. Piqueras P., Ballester A., Durá-Gil J.V., Martinez-Hervas S., Redón J., Real J.T. Anthropometric Indicators as a Tool for Diagnosis of Obesity and Other Health Risk Factors: A Literature Review. Front. Psychol. 2021;12:631179. doi: 10.3389/fpsyg.2021.631179. - DOI - PMC - PubMed
    1. Roklicer R., Lakicevic N., Stajer V., Trivic T., Bianco A., Mani D., Milosevic Z., Maksimovic N., Paoli A., Drid P. The effects of rapid weight loss on skeletal muscle in judo athletes. J. Transl. Med. 2020;18:142. doi: 10.1186/s12967-020-02315-x. - DOI - PMC - PubMed
    1. van Baak M.A., Mariman E.C.M. Obesity-induced and weight-loss-induced physiological factors affecting weight regain. Nat. Rev. Endocrinol. 2023;19:655–670. doi: 10.1038/s41574-023-00887-4. - DOI - PubMed
    1. Bonaccio M., Costanzo S., Di Castelnuovo A., Gialluisi A., Ruggiero E., De Curtis A., Persichillo M., Cerletti C., Donati M.B., de Gaetano G., et al. Increased Adherence to a Mediterranean Diet Is Associated with Reduced Low-Grade Inflammation after a 12.7-Year Period: Results From the Moli-sani Study. J. Acad. Nutr. Diet. 2023;123:783–795.e7. doi: 10.1016/j.jand.2022.12.005. - DOI - PubMed

LinkOut - more resources