

The Mechanism Underlying the Hypoglycemic Effect of Epimedin C on Mice with Type 2 Diabetes Mellitus Based on Proteomic Analysis
- PMID: 38201855
- PMCID: PMC10780735
- DOI: 10.3390/nu16010025
The Mechanism Underlying the Hypoglycemic Effect of Epimedin C on Mice with Type 2 Diabetes Mellitus Based on Proteomic Analysis
Abstract
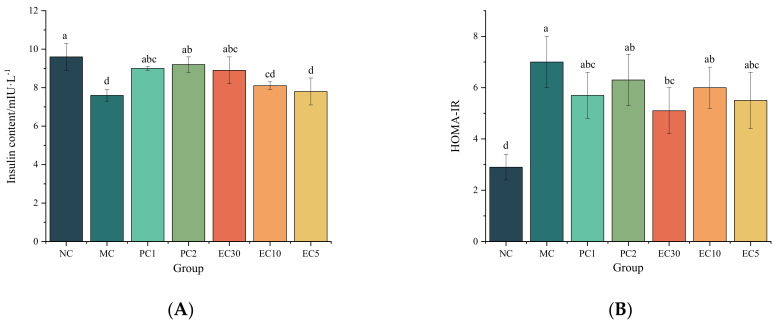
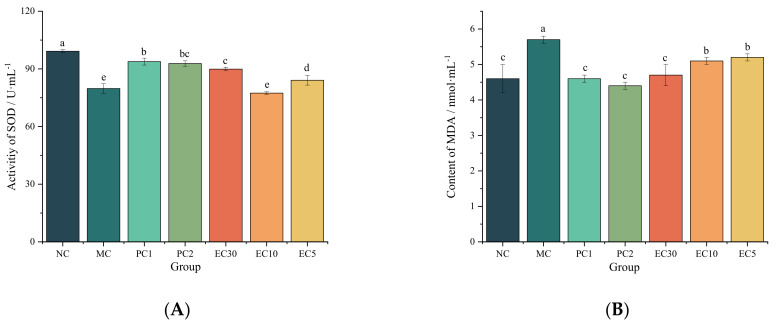
Type 2 diabetes mellitus (T2DM) has become a worldwide public health problem. Epimedin C is considered one of the most important flavonoids in Epimedium, a famous edible herb in China and Southeast Asia that is traditionally used in herbal medicine to treat diabetes. In the present study, the therapeutic potential of epimedin C against T2DM was ascertained using a mouse model, and the mechanism underlying the hypoglycemic activity of epimedin C was explored using a label-free proteomic technique for the first time. Levels of fasting blood glucose (FBG), homeostasis model assessment of insulin resistance (HOMA-IR), and oral glucose tolerance, as well as contents of malondialdehyde (MDA) and low-density lipoprotein cholesterol (LDL-C) in the 30 mg·kg-1 epimedin C group (EC30 group), were significantly lower than those in the model control group (MC group) (p < 0.05), while the contents of hepatic glycogen, insulin, and high-density lipoprotein cholesterol (HDL-C), as well as activities of superoxide dismutase (SOD) and glutathione peroxidase (GSH-Px) in the EC30 group were notably higher than those in the MC group (p < 0.05). The structures of liver cells and tissues were greatly destroyed in the MC group, whereas the structures of cells and tissues were basically complete in the EC30 group, which were similar to those in the normal control group (NC group). A total of 92 differentially expressed proteins (DEPs) were enriched in the gene ontology (GO) and Kyoto Encyclopedia of Genes and Genomes (KEGG) pathways. In the EC30 vs. MC groups, the expression level of cytosolic phosphoenolpyruvate carboxykinase (Pck1) was down-regulated, while the expression levels of group XIIB secretory phospholipase A2-like protein (Pla2g12b), apolipoprotein B-100 (Apob), and cytochrome P450 4A14 (Cyp4a14) were up-regulated. According to the KEGG pathway assay, Pck1 participated in the gluconeogenesis and insulin signaling pathways, and Pla2g12b, Apob, and Cyp4a14 were the key proteins in the fat digestion and fatty acid degradation pathways. Pck1, Pla2g12b, Apob, and Cyp4a14 seemed to play important roles in the prevention and treatment of T2DM. In summary, epimedin C inhibited Pck1 expression to maintain FBG at a relatively stable level, promoted Pla2g12b, Apob, and Cyp4a14 expressions to alleviate liver lipotoxicity, and protected liver tissues and cells from oxidant stress possibly by its phenolic hydroxyl groups.
Keywords: epimedin C; label-free proteomic technique; mechanism of action; mice; type 2 diabetes mellitus.
Conflict of interest statement
The authors declare no conflict of interest.
Figures


References
-
- Magliano D.J., Boyko E.J., IDF Diabetes Atlas 10th Edition Scientific Committee . IDF Diabetes Atlas. 10th ed. International Diabetes Federation; Brussels, Belgium: 2021. [(accessed on 23 September 2022)]. Available online: http://www.ncbi.nlm.nih.gov/books/NBK581934/
-
- Kitagawa N., Hashimoto Y., Hamaguchi M., Osaka T., Fukuda T., Yamazaki M., Fukui M. Liver Stiffness Is Associated with Progression of Albuminuria in Adults with Type 2 Diabetes: Nonalcoholic Fatty Disease Cohort Study. Can. J. Diabetes. 2020;44:428–433. doi: 10.1016/j.jcjd.2020.03.004. - DOI - PubMed
MeSH terms
Substances
Grants and funding
- DL2023173001L/National Program of Belt and Road Innovative Talents Exchange of the Chinese Ministry of Science and Technology
- 2022ZDLSF05-11/Se-2023C04/Key Research and Development Program of Shaanxi Province and Ankang City (Key Laboratory of Se-enriched Products Development and Quality Control of Ministry of Agriculture and Rural Affairs and National-Local Joint Engineering Laboratory of Se-enriched Fo
- 202305AF150118/Program of Academician and Expert Workstation in Puer City of Yunnan Province in China
LinkOut - more resources
Full Text Sources
Medical
Miscellaneous
