

Geographical Distribution of Dietary Patterns and Their Association with T2DM in Chinese Adults Aged 45 y and Above: A Nationwide Cross-Sectional Study
- PMID: 38201937
- PMCID: PMC10780680
- DOI: 10.3390/nu16010107
Geographical Distribution of Dietary Patterns and Their Association with T2DM in Chinese Adults Aged 45 y and Above: A Nationwide Cross-Sectional Study
Abstract
Background: This study aimed to investigate the geographical distribution of dietary patterns and their association with T2DM among Chinese adults aged 45 years and above.
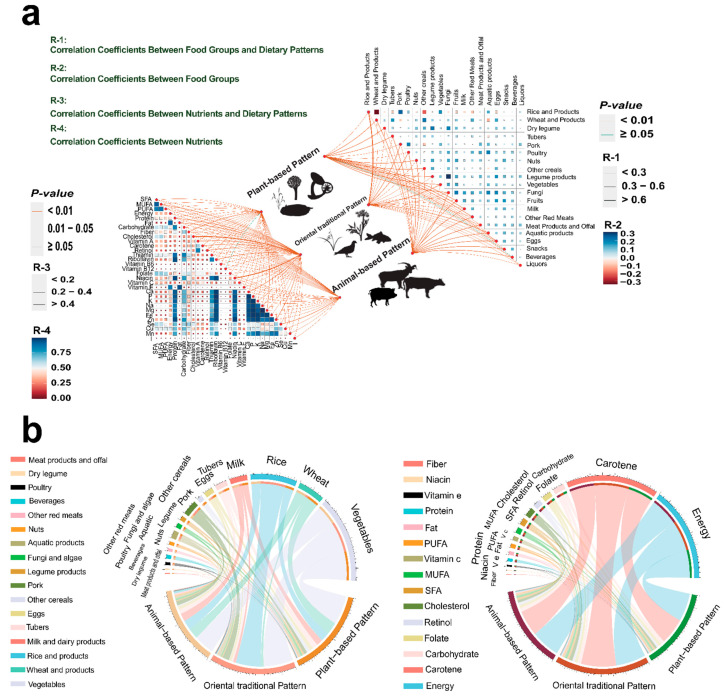
Methods: Data was from the China Adults Chronic Diseases and Nutrition Surveillance (2015). Dietary intake for each participant was determined through a combination of 3-day 24-h dietary recall interviews and food frequency questionnaires. Principal component analysis was used to extract dietary patterns and spatial analysis was employed to investigate the geographic distribution of them. T2DM was diagnosed using criteria of ADA 2018, and binary logistic regression was employed to examine the relationship between dietary patterns and T2DM.
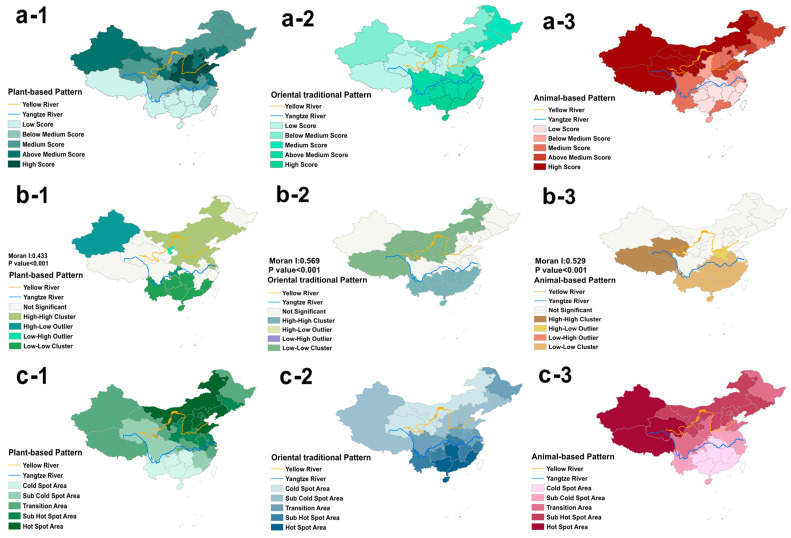
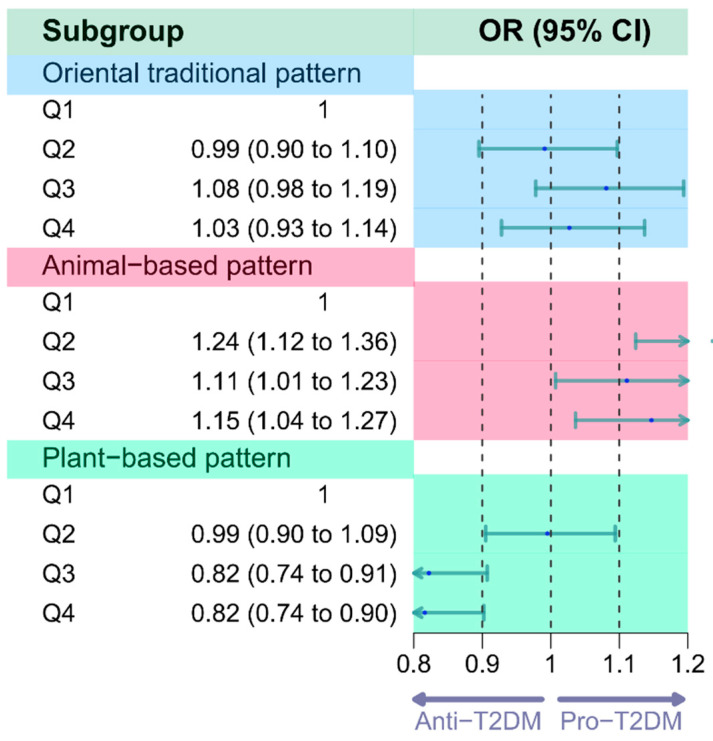
Results: A total of 36,648 participants were included in the study; 10.9% of them were diagnosed as T2DM. Three dietary patterns were identified with the name of plant-based pattern, animal-based pattern, and oriental traditional pattern, which were represented located in northern, northwest, and southern regions, respectively. After adjusting for potential confounders, participants in the highest quartile of the plant-based pattern were associated with lower T2DM odds (OR = 0.82, 95% CI: 0.74, 0.90) when comparing with the lowest quartile. However, participants inclined to higher quartiles of animal-based pattern had a higher risk of T2DM (OR = 1.15, 95% CI: 1.04, 1.27) compared with those in the lower quartiles. No significant association was found between the oriental traditional pattern and T2DM (OR = 1.03, 95% CI: 0.93, 1.14).
Conclusion: Dietary patterns of Chinese population revealed geographical disparities, with plant-based dietary pattern showing protective effects and animal-based pattern carrying high risks for T2DM. Regional dietary variations and food environment are paramount in T2DM prevention and management.
Keywords: T2DM; cross-sectional study; dietary patterns; spatial statistical analysis.
Conflict of interest statement
The authors declare no conflict of interest.
Figures
References
-
- World Health Organization . Global Report on Diabetes. 2016. World Health Organization; Geneva, Switzerland: 2018.
-
- IDF . IDF Diabetes Atlas. 8th ed. IDF; Brussels, Belgium: 2017. pp. 905–911.
-
- Zhu D., Chinese Diabetes Society Guidelines for the prevention and treatment of type 2 diabetes in China (2020 edition) J. Clin. Endocrinol. Metab. 2021;13:315–409.
MeSH terms
LinkOut - more resources
Full Text Sources
Medical
Research Materials
