Review
. 2023 Dec 22;13(1):78.
doi: 10.3390/jcm13010078.

Myocardial Mechanics and Associated Valvular and Vascular Abnormalities in Left Ventricular Noncompaction Cardiomyopathy

Affiliations
Review

Myocardial Mechanics and Associated Valvular and Vascular Abnormalities in Left Ventricular Noncompaction Cardiomyopathy

Attila Nemes. J Clin Med. .

Abstract

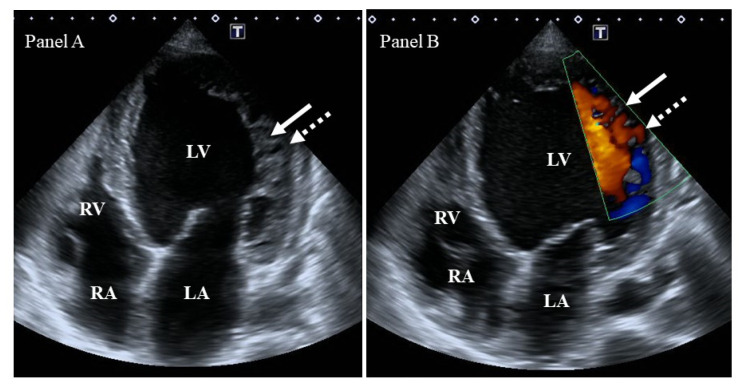
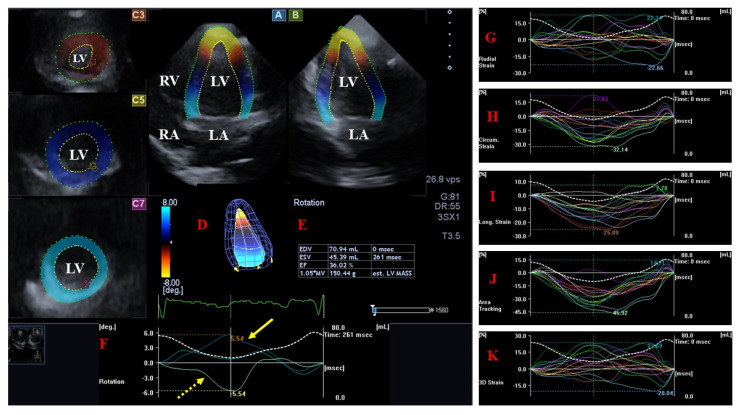
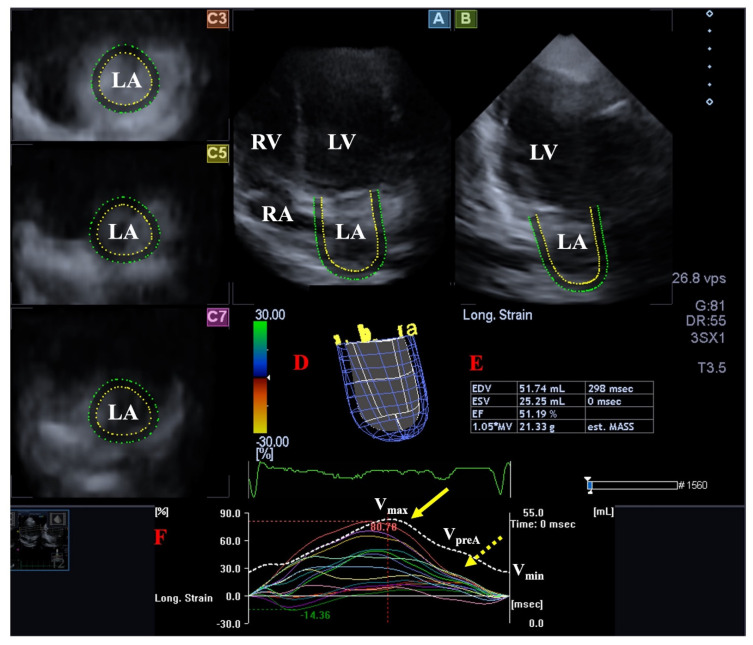
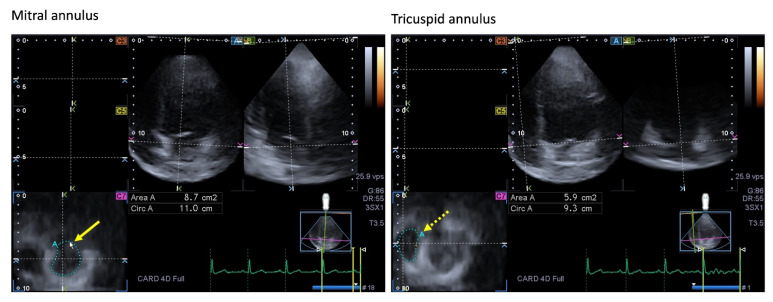
Left ventricular (LV) non-compaction (LVNC) is a rare genetic cardiomyopathy due to abnormal intra-uterine arrest of compaction of the myocardial fibers during endomyocardial embryogenesis. Due to the partial or complete absence of LV compaction, the structure of the LV wall shows characteristic abnormalities, including a thin compacted epicardium and a thick non-compacted endocardium with prominent trabeculations and deep intertrabecular recesses. LVNC is frequently associated with chronic heart failure, life-threatening ventricular arrhythmias, and systemic embolic events. According to recent findings, in the presence of LVNC, dysfunctional LV proved to be associated with left atrial volumetric and functional abnormalities and consequential dilated and functionally impaired mitral annulus, partly explaining the higher prevalence of regurgitation. Although the non-compaction process morphologically affects only the LV, signs of remodeling of the right heart were also detected. Moreover, dilation and stiffening of the aorta were present. The aim of the present detailed review was to summarize findings regarding changes in cardiac mechanics, valvular abnormalities, and vascular remodeling detected in patients with LVNC.

Keywords: cardiac mechanics; cardiomyopathy; left ventricular; non-compaction; remodeling; vascular.


Conflict of interest statement

The author declares no conflict of interest.

Figures

Figure 1
Figure 1
Two-dimensional grey-scale image (Panel A) and Doppler evidence (Panel B) of left ventricular (LV) noncompaction demonstrating LV lateral wall trabeculation (white arrows) and sinuses (dashed white arrows). Abbreviations: LV = left ventricle, LA = left atrium, RV = right ventricle, RA = right atrium.
Figure 2
Figure 2
Evaluation of the left ventricle by three-dimensional (3D) speckle−tracking echocardiography. Following the acquisition of a 3D echocardiographic dataset and by using a dedicated vendor-provided software, several views are produced automatically: longitudinal apical four-chamber (A) and two-chamber (B) views and short-axis views at the apical (C3), midventricular (C5), and basal (C7) LV regions. The 3D LV model (D), calculated LV volumes and ejection fraction (E), and apical (yellow arrow) and basal (yellow dashed arrow) LV rotations (F), together with time–LV global (white curve) and segmental (colored curves) radial (G), circumferential (H), longitudinal (I), area (J), and 3D (K) strain curves with a time–LV volume change curve (dashed white curve), are demonstrated. The image presents a patient with reduced LV function (decreased LV ejection function) and normally directed LV rotational mechanics with reduced counterclockwise apical (yellow arrow) and preserved clockwise basal (dashed yellow arrow) LV rotations. Abbreviations: LV = left ventricle, LA = left atrium, RV = right ventricle, RA = right atrium, EDV = LV end-diastolic volume, ESV = LV end-systolic volume, EF = LV ejection fraction, MASS = LV muscle mass.
Figure 3
Figure 3
Evaluation of the left atrium (LA) by three-dimensional (3D) speckle-tracking echocardiography. Following acquisition of a 3D echocardiographic dataset and by using a dedicated vendor-provided software, several views are produced automatically: Longitudinal apical four-chamber (A) and two-chamber (B) views, together with short-axis views at the basal (C3), midatrial (C5), and superior (C7) LA regions, are demonstrated. A virtual 3D LA cast (D), together with calculated LA volumes (E) and time–LA global (white curve) and segmental (colored curves) longitudinal (F) strain curves with a time–LA volume change curve (dashed white curve), are also demonstrated. The yellow arrow represents peak LA strains, whereas the yellow dashed arrow represents LA strains at atrial contraction. Abbreviations: LV = left ventricle, LA = left atrium, RV = right ventricle, RA = right atrium, EDV = end-diastolic volume, ESV = end-systolic volume, EF = ejection fraction, MASS = LA muscle mass, Vmax = minimum end-systolic LA volume, VpreA = early diastolic LA volume before atrial contraction, Vmin = end-diastolic minimum LA volume.
Figure 4
Figure 4
Images showing two-dimensionally projected views of the mitral (MA) and tricuspid (TA) annuli as assessed by three-dimensional (3D) speckle-tracking echocardiography. After the acquisition of the 3D echocardiographic dataset, the following views were produced: Apical four-chamber (A) and two-chamber views (B) and a cross-sectional view at the level of the MA/TA were optimized in apical four- and two-chamber views (C7). The yellow arrow represents the two-dimensional projection of the MA plane, whereas the yellow dashed arrow represents the two-dimensional projection of the TA plane. Abbreviations: LA = left atrium, LV = left ventricle, RA = right atrium, RV = right ventricle, Area = MA/TA area, Circ = MA/TA perimeter.
Figure 5
Figure 5
Evaluation of the right atrium (RA) by three-dimensional (3D) speckle-tracking echocardiography. Following acquisition of a 3D echocardiographic dataset and by using dedicated vendor-provided software, several views were produced automatically: Longitudinal apical four-chamber (A) and two-chamber (B) views and short-axis views at basal (C3), midatrial (C5), and superior (C7) RA levels. The 3D cast of the RA (D) is shown with calculated RA volumes (E) and time–RA global (white curve) and segmental (colored curves) longitudinal (F) RA strain curves together with a time–RA volume change curve (dashed white curve). The yellow arrow represents peak RA strains, whereas the yellow dashed arrow represents RA strains at atrial contraction. Abbreviations: LV = left ventricle, LA = left atrium, RV = right ventricle, RA = right atrium, EDV = end-diastolic volume, ESV = end-systolic volume, EF = ejection fraction, MASS = RA muscle mass, Vmax = minimum end-systolic RA volume, VpreA = early diastolic RA volume before atrial contraction, Vmin = end-diastolic minimum RA volume.

Similar articles

Cited by

References

    1. Wu M. Mechanisms of Trabecular Formation and Specification During Cardiogenesis. Pediatr. Cardiol. 2018;39:1082–1089. doi: 10.1007/s00246-018-1868-x. - DOI - PMC - PubMed
    1. Engberding R., Bender F. Identification of a rare congenital anomaly of the myocardium by two-dimensional echocardiography: Persistence of isolated myocardial sinusoids. Am. J. Cardiol. 1984;53:1733–1734. doi: 10.1016/0002-9149(84)90618-0. - DOI - PubMed
    1. Chin T.K., Perloff J.K., Williams R.G., Jue K., Mohrmann R. Isolated noncompaction of left ventricular myocardium. A study of eight cases. Circulation. 1990;82:507–513. doi: 10.1161/01.CIR.82.2.507. - DOI - PubMed
    1. Jenni R., Oechslin E., Schneider J., Attenhofer Jost C., Kaufmann P.A. Echocardiographic and pathoanatomical characteristics of isolated left ventricular noncompaction: A step towards classification as a distinct cardiomyopathy. Heart. 2001;86:666–671. doi: 10.1136/heart.86.6.666. - DOI - PMC - PubMed
    1. Almeida A.G., Pinto F.J. Non-compaction cardiomyopathy. Heart. 2013;99:1535–1542. doi: 10.1136/heartjnl-2012-302048. - DOI - PubMed

LinkOut - more resources