

Correlations between Resting Electrocardiogram Findings and Disease Profiles: Insights from the Qatar Biobank Cohort
- PMID: 38202283
- PMCID: PMC10779868
- DOI: 10.3390/jcm13010276
Correlations between Resting Electrocardiogram Findings and Disease Profiles: Insights from the Qatar Biobank Cohort
Abstract
Background: Resting electrocardiogram (ECG) is a valuable non-invasive diagnostic tool used in clinical medicine to assess the electrical activity of the heart while the patient is resting. Abnormalities in ECG may be associated with clinical biomarkers and can predict early stages of diseases. In this study, we evaluated the association between ECG traits, clinical biomarkers, and diseases and developed risk scores to predict the risk of developing coronary artery disease (CAD) in the Qatar Biobank.
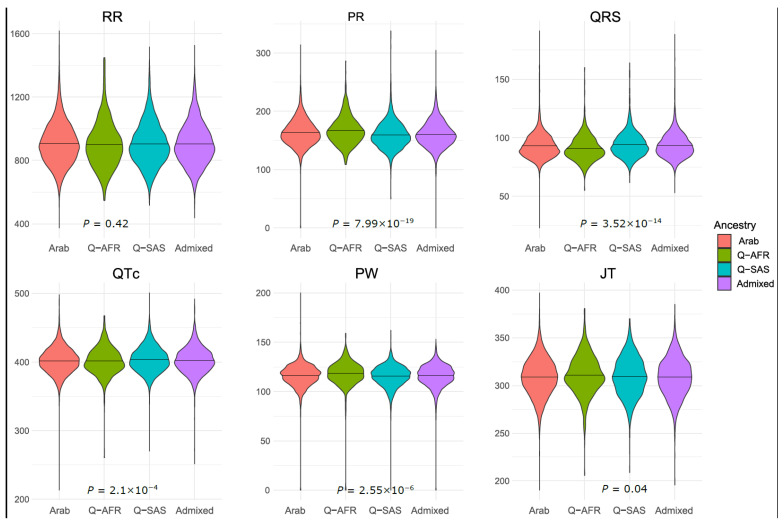
Methods: This study used 12-lead ECG data from 13,827 participants. The ECG traits used for association analysis were RR, PR, QRS, QTc, PW, and JT. Association analysis using regression models was conducted between ECG variables and serum electrolytes, sugars, lipids, blood pressure (BP), blood and inflammatory biomarkers, and diseases (e.g., type 2 diabetes, CAD, and stroke). ECG-based and clinical risk scores were developed, and their performance was assessed to predict CAD. Classical regression and machine-learning models were used for risk score development.
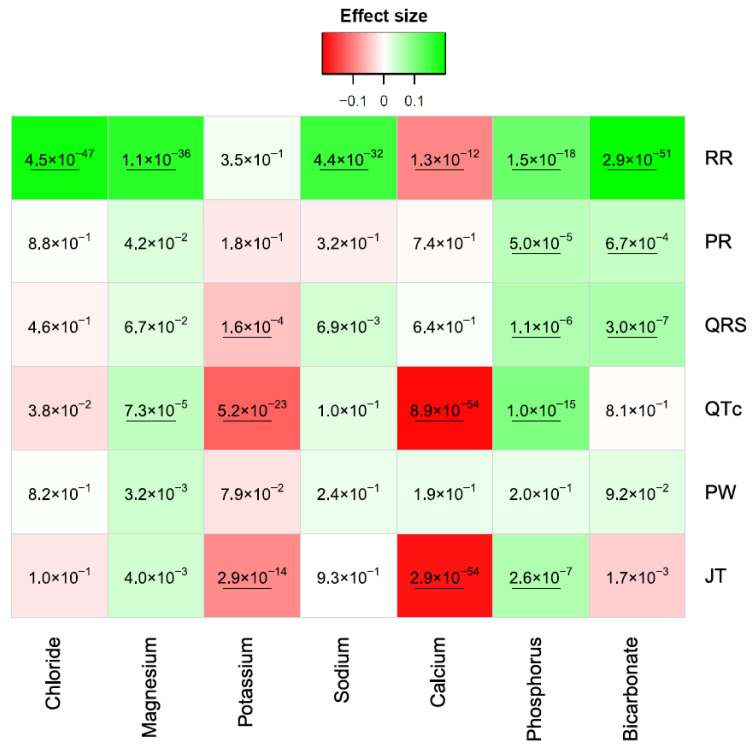
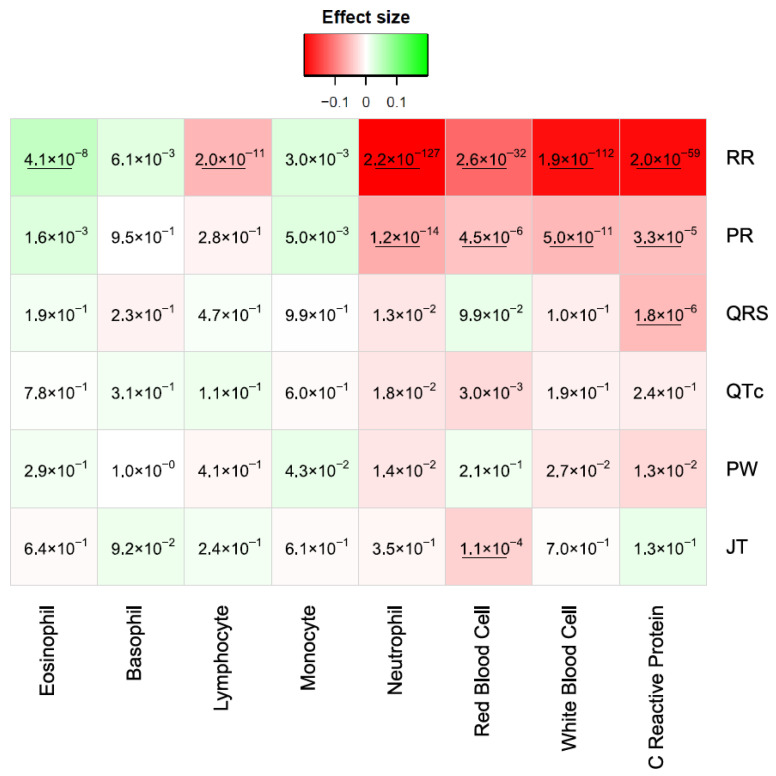
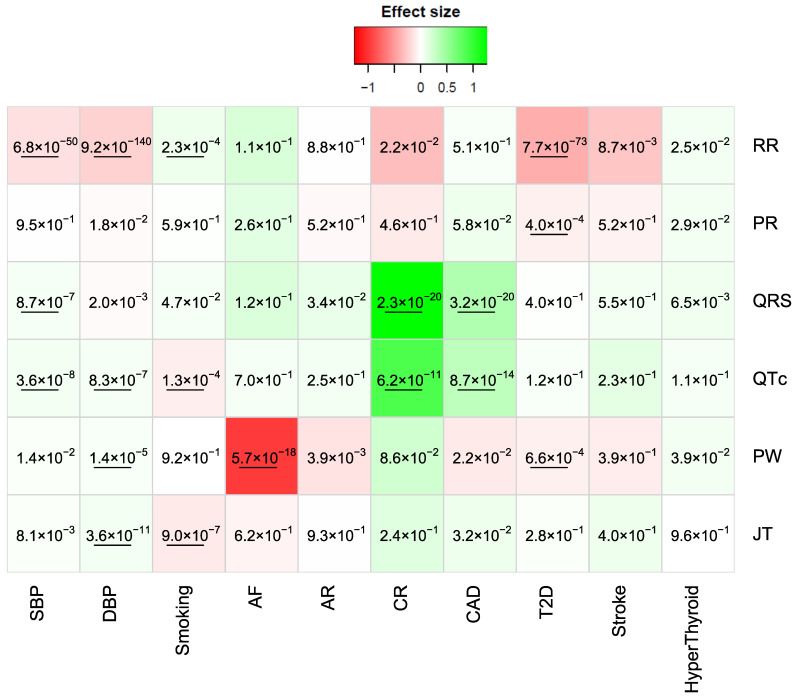
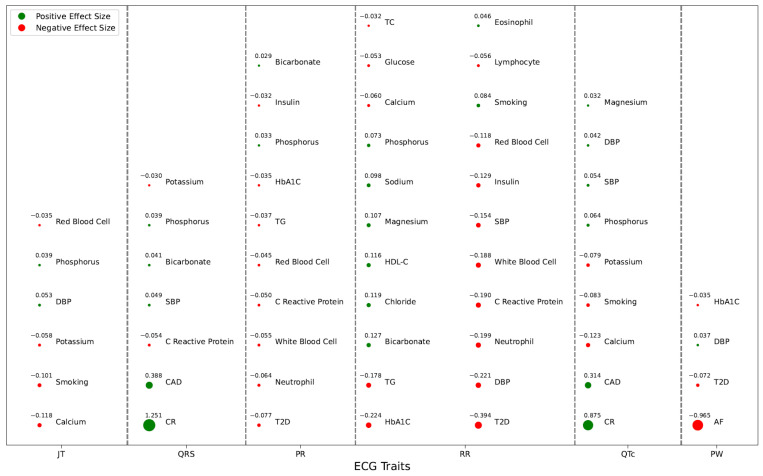
Results: Significant associations were observed with ECG traits. RR showed the largest number of associations: e.g., positive associations with bicarbonate, chloride, HDL-C, and monocytes, and negative associations with glucose, insulin, neutrophil, calcium, and risk of T2D. QRS was positively associated with phosphorus, bicarbonate, and risk of CAD. Elevated QTc was observed in CAD patients, whereas decreased QTc was correlated with decreased levels of calcium and potassium. Risk scores developed using regression models were outperformed by machine-learning models. The area under the receiver operating curve reached 0.84 using a machine-learning model that contains ECG traits, sugars, lipids, serum electrolytes, and cardiovascular disease risk factors. The odds ratio for the top decile of CAD risk score compared to the remaining deciles was 13.99.
Conclusions: ECG abnormalities were associated with serum electrolytes, sugars, lipids, and blood and inflammatory biomarkers. These abnormalities were also observed in T2D and CAD patients. Risk scores showed great predictive performance in predicting CAD.
Keywords: ECG; Middle East; Qatar Biobank; arrythmia; cardiovascular diseases; diverse populations; risk scores; type 2 diabetes.
Conflict of interest statement
The authors declare no conflicts of interest.
Figures

Similar articles
-
Genome-Wide Association Study for Resting Electrocardiogram in the Qatari Population Identifies 6 Novel Genes and Validates Novel Polygenic Risk Scores.J Am Heart Assoc. 2025 Mar 4;14(5):e038341. doi: 10.1161/JAHA.124.038341. Epub 2025 Feb 26. J Am Heart Assoc. 2025. PMID: 40008532 Free PMC article.
-
Longitudinal association of electrocardiogram abnormalities with major adverse cardiac events in people with Type 2 diabetes: the Hoorn Diabetes Care System cohort.Eur J Prev Cardiol. 2023 Jun 1;30(8):624-633. doi: 10.1093/eurjpc/zwac314. Eur J Prev Cardiol. 2023. PMID: 36625405
-
Non-invasive detection of coronary artery disease by a newly developed high-frequency QRS electrocardiogram.Physiol Meas. 2004 Aug;25(4):957-65. doi: 10.1088/0967-3334/25/4/014. Physiol Meas. 2004. PMID: 15382834 Clinical Trial.
-
Change in T/QRS ratio can be a supplementary diagnostic tool in predicting coronary artery disease in patients with NSTEMI.Am J Emerg Med. 2021 Jan;39:48-54. doi: 10.1016/j.ajem.2020.01.013. Epub 2020 Jan 8. Am J Emerg Med. 2021. PMID: 31954545
-
Analysing electrocardiographic traits and predicting cardiac risk in UK biobank.JRSM Cardiovasc Dis. 2021 Jun 12;10:20480040211023664. doi: 10.1177/20480040211023664. eCollection 2021 Jan-Dec. JRSM Cardiovasc Dis. 2021. PMID: 34211707 Free PMC article. Review.
Cited by
-
Genome-Wide Association Study for Resting Electrocardiogram in the Qatari Population Identifies 6 Novel Genes and Validates Novel Polygenic Risk Scores.J Am Heart Assoc. 2025 Mar 4;14(5):e038341. doi: 10.1161/JAHA.124.038341. Epub 2025 Feb 26. J Am Heart Assoc. 2025. PMID: 40008532 Free PMC article.
References
Grants and funding
LinkOut - more resources
Full Text Sources
Research Materials
Miscellaneous
