

Genome-Wide Identification and Expression Analysis of Catalase Gene Families in Triticeae
- PMID: 38202319
- PMCID: PMC10781083
- DOI: 10.3390/plants13010011
Genome-Wide Identification and Expression Analysis of Catalase Gene Families in Triticeae
Abstract
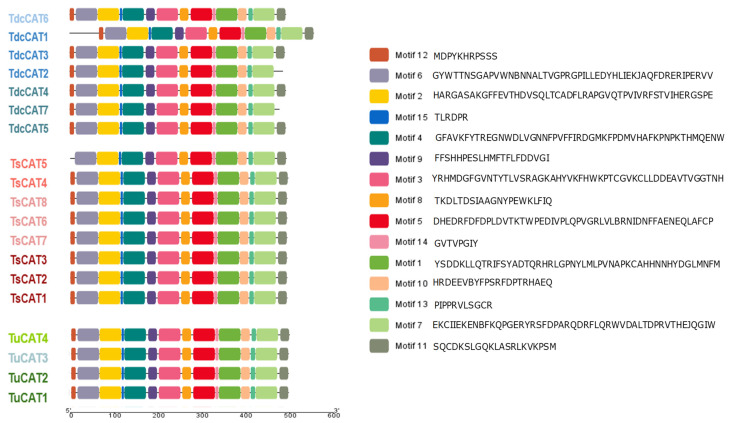
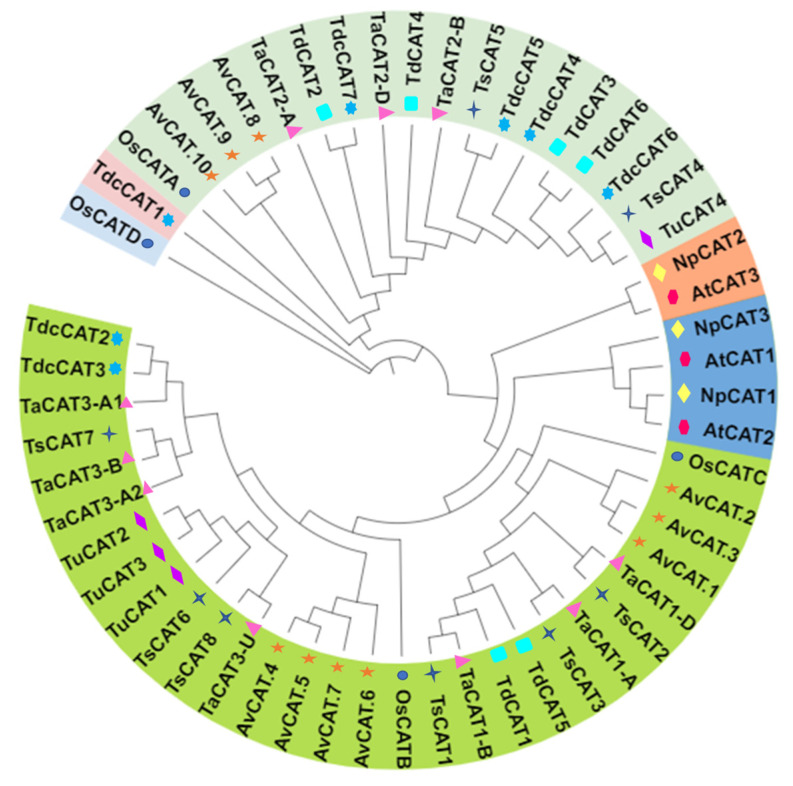
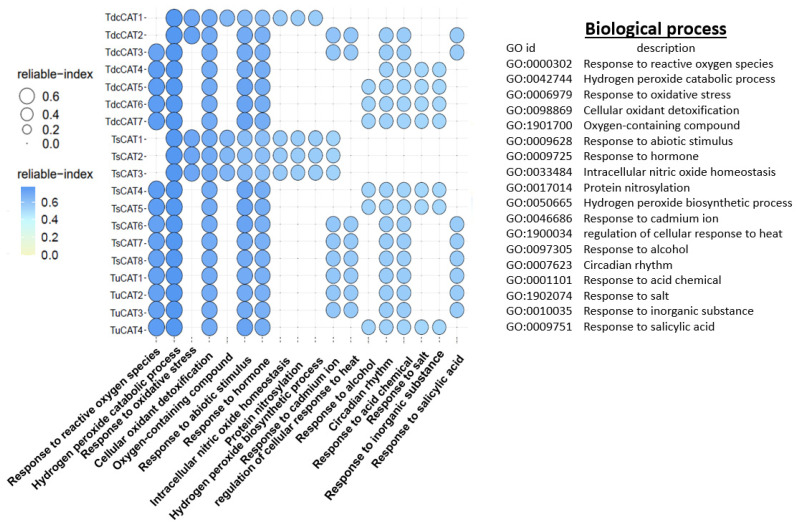
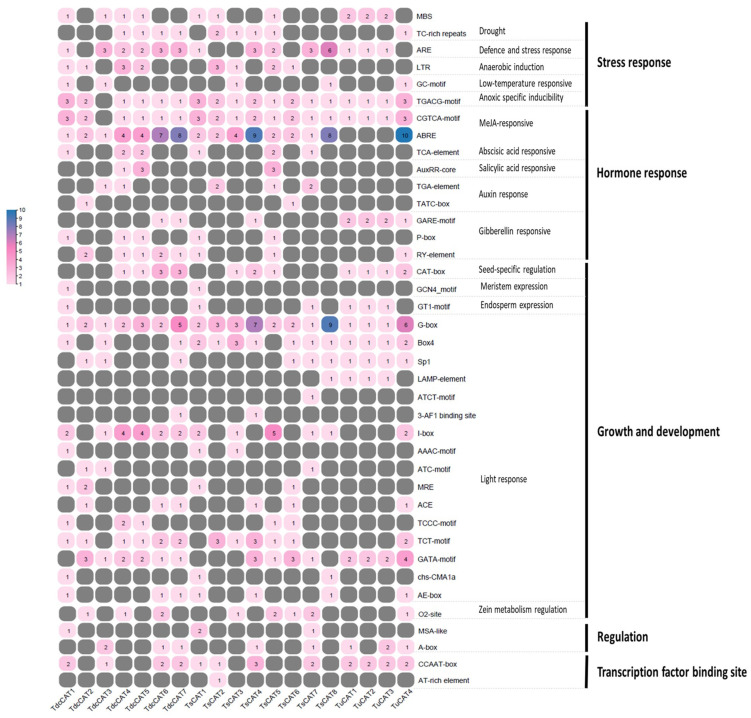
Aerobic metabolism in plants results in the production of hydrogen peroxide (H2O2), a significant and comparatively stable non-radical reactive oxygen species (ROS). H2O2 is a signaling molecule that regulates particular physiological and biological processes (the cell cycle, photosynthesis, plant growth and development, and plant responses to environmental challenges) at low concentrations. Plants may experience oxidative stress and ultimately die from cell death if excess H2O2 builds up. Triticum dicoccoides, Triticum urartu, and Triticum spelta are different ancient wheat species that present different interesting characteristics, and their importance is becoming more and more clear. In fact, due to their interesting nutritive health, flavor, and nutritional values, as well as their resistance to different parasites, the cultivation of these species is increasingly important. Thus, it is important to understand the mechanisms of plant tolerance to different biotic and abiotic stresses by studying different stress-induced gene families such as catalases (CAT), which are important H2O2-metabolizing enzymes found in plants. Here, we identified seven CAT-encoding genes (TdCATs) in Triticum dicoccoides, four genes in Triticum urartu (TuCATs), and eight genes in Triticum spelta (TsCATs). The accuracy of the newly identified wheat CAT gene members in different wheat genomes is confirmed by the gene structures, phylogenetic relationships, protein domains, and subcellular location analyses discussed in this article. In fact, our analysis showed that the identified genes harbor the following two conserved domains: a catalase domain (pfam00199) and a catalase-related domain (pfam06628). Phylogenetic analyses showed that the identified wheat CAT proteins were present in an analogous form in durum wheat and bread wheat. Moreover, the identified CAT proteins were located essentially in the peroxisome, as revealed by in silico analyses. Interestingly, analyses of CAT promoters in those species revealed the presence of different cis elements related to plant development, maturation, and plant responses to different environmental stresses. According to RT-qPCR, Triticum CAT genes showed distinctive expression designs in the studied organs and in response to different treatments (salt, heat, cold, mannitol, and ABA). This study completed a thorough analysis of the CAT genes in Triticeae, which advances our knowledge of CAT genes and establishes a framework for further functional analyses of the wheat gene family.
Keywords: Triticeae; abiotic stress; antioxidant enzymes; catalase; gene structure; reactive oxygen species.
Conflict of interest statement
The authors declare no conflict of interest.
Figures


Similar articles
-
Catalase Gene Family in Durum Wheat: Genome-Wide Analysis and Expression Profiling in Response to Multiple Abiotic Stress Conditions.Plants (Basel). 2023 Jul 21;12(14):2720. doi: 10.3390/plants12142720. Plants (Basel). 2023. PMID: 37514334 Free PMC article.
-
Catalase (CAT) Gene Family in Wheat (Triticum aestivum L.): Evolution, Expression Pattern and Function Analysis.Int J Mol Sci. 2022 Jan 4;23(1):542. doi: 10.3390/ijms23010542. Int J Mol Sci. 2022. PMID: 35008967 Free PMC article.
-
Multiple abiotic stress tolerance of the transformants yeast cells and the transgenic Arabidopsis plants expressing a novel durum wheat catalase.Plant Physiol Biochem. 2015 Dec;97:420-31. doi: 10.1016/j.plaphy.2015.10.034. Epub 2015 Oct 31. Plant Physiol Biochem. 2015. PMID: 26555900
-
Genome-Wide Investigation and Expression Analysis of the Catalase Gene Family in Oat Plants (Avena sativa L.).Plants (Basel). 2023 Oct 26;12(21):3694. doi: 10.3390/plants12213694. Plants (Basel). 2023. PMID: 37960051 Free PMC article.
-
Genome-wide exploration of C2H2 zinc finger family in durum wheat (Triticum turgidum ssp. Durum): insights into the roles in biological processes especially stress response.Biometals. 2018 Dec;31(6):1019-1042. doi: 10.1007/s10534-018-0146-y. Epub 2018 Oct 4. Biometals. 2018. PMID: 30288657 Review.
Cited by
-
Current status for utilization of cold resistance genes and strategies in wheat breeding program.Front Genet. 2024 Oct 22;15:1473717. doi: 10.3389/fgene.2024.1473717. eCollection 2024. Front Genet. 2024. PMID: 39502336 Free PMC article. Review.
-
Exogenous Cytokinin 4PU-30 Modulates the Response of Wheat and Einkorn Seedlings to Ultraviolet B Radiation.Plants (Basel). 2024 May 17;13(10):1401. doi: 10.3390/plants13101401. Plants (Basel). 2024. PMID: 38794471 Free PMC article.
-
Isolation and characterization of Avena sativa catalase 1 gene (AsCAT1) with potential role in plant response to abiotic stress conditions.Protoplasma. 2025 Jul 3. doi: 10.1007/s00709-025-02090-w. Online ahead of print. Protoplasma. 2025. PMID: 40610761
References
-
- Lenton T.M. Evolution on Planet Earth. Academic Press; Cambridge, MA, USA: 2003. 3—The coupled evolution of life and atmospheric oxygen; pp. 35–53.
LinkOut - more resources
Full Text Sources
Miscellaneous
