. 2023 Dec 22;13(1):51.
doi: 10.3390/plants13010051.

Role of Acetic Acid and Nitric Oxide against Salinity and Lithium Stress in Canola (Brassica napus L.)

Affiliations

Role of Acetic Acid and Nitric Oxide against Salinity and Lithium Stress in Canola (Brassica napus L.)

Mona F A Dawood et al. Plants (Basel). .

Abstract

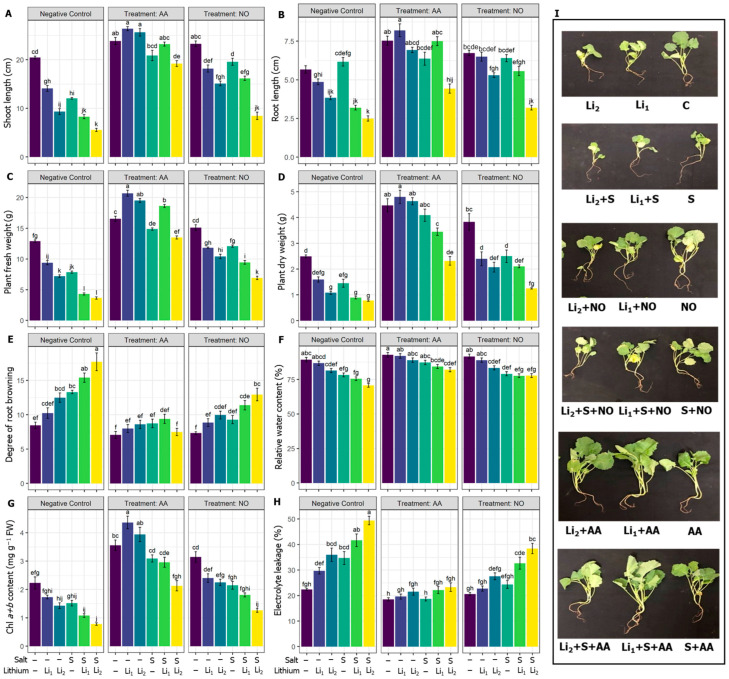
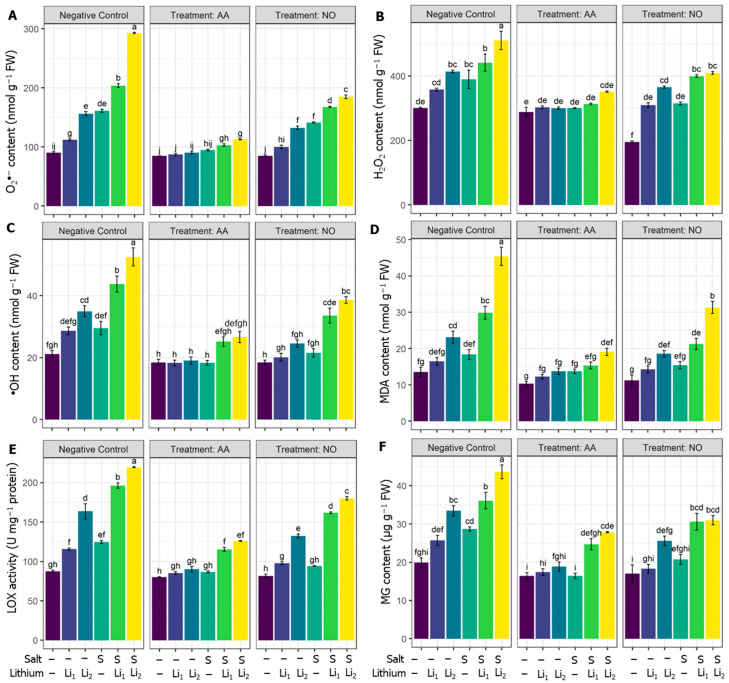
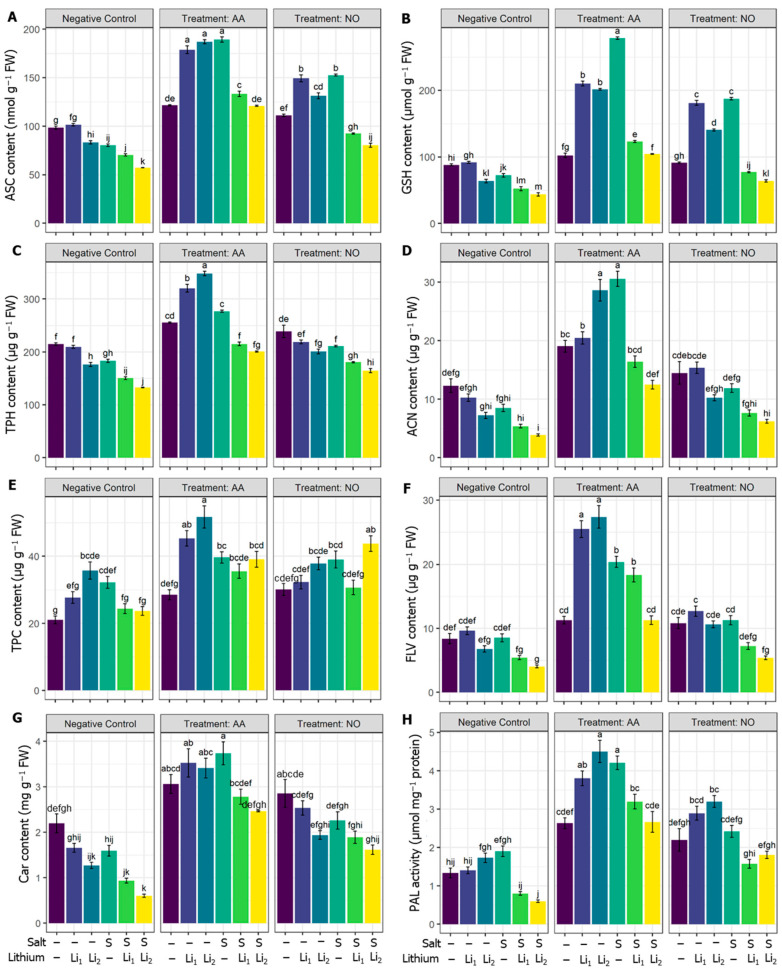
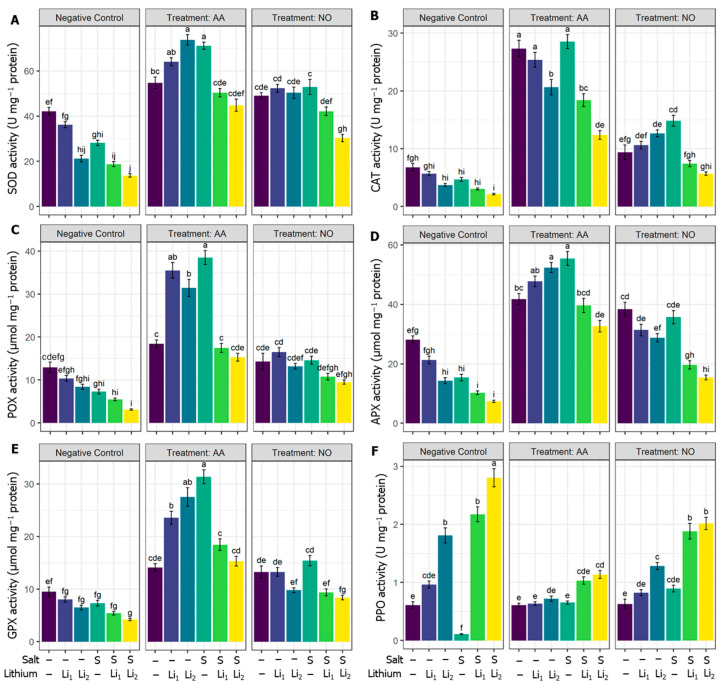
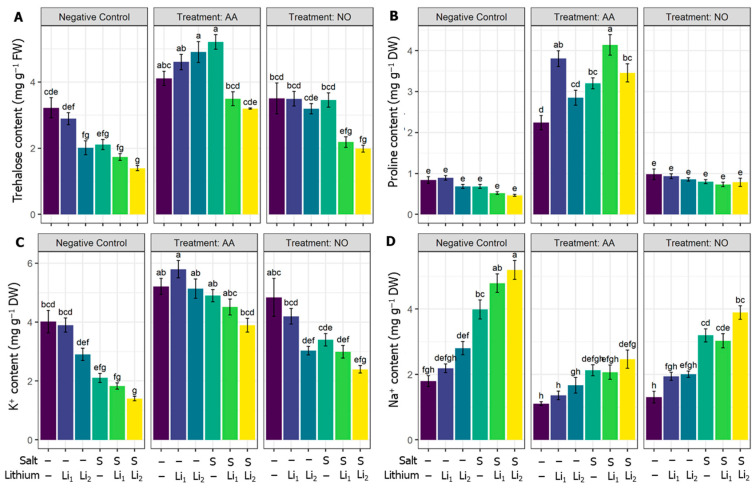
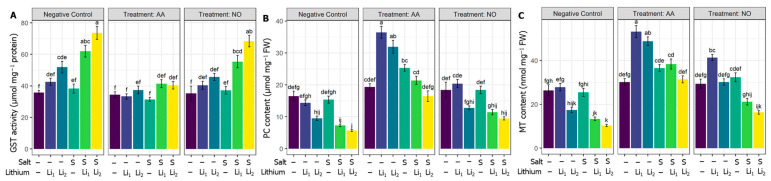
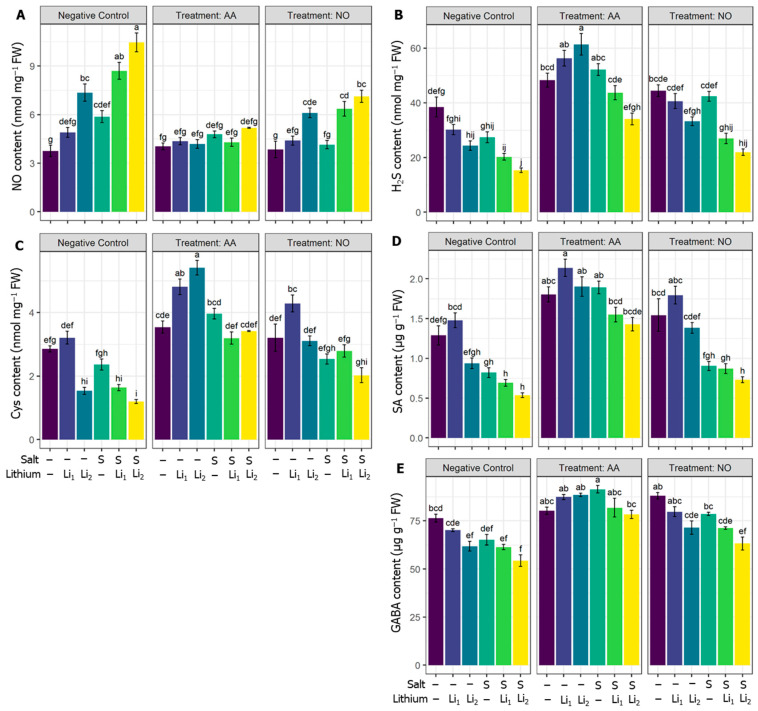
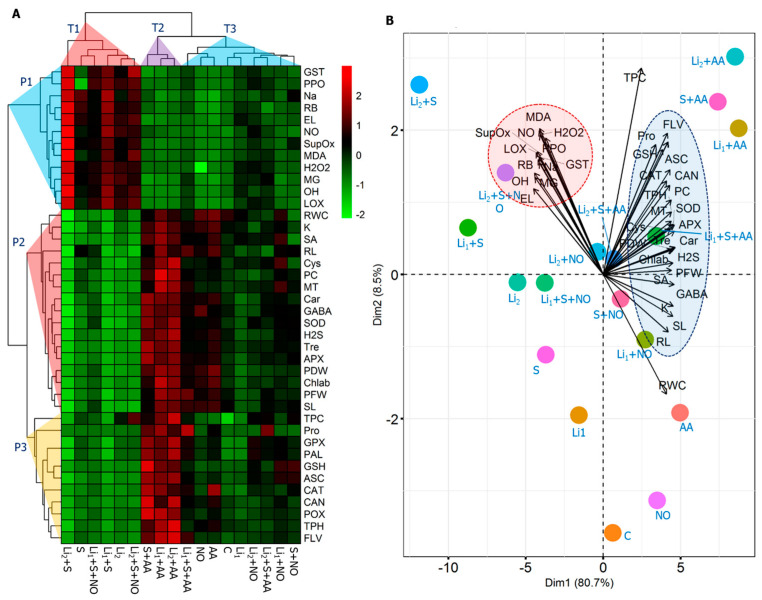
In this study, canola (Brassica napus L.) seedlings were treated with individual and combined salinity and lithium (Li) stress, with and without acetic acid (AA) or nitric acid (NO), to investigate their possible roles against these stresses. Salinity intensified Li-induced damage, and the principal component analysis revealed that this was primarily driven by increased oxidative stress, deregulation of sodium and potassium accumulation, and an imbalance in tissue water content. However, pretreatment with AA and NO prompted growth, re-established sodium and potassium homeostasis, and enhanced the defense system against oxidative and nitrosative damage by triggering the antioxidant capacity. Combined stress negatively impacted phenylalanine ammonia lyase activity, affecting flavonoids, carotenoids, and anthocyanin levels, which were then restored in canola plants primed with AA and NO. Additionally, AA and NO helped to maintain osmotic balance by increasing trehalose and proline levels and upregulating signaling molecules such as hydrogen sulfide, γ-aminobutyric acid, and salicylic acid. Both AA and NO improved Li detoxification by increasing phytochelatins and metallothioneins, and reducing glutathione contents. Comparatively, AA exerted more effective protection against the detrimental effects of combined stress than NO. Our findings offer novel perspectives on the impacts of combining salt and Li stress.

Keywords: antioxidant system; combined stress; exogenous chemicals; heavy metal stress; plant growth; salt stress.


Conflict of interest statement

The authors have no conflicts of interest to disclose.

Figures

Figure 1
Figure 1
Effects of exogenous acetic acid (AA) or nitric oxide (NO) application on (A) shoot length, (B) root length, (C) plant fresh weight, (D) plant dry weight, (E) degree of root browning, (F) relative water content, (G) Chl a+b content, (H) electrolyte leakage, and (I) phenotypic appearance of canola seedlings grown under the presence or absence of different concentrations of lithium (Li) and salinity (S) stress. ‘C’—control (non-treated soil); ‘Li1’— 50 mg Li2CO3 kg−1 soil; ‘Li2’—100 mg Li2CO3 kg−1 soil; ‘S’—100 mM NaCl; ‘AA’—16 mM acetic acid; and ‘NO’—100 μM nitric oxide. Vertical bar diagrams represent the means of three independent replicates (n = 5). Vertical lines at the top of the bars indicate standard errors. Different letters in a graph (where three panels—‘Negative Control’, ‘Treatment: AA’, and ‘Treatment: NO’—together are considered as one graph) represent significant differences based on Tukey’s test at a 5% level of probability (p < 0.05).
Figure 2
Figure 2
Effects of exogenous acetic acid (AA) or nitric oxide (NO) application on (A) superoxide content, (B) hydrogen peroxide content, (C) hydroxy radical content, (D) malondialdehyde content, (E) lipoxygenase activity, and (F) methyl glyoxal content of canola seedlings grown under the absence or presence of different concentrations of lithium (Li) and/or salinity (S) stress. ‘C’—control (nontreated soil); ‘Li1’—50 mg Li2CO3 kg−1 soil; ‘Li2’—100 mg Li2CO3 kg−1 soil; ‘S’—100 mM NaCl; ‘AA’—16 mM acetic acid; and ‘NO’—100 μM nitric oxide. Vertical bar diagrams represent the means of three independent replicates (n = 5). Vertical lines at the top of the bars indicate standard errors. Different letters in a graph (where three panels—‘Negative Control’, ‘Treatment: AA’, and ‘Treatment: NO’—together are considered as one graph) represent significant differences based on Tukey’s test at a 5% level of probability (p < 0.05).
Figure 3
Figure 3
Effects of exogenous acetic acid (AA) and nitric oxide (NO) on (A) ascorbic acid (ASC) content, (B) glutathione (GSH) content, (C) α-Tocopherol (TPH) content, (D) anthocyanins (ACN) content, (E) total phenolic compounds (TPC) content, (F) flavonoids (FLV) content, (G) carotenoids (Car) content, and (H) phenylalanine ammonia lyase (PAL) activity of canola seedlings grown with or without different concentrations of lithium (Li) and salinity (S) stress. ‘C’—control (non-treated soil); ‘Li1’—50 mg Li2CO3 kg−1 soil; ‘Li2’—100 mg Li2CO3 kg−1 soil; ‘S’—100 mM NaCl; ‘AA’—16 mM acetic acid; and ‘NO’—100 μM nitric oxide. Vertical bar diagrams represent the means of three independent replicates (n = 5). Vertical lines at the top of the bars indicate standard errors. Different letters in a graph (where three panels—‘Negative Control’, ‘Treatment: AA’, and ‘Treatment: NO’—together are considered as one graph) represent significant differences based on Tukey’s test at a 5% level of probability (p < 0.05).
Figure 4
Figure 4
Effects of exogenous acetic acid (AA) and nitric oxide (NO) on (A) superoxide dismutase (SOD) activity, (B) catalase (CAT) activity, (C) peroxidase (POX) activity, (D) ascorbate peroxidase (APX) activity, (E) glutathione peroxidase (GPX) activity, and (F) polyphenol oxidase (PPO) activity of canola seedlings grown under the presence or absence of different concentrations of lithium (Li) and/or salinity (S) stress. ‘C’—control (non-treated soil); ‘Li1’—50 mg Li2CO3 kg−1 soil; ‘Li2’—100 mg Li2CO3 kg−1 soil; ‘S’—100 mM NaCl; ‘AA’—16 mM acetic acid; and ‘NO’—100 μM nitric oxide. Vertical bar diagrams represent the means of three independent replicates (n = 5). Vertical lines at the top of the bars indicate standard errors. Different letters in a graph (where three panels—‘Negative Control’, ‘Treatment: AA’, and ‘Treatment: NO’—together are considered as one graph) represent significant differences based on Tukey’s test at a 5% level of probability (p < 0.05).
Figure 5
Figure 5
Effects of exogenous acetic acid (AA) and nitric oxide (NO) on (A) trehalose content, (B) proline content, (C) K+ content, and (D) Na+ content of canola seedlings grown with or without different concentrations of lithium (Li) and/or salinity (S) stress. ‘C’—control (non-treated soil); ‘Li1’—50 mg Li2CO3 kg−1 soil;—‘Li2’—100 mg Li2CO3 kg−1 soil; ‘S’—100 mM NaCl; ‘AA’—16 mM acetic acid; and ‘NO’—100 μM nitric oxide. Vertical bar diagrams represent the means of three independent replicates (n = 5). Vertical lines at the top of the bars indicate standard errors. Different letters in a graph (where three panels—‘Negative Control’, ‘Treatment: AA’, and ‘Treatment: NO’—together are considered as one graph) represent significant differences based on Tukey’s test at a 5% level of probability (p < 0.05).
Figure 6
Figure 6
Effects of exogenous acetic acid (AA) or nitric oxide (NO) on (A) glutathione-S-transferase (GST) content, (B) phytochelatins (PC) content, and (C) metallothioneins (MT) content of canola seedlings grown with and without the presence of different concentrations of lithium (Li) and/or salinity (S) stress. ‘C’—control (non-treated soil); ‘Li1’—50 mg Li2CO3 kg−1 soil; ‘Li2’—100 mg Li2CO3 kg−1 soil; ‘S’—100 mM NaCl; ‘AA’—16 mM acetic acid; and ‘NO’—100 μM nitric oxide. Vertical bar diagrams represent the means of three independent replicates (n = 5). Vertical lines at the top of the bars indicate standard errors. Different letters in a graph (where three panels—‘Negative Control’, ‘Treatment: AA’, and ‘Treatment: NO’—together are considered as one graph) represent significant differences based on Tukey’s test at a 5% level of probability (p < 0.05).
Figure 7
Figure 7
Effects of exogenous acetic acid (AA) or nitric oxide (NO) on (A) endogenous NO content, (B) hydrogen sulfide (H2S) content, (C) cysteine content, and (D) salicylic acid content, and (E) GABA content of canola seedlings grown under the presence or absence of different concentrations of lithium (Li) and/or salinity (S) stress. ‘C’—control (non-treated soil); ‘Li1’—50 mg Li2CO3 kg−1 soil; ‘Li2’—100 mg Li2CO3 kg−1 soil; ‘S’—100 mM NaCl; ‘AA’—16 mM acetic acid; and ‘NO’—100 μM nitric oxide. Vertical bar diagrams represent the means of three independent replicates (n = 5). Vertical lines at the top of the bars indicate standard errors. Different letters in a graph (where three panels—‘Negative Control’, ‘Treatment: AA’, and ‘Treatment: NO’—together are considered as one graph) represent significant differences based on Tukey’s test at a 5% level of probability (p < 0.05).
Figure 8
Figure 8
Heat map with Euclidean distance-based clustering (A) and principal component analyses (B) using all studied parameters. ‘C’—control (non-treated soil); ‘Li1’—50 mg Li2CO3 kg−1 soil; ‘Li2’—100 mg Li2CO3 kg−1 soil; ‘S’—100 mM NaCl; ‘AA’—16 mM acetic acid; and ‘NO’—100 μM nitric oxide.

Similar articles

Cited by

References

    1. Kumar S., Li G., Yang J., Huang X., Ji Q., Liu Z., Ke W., Hou H. Effect of Salt Stress on Growth, Physiological Parameters, and Ionic Concentration of Water Dropwort (Oenanthe javanica) Cultivars. Front. Plant Sci. 2021;12:660409. doi: 10.3389/fpls.2021.660409. - DOI - PMC - PubMed
    1. FAO . Global Map of Salt-Affected Soils 2021. FAO; Rome, Italy: 2021.
    1. Shabbir R., Singhal R.K., Mishra U.N., Chauhan J., Javed T., Hussain S., Kumar S., Anuragi H., Lal D., Chen P. Combined Abiotic Stresses: Challenges and Potential for Crop Improvement. Agronomy. 2022;12:2795. doi: 10.3390/agronomy12112795. - DOI
    1. Zhang H., Sonnewald U. Differences and Commonalities of Plant Responses to Single and Combined Stresses. Plant J. 2017;90:839–855. doi: 10.1111/tpj.13557. - DOI - PubMed
    1. Hoque T.S., Sohag A.A.M., Kordrostami M., Hossain M.A., Islam M.S., Burritt D.J., Hossain M.A. The Effect of Exposure to a Combination of Stressors on Rice Productivity and Grain Yields. In: Roychoudhury A., editor. Rice Research for Quality Improvement: Genomics and Genetic Engineering: Volume 1: Breeding Techniques and Abiotic Stress Tolerance. Springer; Singapore: 2020. pp. 675–727.

LinkOut - more resources