

M-Encapsulated Be12O12 Nano-Cage (M = K, Mn, or Cu) for CH2O Sensing Applications: A Theoretical Study
- PMID: 38202462
- PMCID: PMC10780420
- DOI: 10.3390/nano14010007
M-Encapsulated Be12O12 Nano-Cage (M = K, Mn, or Cu) for CH2O Sensing Applications: A Theoretical Study
Abstract
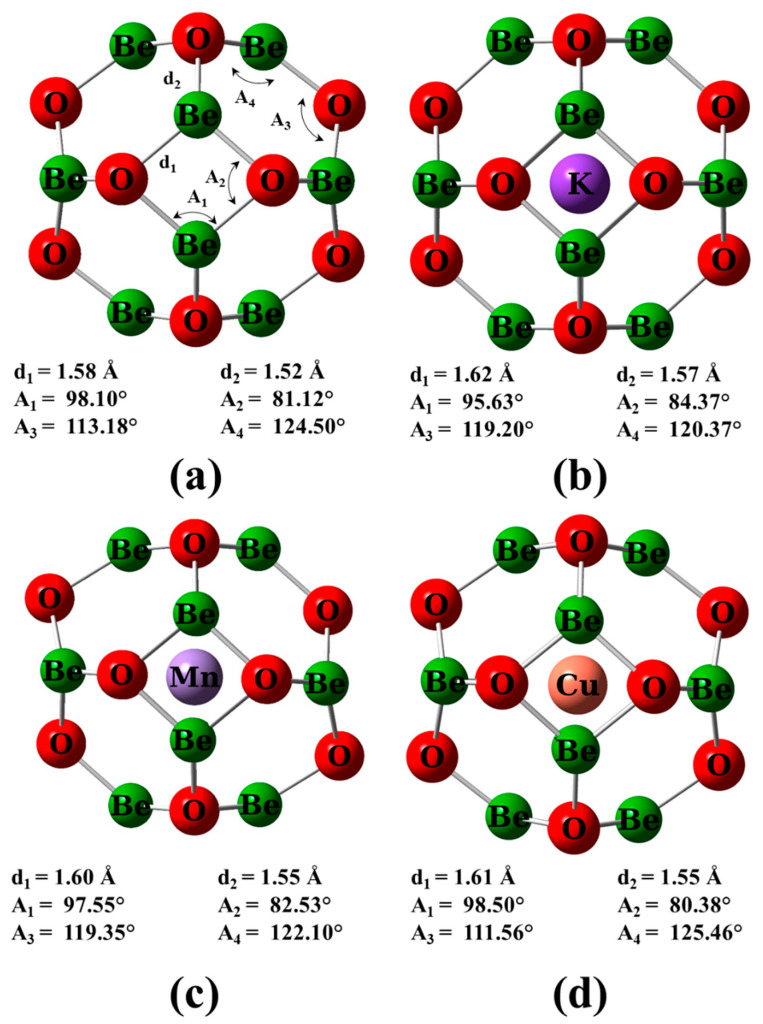
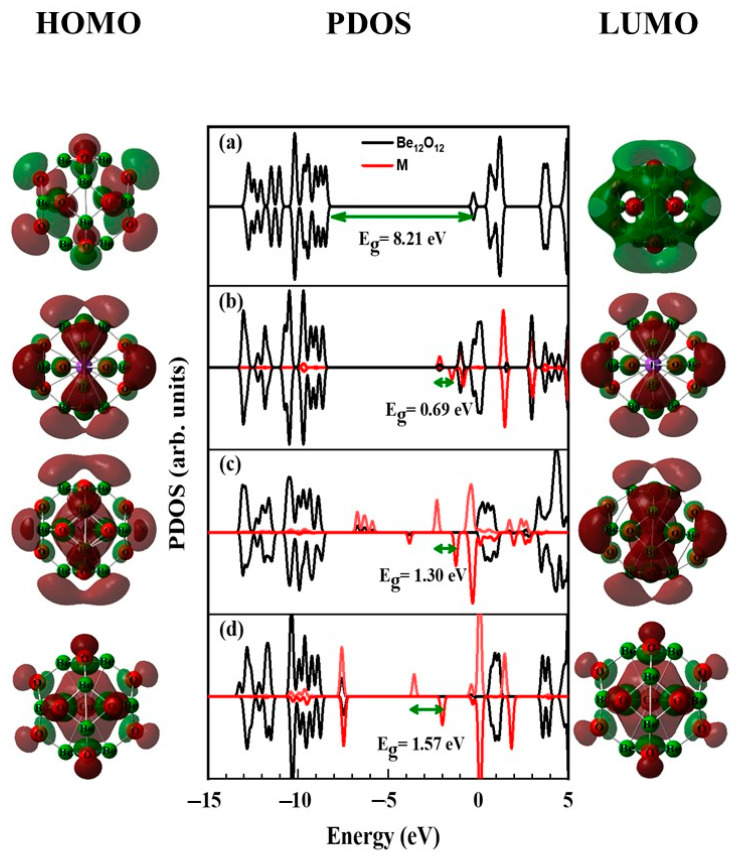
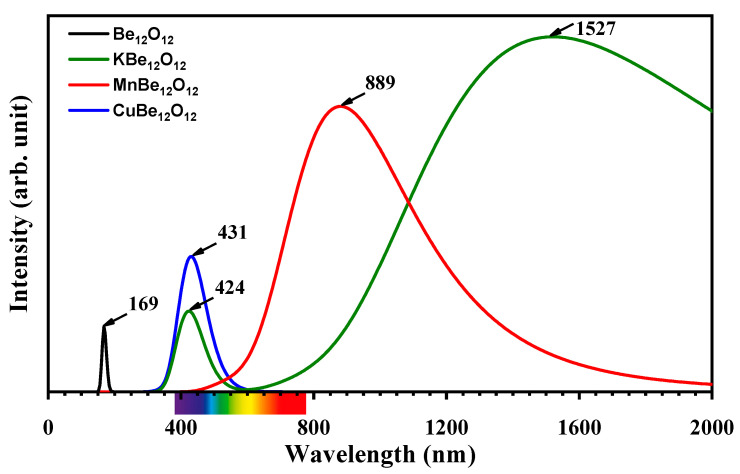
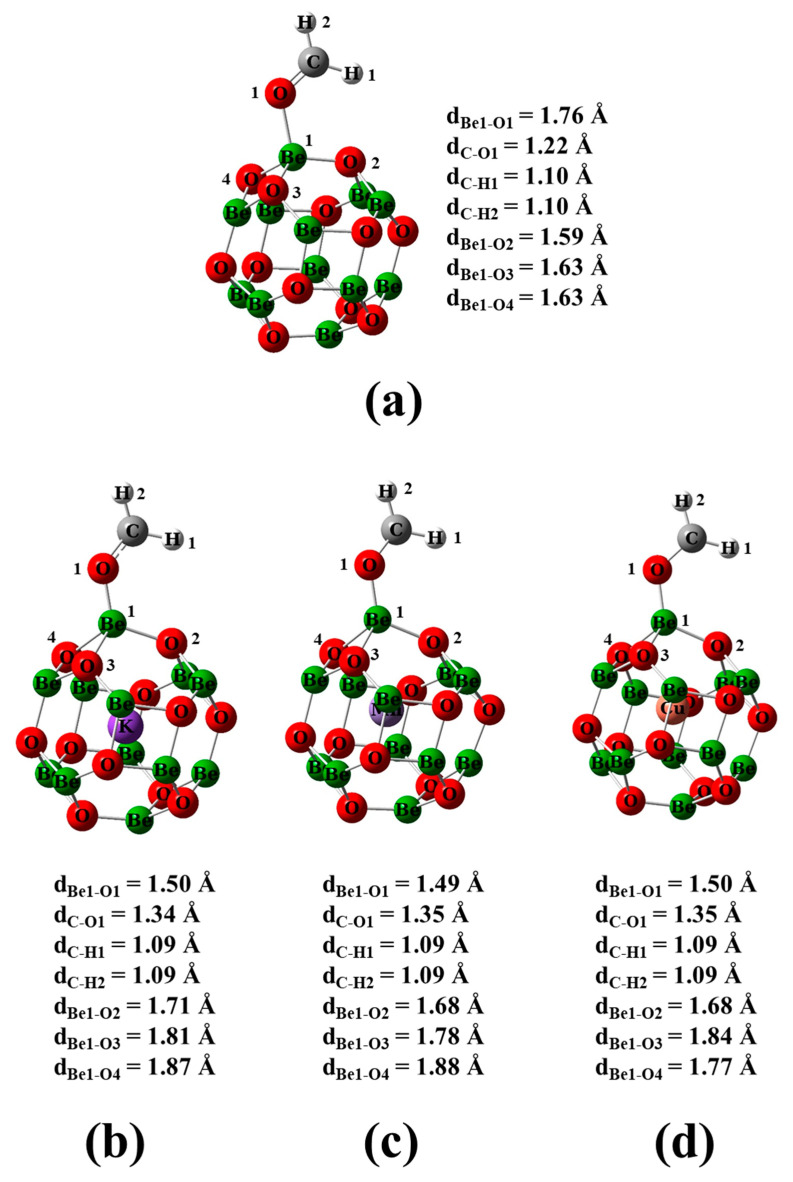
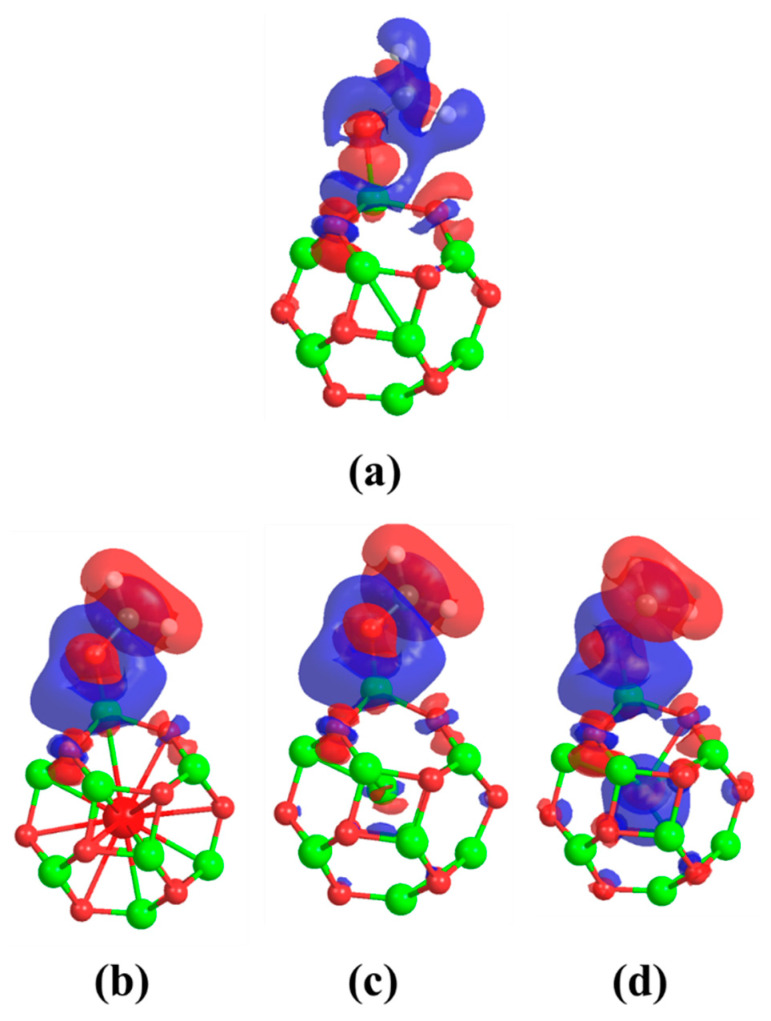
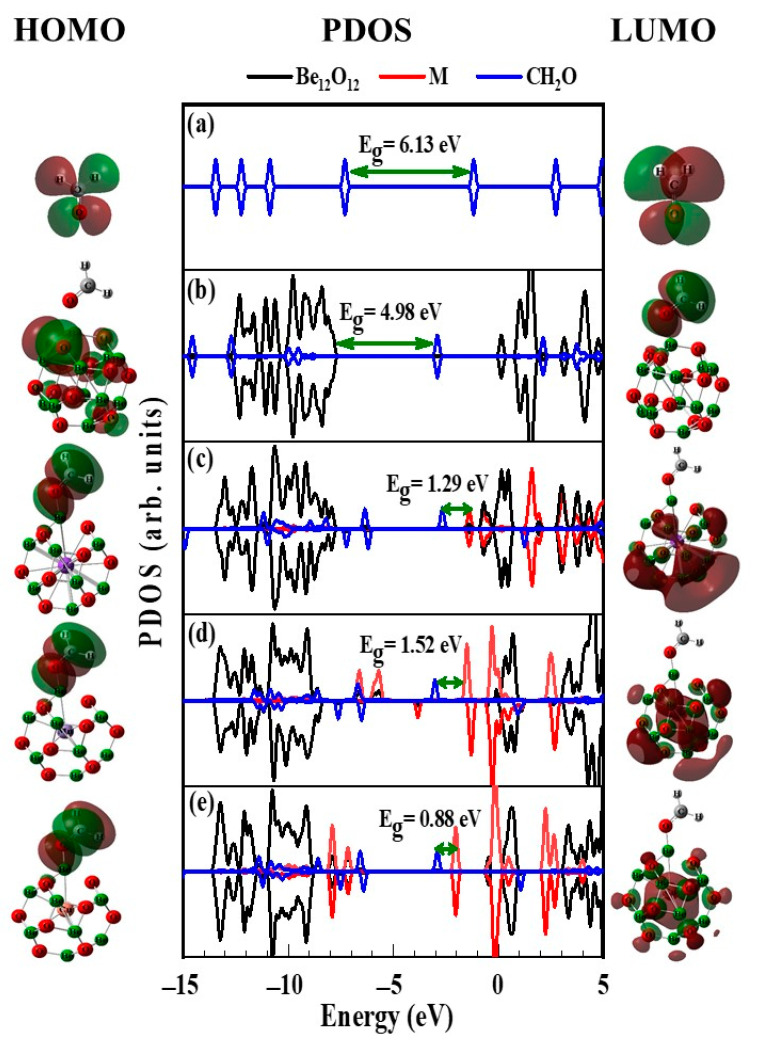
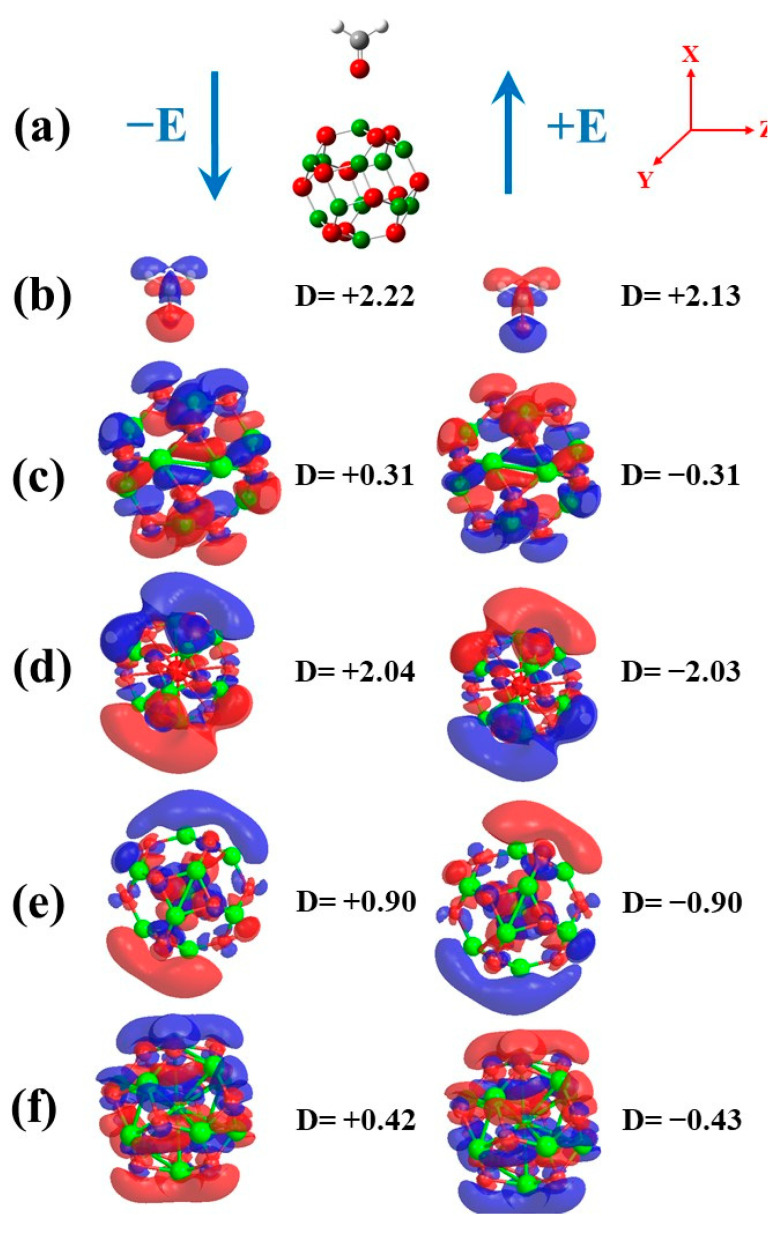
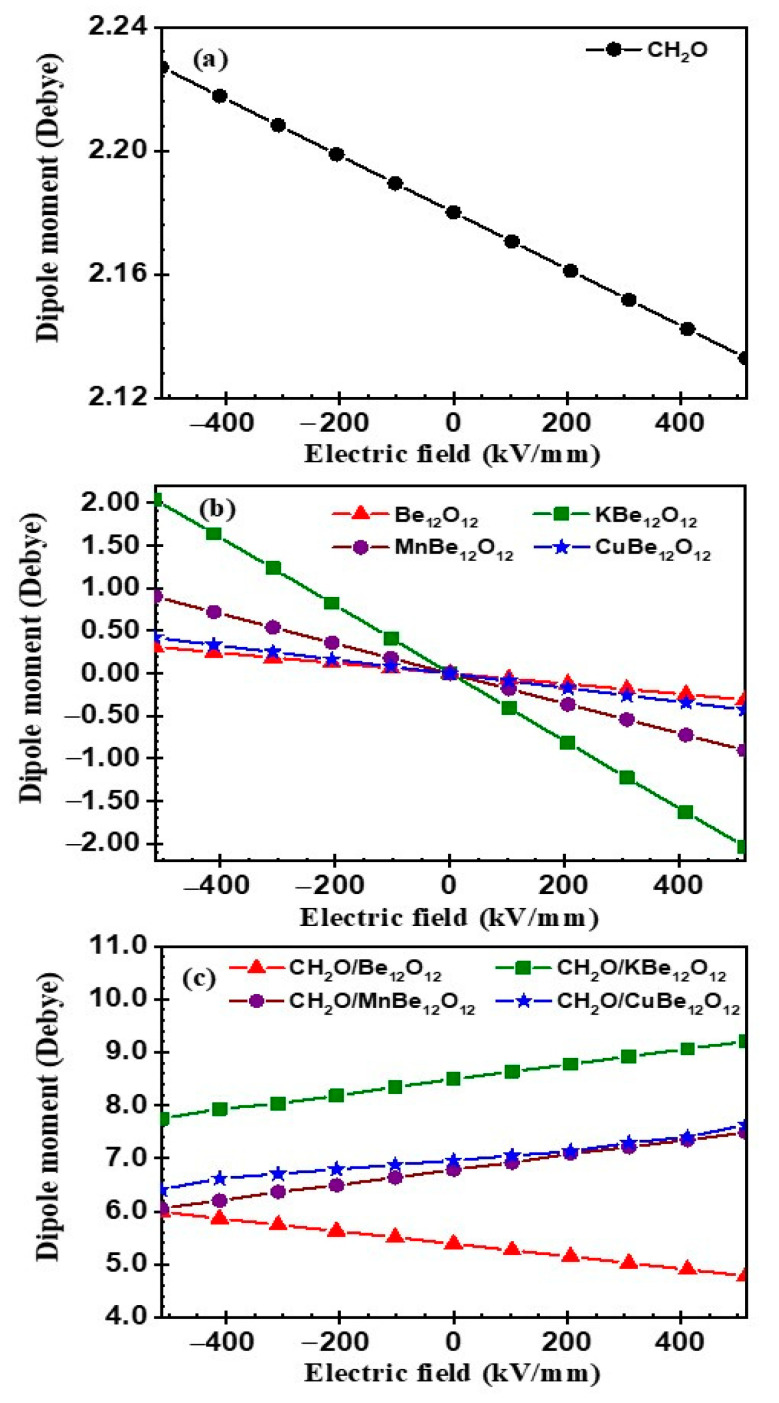
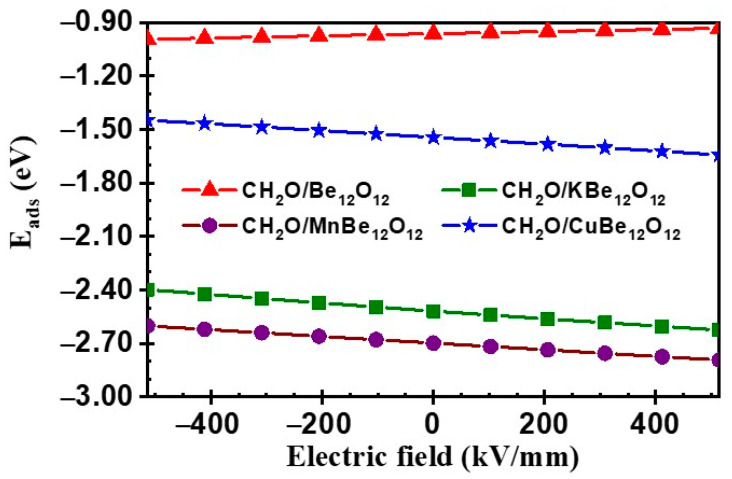
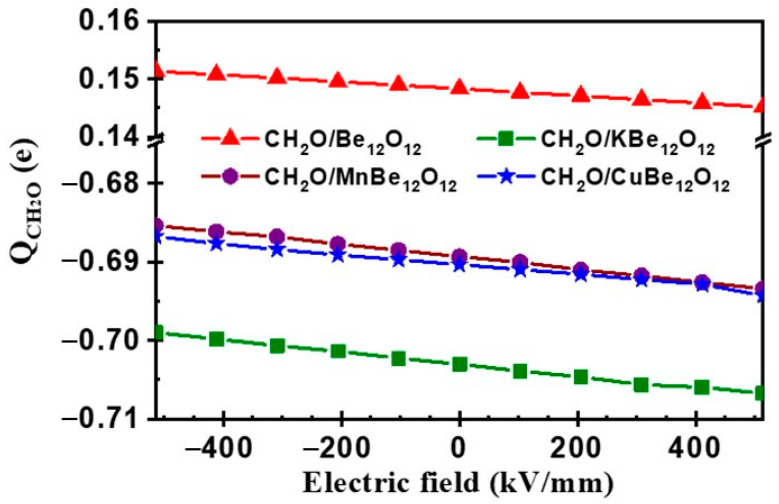
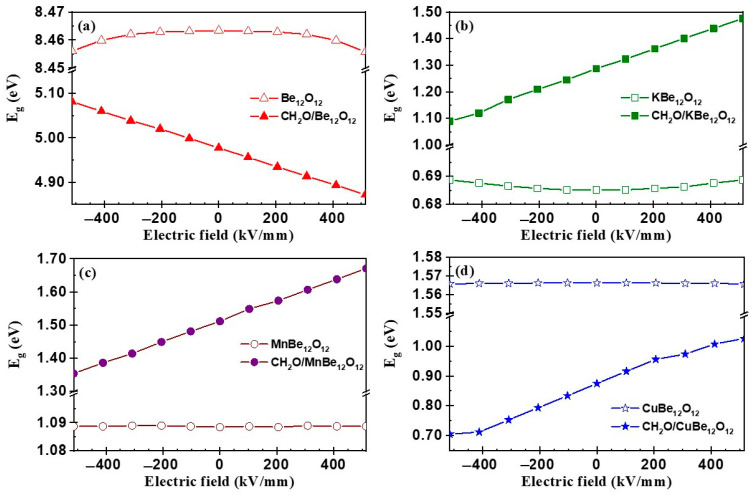
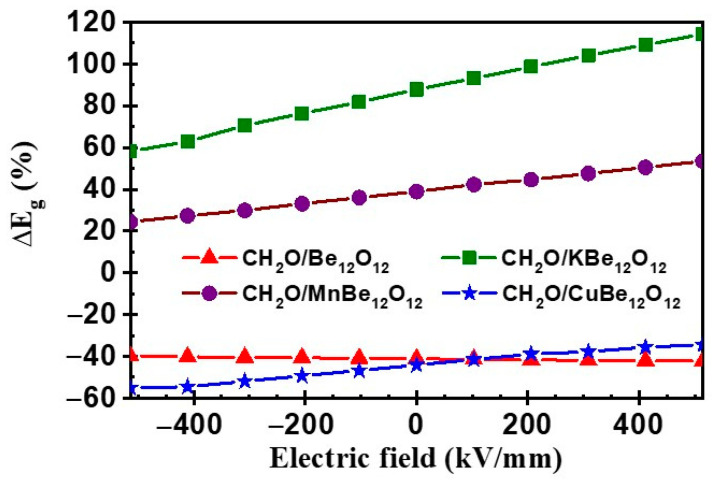
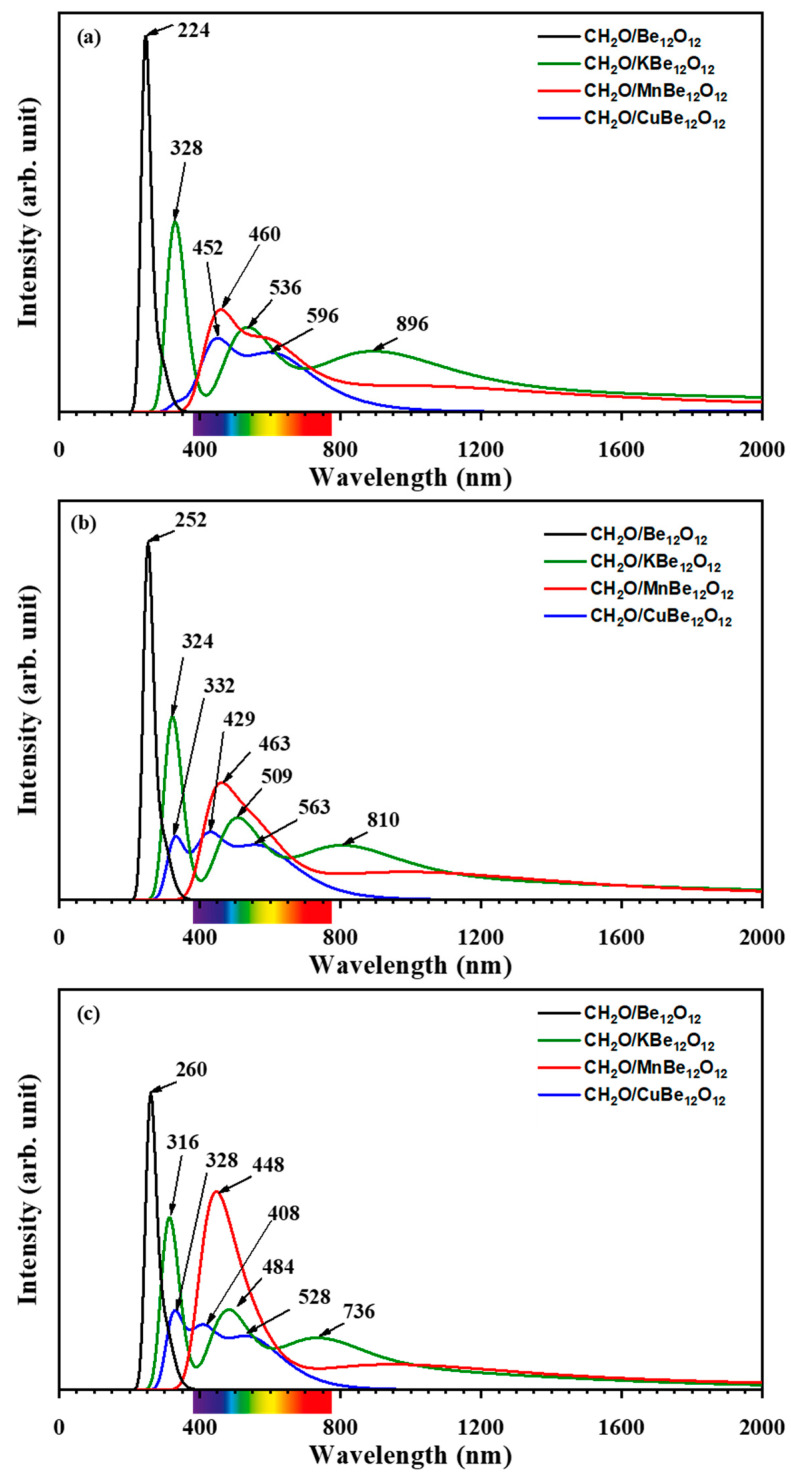
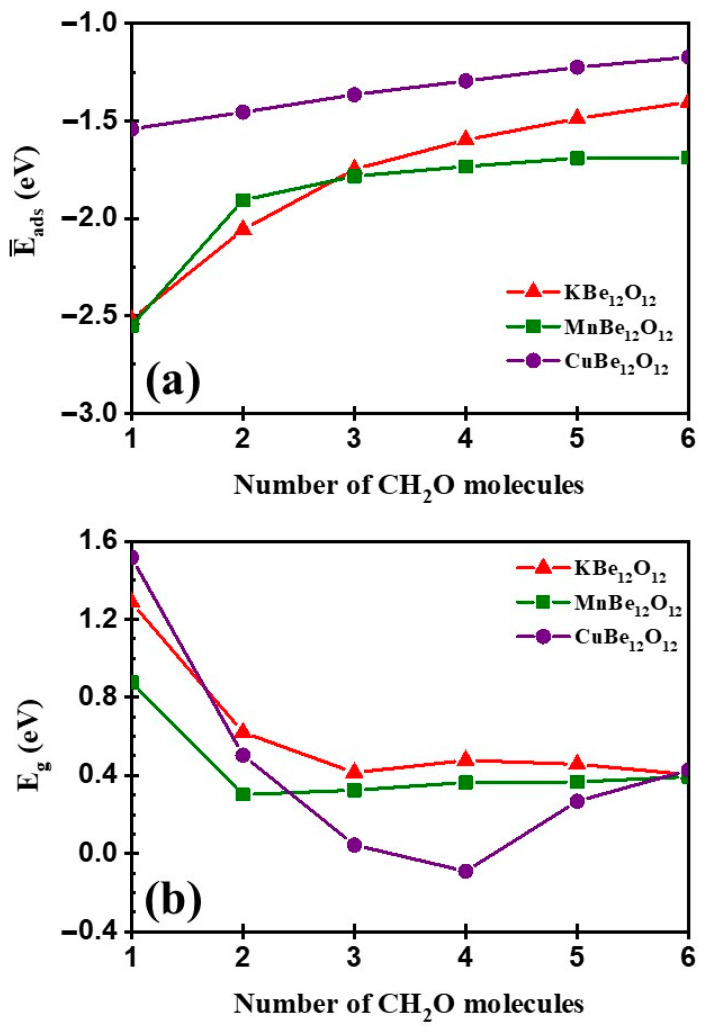
DFT and TD-DFT studies of B3LYP/6-31 g(d,p) with the D2 version of Grimme's dispersion are used to examine the adsorption of a CH2O molecule on Be12O12 and MBe12O12 nano-cages (M = K, Mn, or Cu atom). The energy gap for Be12O12 was 8.210 eV, while the M encapsulation decreased its value to 0.685-1.568 eV, whereas the adsorption of the CH2O gas decreased the Eg values for Be12O12 and CuBe12O12 to 4.983 and 0.876 eV and increased its values for KBe12O12 and MnBe12O12 to 1.286 and 1.516 eV, respectively. The M encapsulation enhanced the chemical adsorption of CH2O gas with the surface of Be12O12. The UV-vis spectrum of the Be12O12 nano-cage was dramatically affected by the M encapsulation as well as the adsorption of the CH2O gas. In addition, the adsorption energies and the electrical sensitivity of the Be12O12 as well as the MBe12O12 nano-cages to CH2O gas could be manipulated with an external electric field. Our results may be fruitful for utilizing Be12O12 as well as MBe12O12 nano-cages as candidate materials for removing and sensing formaldehyde gas.
Keywords: DFT and TD-DFT; adsorption; alkali and transition metals; beryllium oxide; formaldehyde; sensor.
Conflict of interest statement
The authors declare no conflict of interest.
Figures
Similar articles
-
Mg12O12 and Be12O12 Nanocages as Sorbents and Sensors for H2S and SO2 Gases: A Theoretical Approach.Nanomaterials (Basel). 2022 May 21;12(10):1757. doi: 10.3390/nano12101757. Nanomaterials (Basel). 2022. PMID: 35630981 Free PMC article.
-
DFT-D3 and TD-DFT Studies of the Adsorption and Sensing Behavior of Mn-Phthalocyanine toward NH3, PH3, and AsH3 Molecules.Molecules. 2024 May 7;29(10):2168. doi: 10.3390/molecules29102168. Molecules. 2024. PMID: 38792030 Free PMC article.
-
A Comparative DFT Investigation of the Adsorption of Temozolomide Anticancer Drug over Beryllium Oxide and Boron Nitride Nanocarriers.ACS Omega. 2024 May 30;9(23):25203-25214. doi: 10.1021/acsomega.4c02882. eCollection 2024 Jun 11. ACS Omega. 2024. PMID: 38882172 Free PMC article.
-
A DFT investigation on the potential of beryllium oxide (Be12O12) as a nanocarrier for nucleobases.PLoS One. 2024 Nov 22;19(11):e0313885. doi: 10.1371/journal.pone.0313885. eCollection 2024. PLoS One. 2024. PMID: 39576836 Free PMC article.
-
Hydrogen bond strengthening between o-nitroaniline and formaldehyde in electronic excited states: A theoretical study.Spectrochim Acta A Mol Biomol Spectrosc. 2018 Jun 15;199:194-201. doi: 10.1016/j.saa.2018.03.062. Epub 2018 Mar 24. Spectrochim Acta A Mol Biomol Spectrosc. 2018. PMID: 29605783 Review.
References
-
- Bunev V.A., Shvartsberg V.M., Babkin V.S. Distribution of O atoms from CH2O molecules in the combustion products of formaldehyde. Mendeleev Commun. 2015;25:157–158. doi: 10.1016/j.mencom.2015.03.029. - DOI
-
- Jin W., Chen G., Duan X., Yin Y., Ye H., Wang D., Yu J., Mei X., Wu Y. Adsorption behavior of formaldehyde on ZnO(101¯0)surface: A first principles study. Appl. Surf. Sci. 2017;423:451–456. doi: 10.1016/j.apsusc.2017.06.125. - DOI
-
- Henda M., Sadon S.H., Abdelmalek Z., Li Z., Le Q.H. Removal of formaldehyde pollutant from petroleum industry wastewaters by polymers: A molecular dynamics simulation. Eng. Anal. Bound. Elem. 2023;151:400–405. doi: 10.1016/j.enganabound.2023.03.017. - DOI
-
- Ammar H.Y. CH2O Adsorption on M (M = Li, Mg and Al) Atom Deposited ZnO Nano-Cage: DFT Study. Key Eng. Mater. 2018;786:384–392. doi: 10.4028/www.scientific.net/KEM.786.384. - DOI
-
- Ammar H., Eid K., Badran H. Interaction and detection of formaldehyde on pristine and doped boron nitride nano-cage: DFT calculations. Mater. Today Commun. 2020;25:101408. doi: 10.1016/j.mtcomm.2020.101408. - DOI
Grants and funding
LinkOut - more resources
Full Text Sources
Miscellaneous
