

Hexagonal Boron Nitride as Filler for Silica-Based Elastomer Nanocomposites
- PMID: 38202486
- PMCID: PMC10780802
- DOI: 10.3390/nano14010030
Hexagonal Boron Nitride as Filler for Silica-Based Elastomer Nanocomposites
Abstract
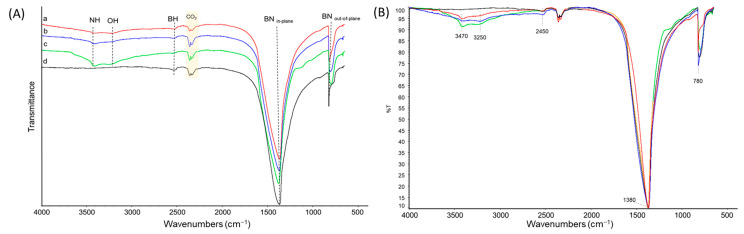
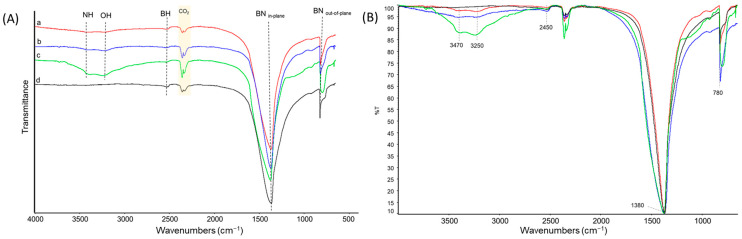
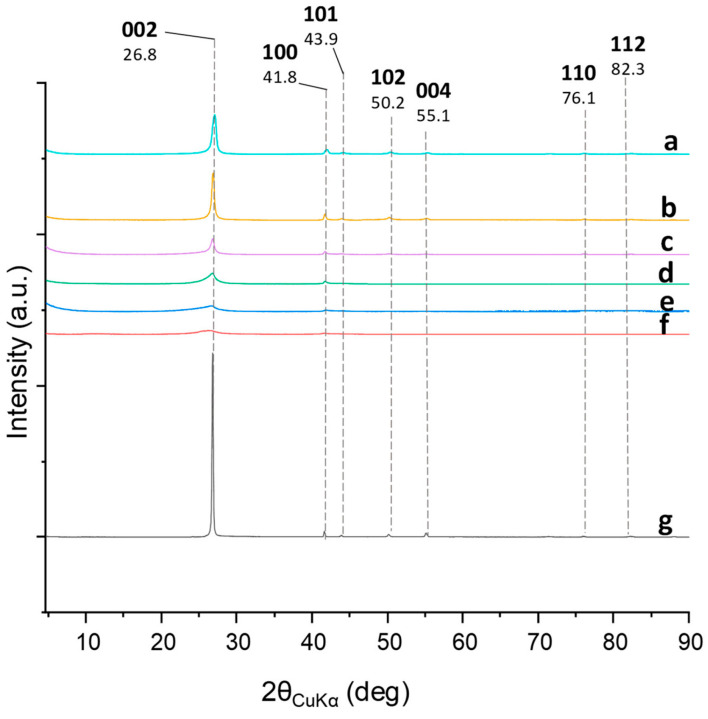
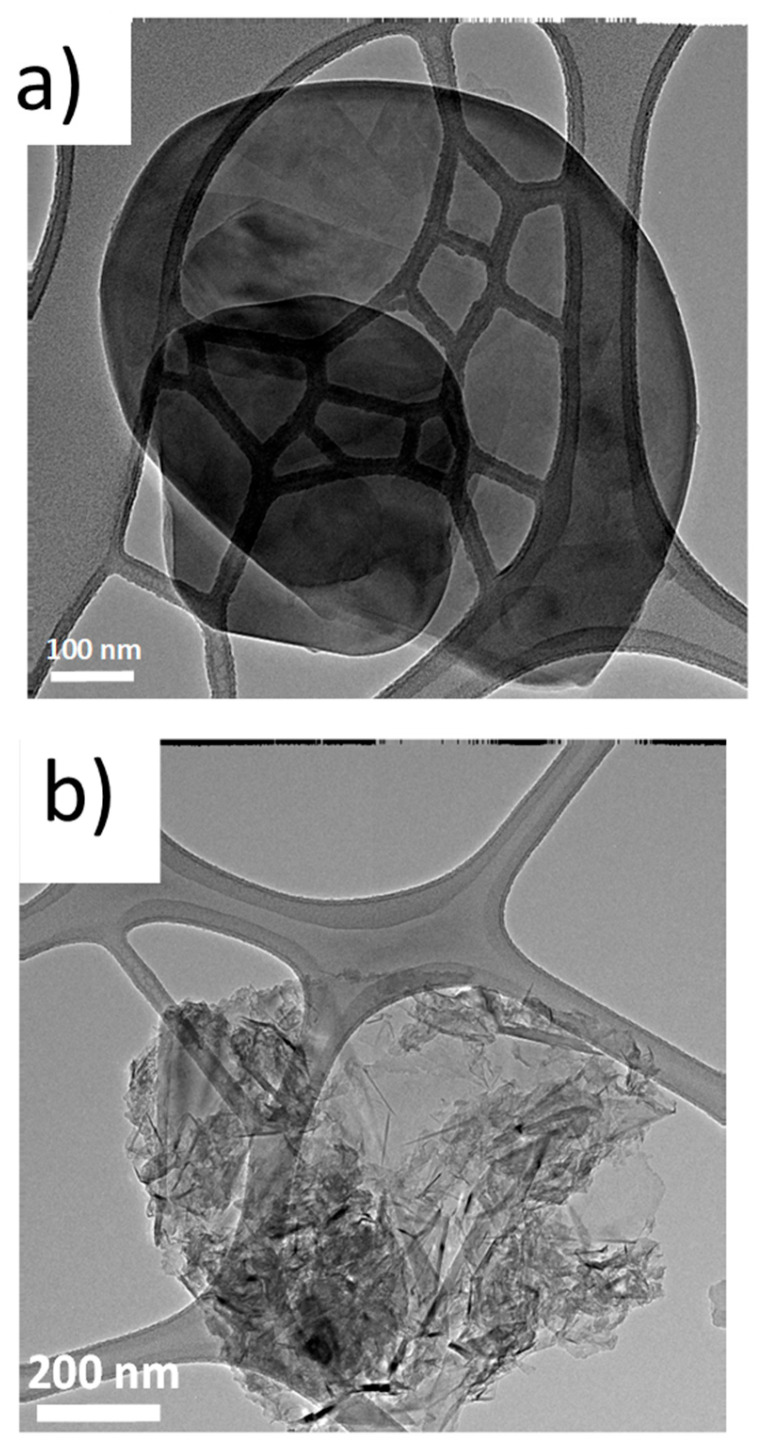
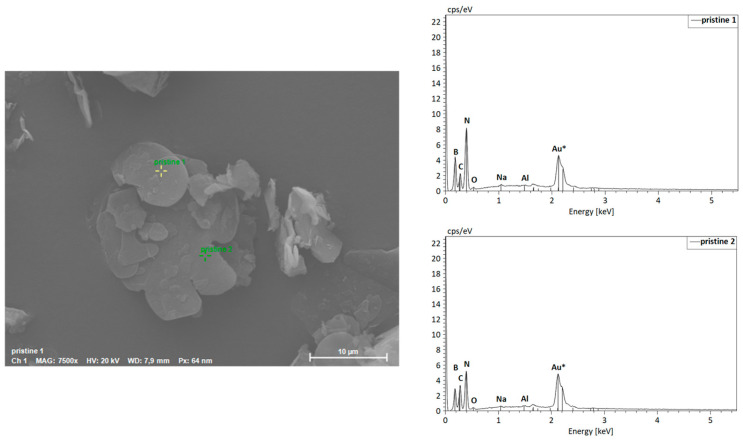
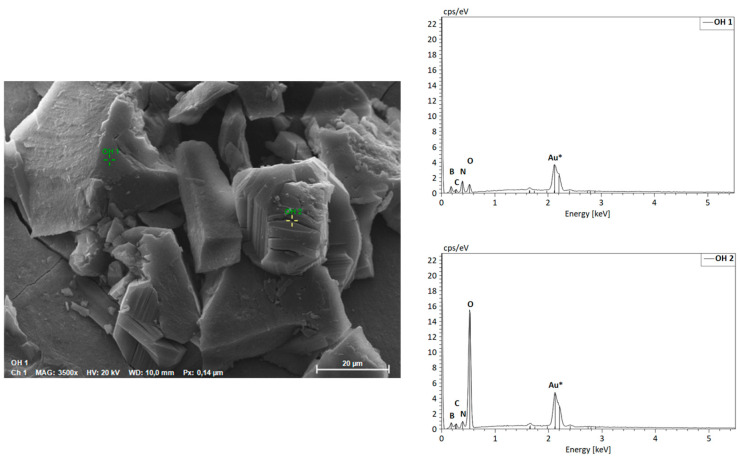
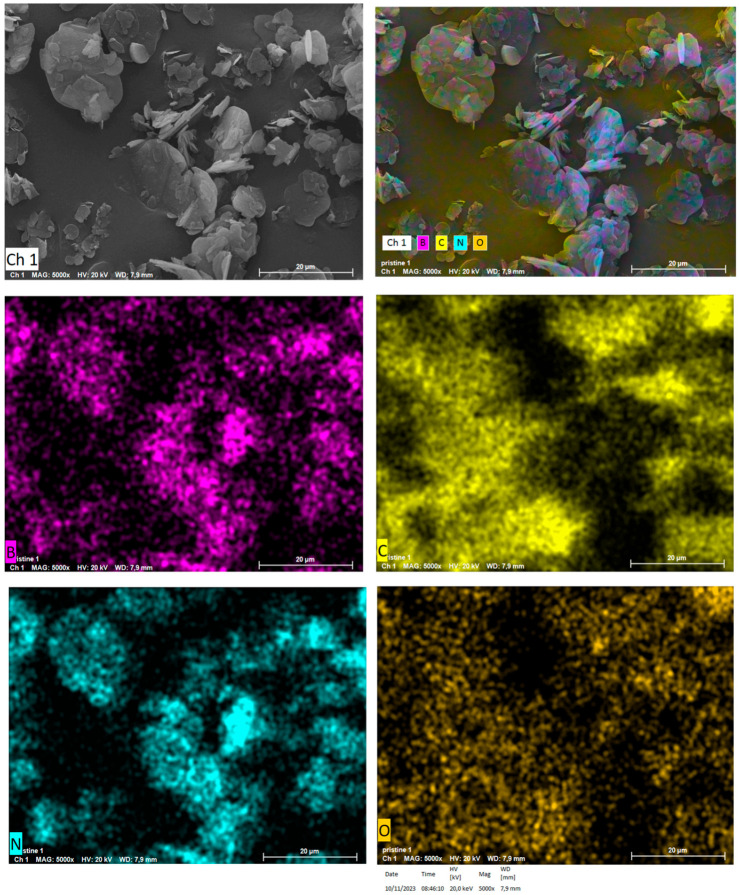
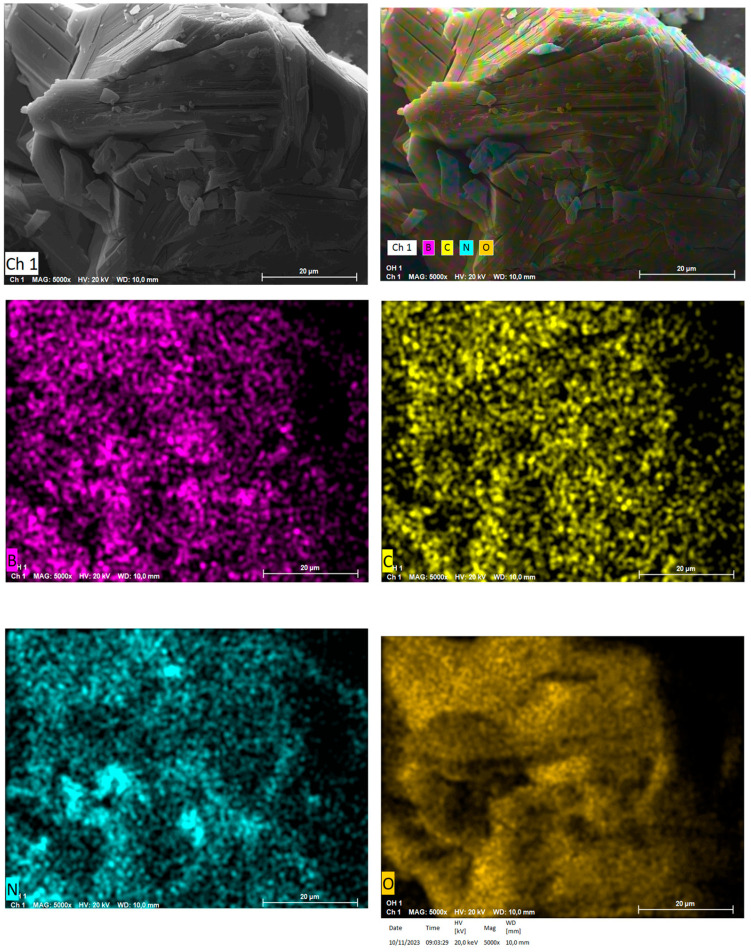
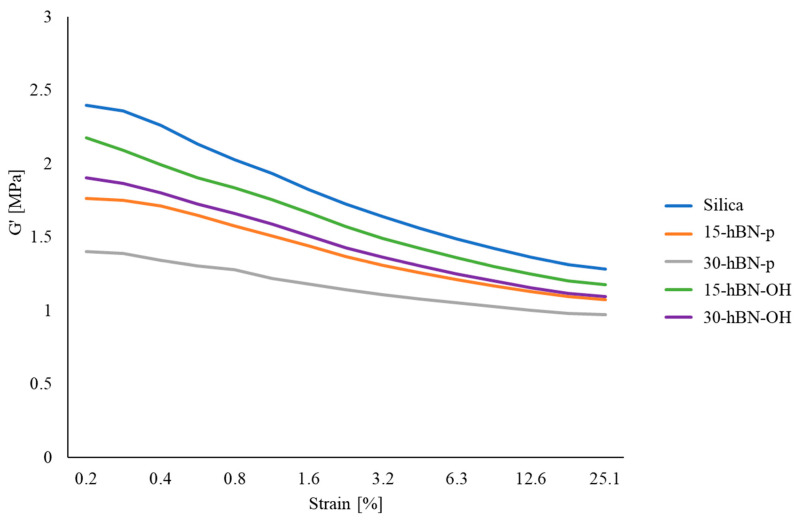
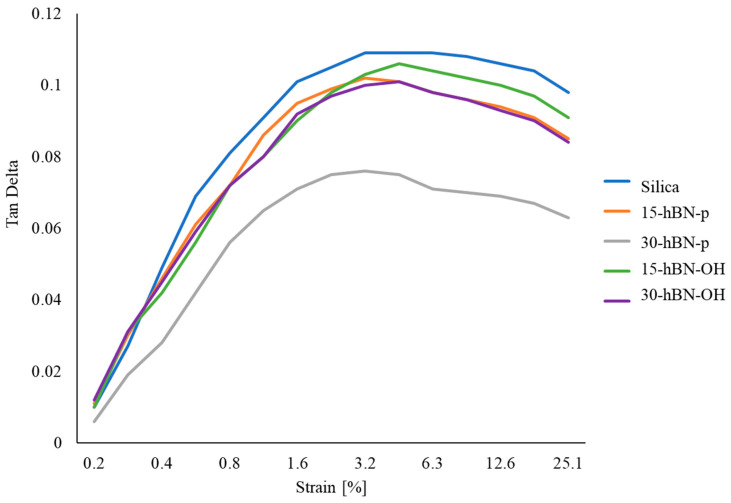
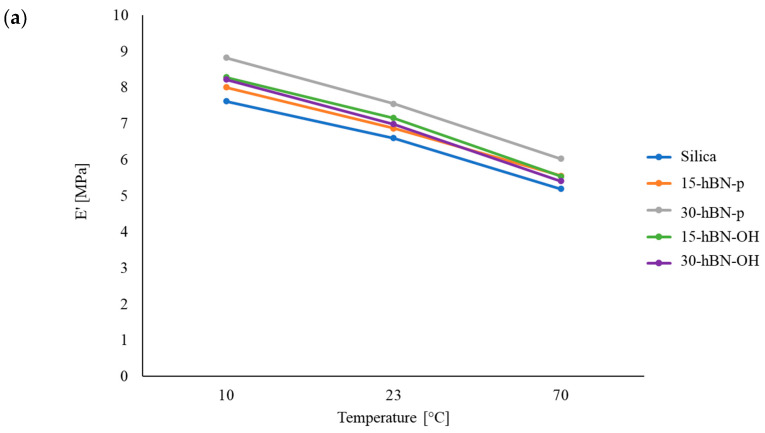
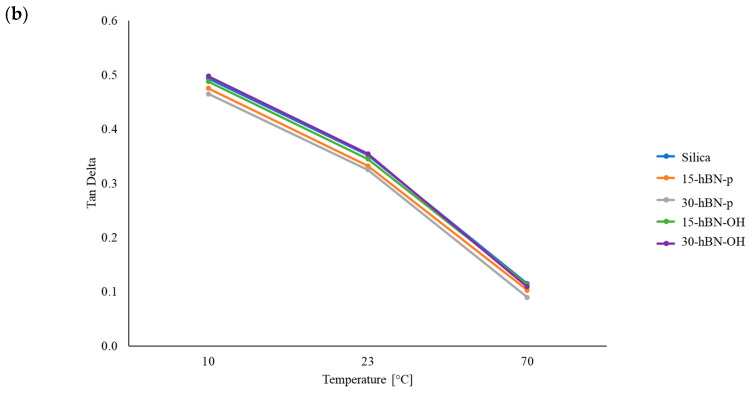
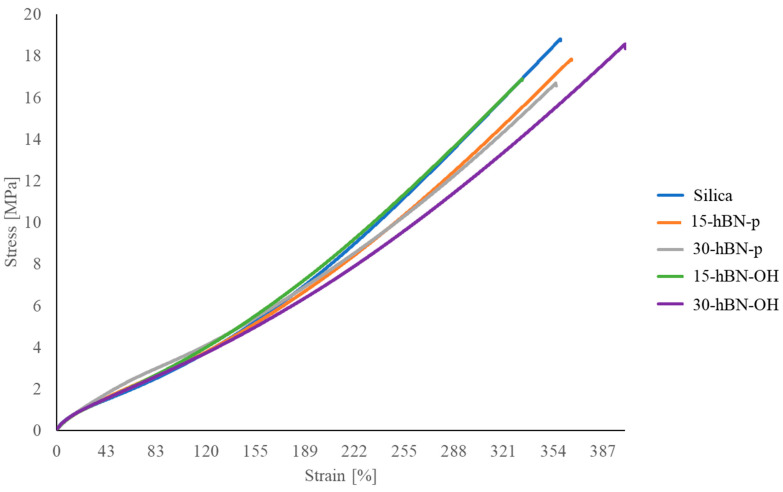
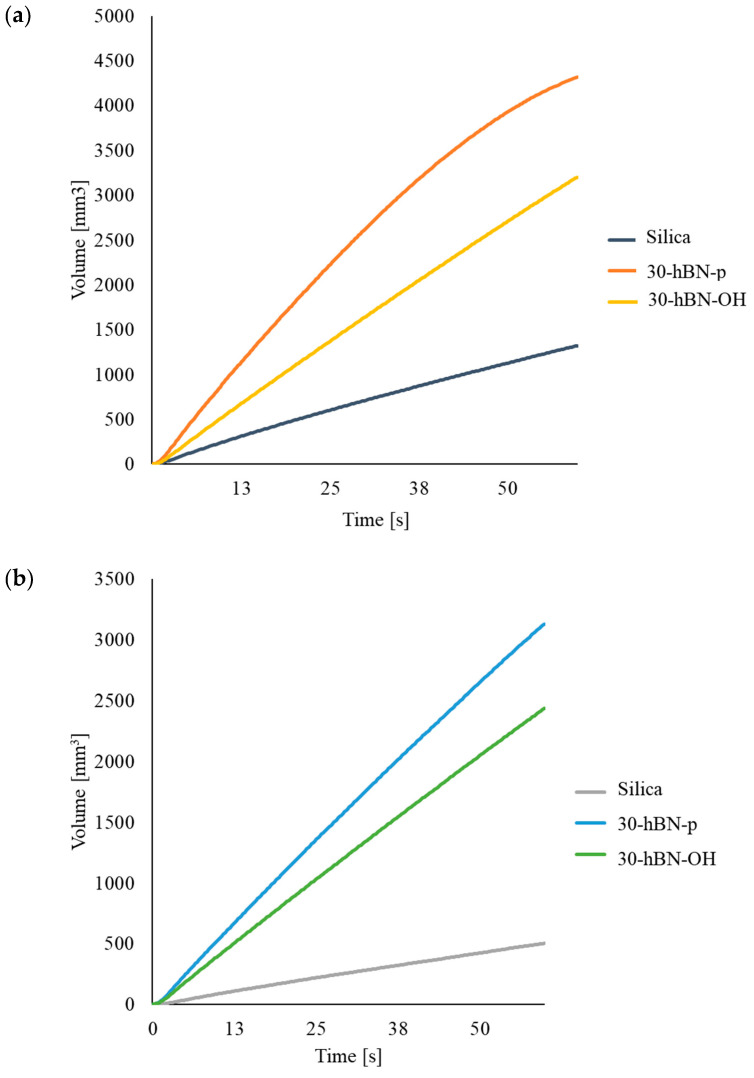
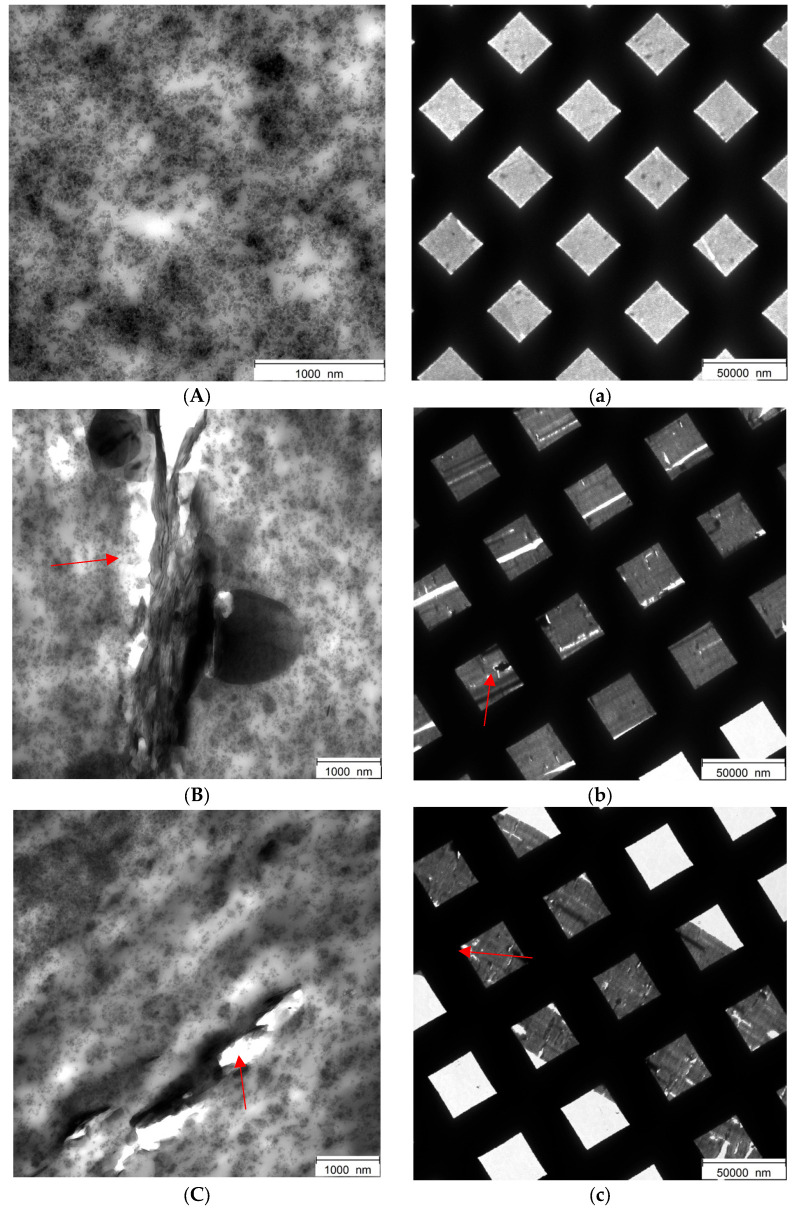
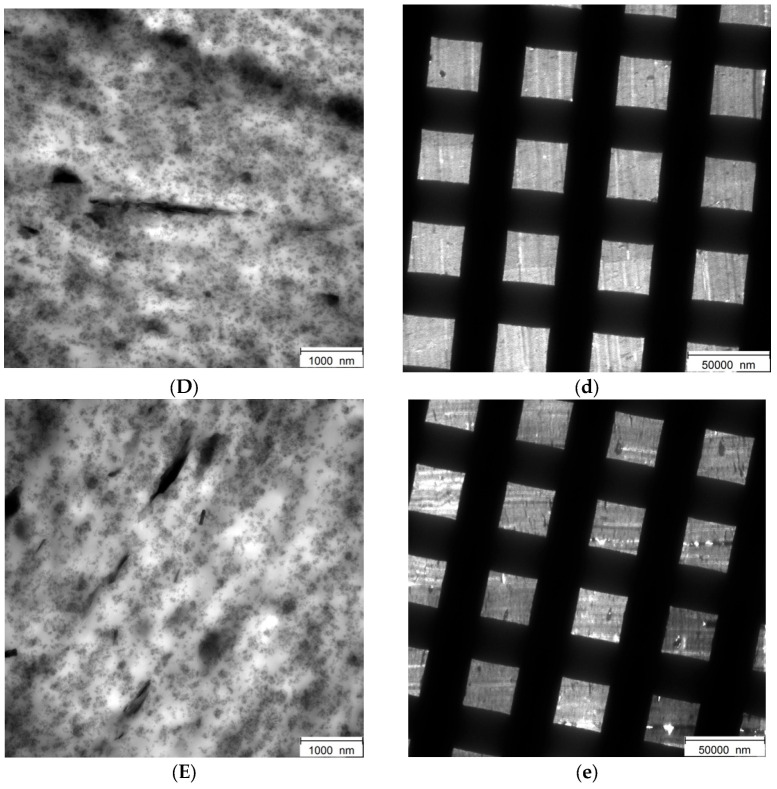
Two-dimensional hexagonal boron nitride (hBN) has attracted tremendous attention over the last few years, thanks to its stable structure and its outstanding properties, such as mechanical strength, thermal conductivity, electrical insulation, and lubricant behavior. This work demonstrates that hBN can also improve the rheological and mechanical properties of elastomer composites when used to partially replace silica. In this work, commercially available pristine hBN (hBN-p) was exfoliated and ball-mill treated in air for different durations (2.5, 5, and 10 h milling). Functionalization occurred with the -NH and -OH groups (hBN-OH). The functional groups were detected using Fourier-Transform Infrared pectroscopy (FT-IR) and were estimated to be up to about 7% through thermogravimetric analysis. The presence of an increased amount of oxygen in hBN-OH was confirmed using Scanning Electron Microscopy coupled with Energy-Dispersive X-ray Spectroscopy. (SEM-EDS). The number of stacked layers, estimated using WAXD analysis, decreased to 8-9 in hBN-OH (10 h milling) from about 130 in hBN-p. High-resolution transmission electron microscopy (HR-TEM) and SEM-EDS revealed the increase in disorder in hBN-OH. hBN-p and hBN-OH were used to partially replace silica by 15% and 30%, respectively, by volume, in elastomer composites based on poly(styrene-co-butadiene) from solution anionic polymerization (S-SBR) and poly(1,4-cis-isoprene) from Hevea Brasiliensis (natural rubber, NR) as the elastomers (volume (mm3) of composites released by the instrument). The use of both hBNs in substitution of 30% of silica led to a lower Payne effect, a higher dynamic rigidity, and an increase in E' of up to about 15% at 70 °C, with similar/lower hysteresis. Indeed, the composites with hBN-OH revealed a better balance of tan delta (higher at low temperatures and lower at high temperatures) and better ultimate properties. The functional groups reasonably promote the interaction of hBN with silica and with the silica's coupling agent, sulfur-based silane, and thus promoted the interaction with the elastomer chains. The volume of the composite, measured using a high-pressure capillary viscometer, increased by about 500% and 400% after one week of storage in the presence of hBN-p and hBN-OH. Hence, both hBNs improved the processability and the shelf life of the composites. Composites obtained using hBN-OH had even filler dispersion without the detachments of the filler from the elastomer matrix, as shown through TEM micrographs. These results pave the way for substantial improvements in the important properties of silica-based composites for tire compounds, used to reduce rolling resistance and thus the improve environmental impacts.
Keywords: 2D nanomaterials; h-BN functionalization; lower Payne effect; rubber compounds.
Conflict of interest statement
The authors declare no conflict of interest.
Figures

Similar articles
-
Carbon Black Functionalized with Serinol Pyrrole to Replace Silica in Elastomeric Composites.Polymers (Basel). 2024 Apr 26;16(9):1214. doi: 10.3390/polym16091214. Polymers (Basel). 2024. PMID: 38732683 Free PMC article.
-
Adducts of Carbon Black with a Biosourced Janus Molecule for Elastomeric Composites with Lower Dissipation of Energy.Polymers (Basel). 2023 Jul 22;15(14):3120. doi: 10.3390/polym15143120. Polymers (Basel). 2023. PMID: 37514509 Free PMC article.
-
Cross-Linking-Filler Composite Materials of Functionalized Hexagonal Boron Nitride and Polyrotaxane Elastomer.ACS Macro Lett. 2023 Jan 17;12(1):48-53. doi: 10.1021/acsmacrolett.2c00636. Epub 2022 Dec 23. ACS Macro Lett. 2023. PMID: 36562729
-
Bio-Based Pyrrole Compounds Containing Sulfur Atoms as Coupling Agents of Carbon Black with Unsaturated Elastomers.Nanomaterials (Basel). 2023 Oct 14;13(20):2761. doi: 10.3390/nano13202761. Nanomaterials (Basel). 2023. PMID: 37887912 Free PMC article.
-
Renewable proteins from agricultural and animal sources as innovative multifunctional bio-fillers for rubber composites: A comprehensive review.Int J Biol Macromol. 2025 Jan;284(Pt 1):137941. doi: 10.1016/j.ijbiomac.2024.137941. Epub 2024 Nov 22. Int J Biol Macromol. 2025. PMID: 39579809 Review.
Cited by
-
Optimization of UV-Curable Polyurethane Acrylate Coatings with Hexagonal Boron Nitride (hBN) for Improved Mechanical and Adhesive Properties.Polymers (Basel). 2024 Sep 9;16(17):2544. doi: 10.3390/polym16172544. Polymers (Basel). 2024. PMID: 39274176 Free PMC article.
References
-
- Boehm H.P., Clauss A., Fischer G.O., Hofmann U. Das adsorptionsverhalten sehr dünner kohlenstoff-folien. Z. Für Anorg. Und Allg. Chem. 1962;316:119–127. doi: 10.1002/zaac.19623160303. - DOI
-
- Geim A.K., Novoselov K.S. Nanoscience and Technology: A Collection of Reviews from Nature Journals. World Scientific; Singapore: 2010. The rise of graphene; p. 11.
LinkOut - more resources
Full Text Sources
