. 2023 Dec 28;14(1):91.
doi: 10.3390/nano14010091.

In Vivo Evaluation of Bone Regenerative Capacity of the Novel Nanobiomaterial: β-Tricalcium Phosphate Polylactic Acid-co-Glycolide (β-TCP/PLLA/PGA) for Use in Maxillofacial Bone Defects

Affiliations

In Vivo Evaluation of Bone Regenerative Capacity of the Novel Nanobiomaterial: β-Tricalcium Phosphate Polylactic Acid-co-Glycolide (β-TCP/PLLA/PGA) for Use in Maxillofacial Bone Defects

Mrunalini Ramanathan et al. Nanomaterials (Basel). .

Abstract

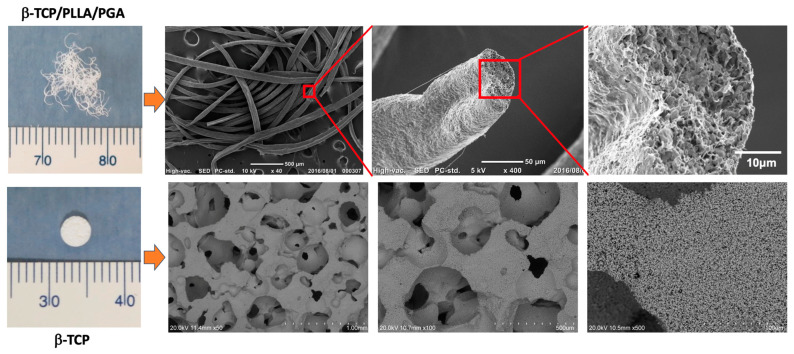
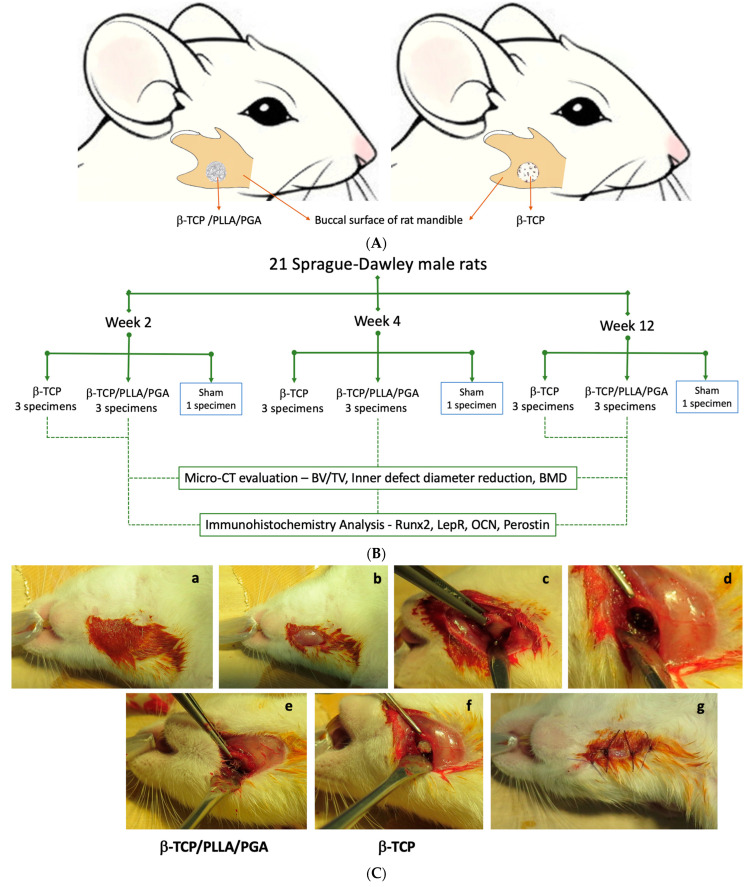
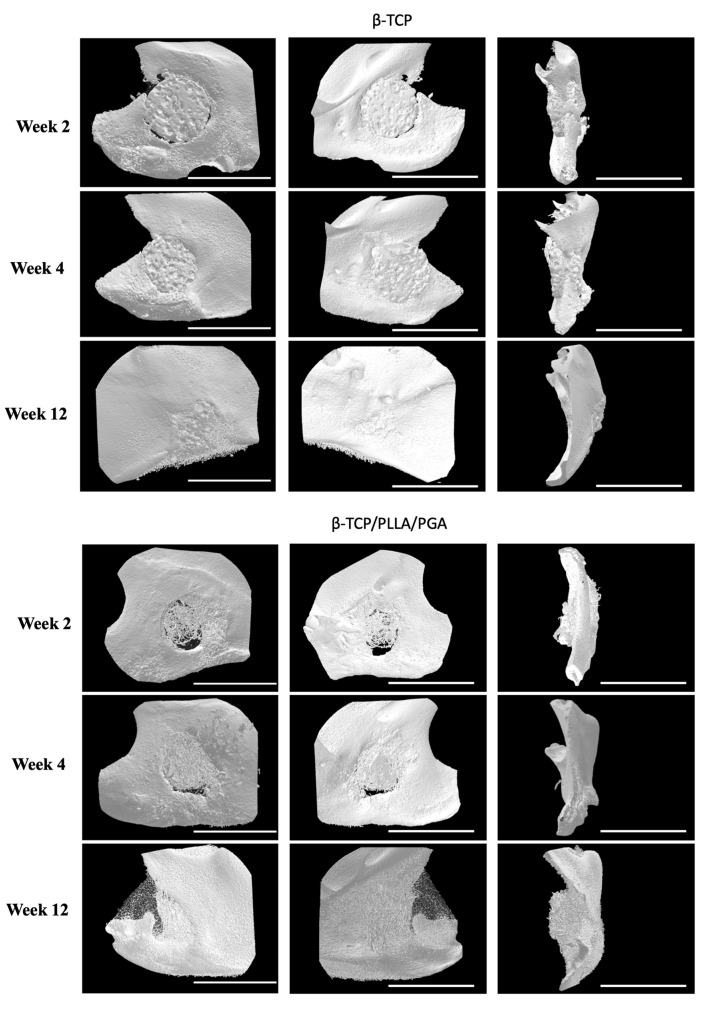
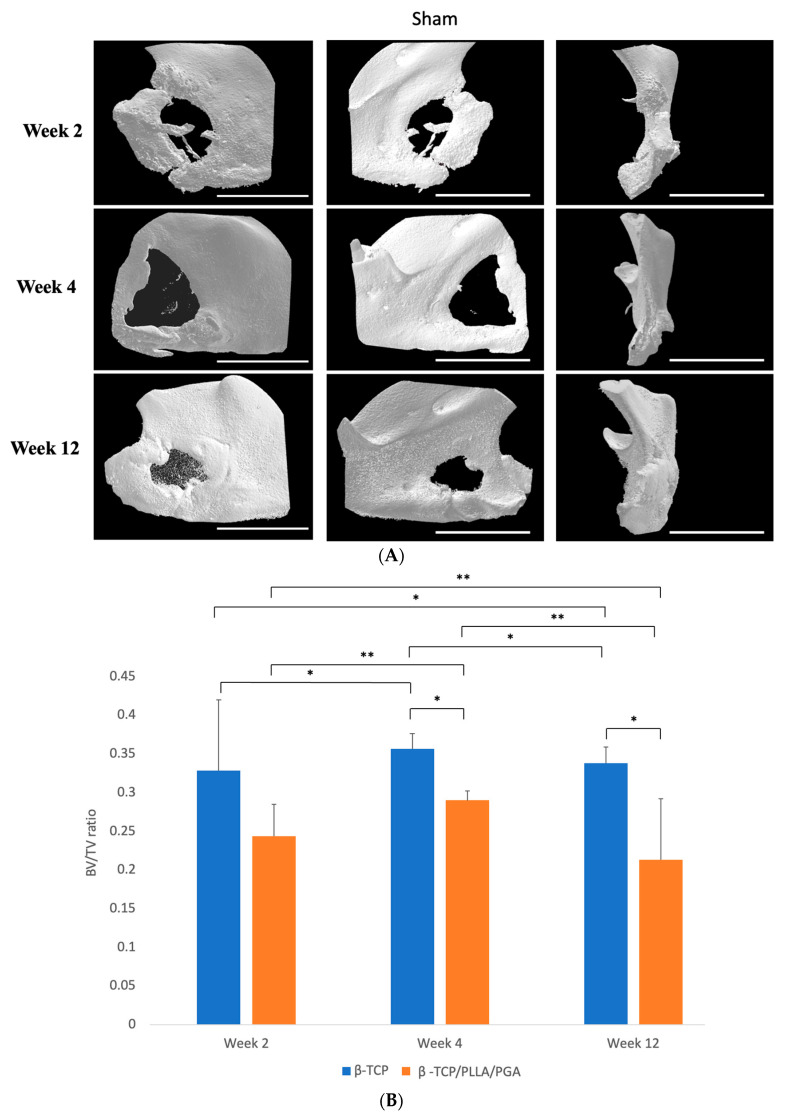
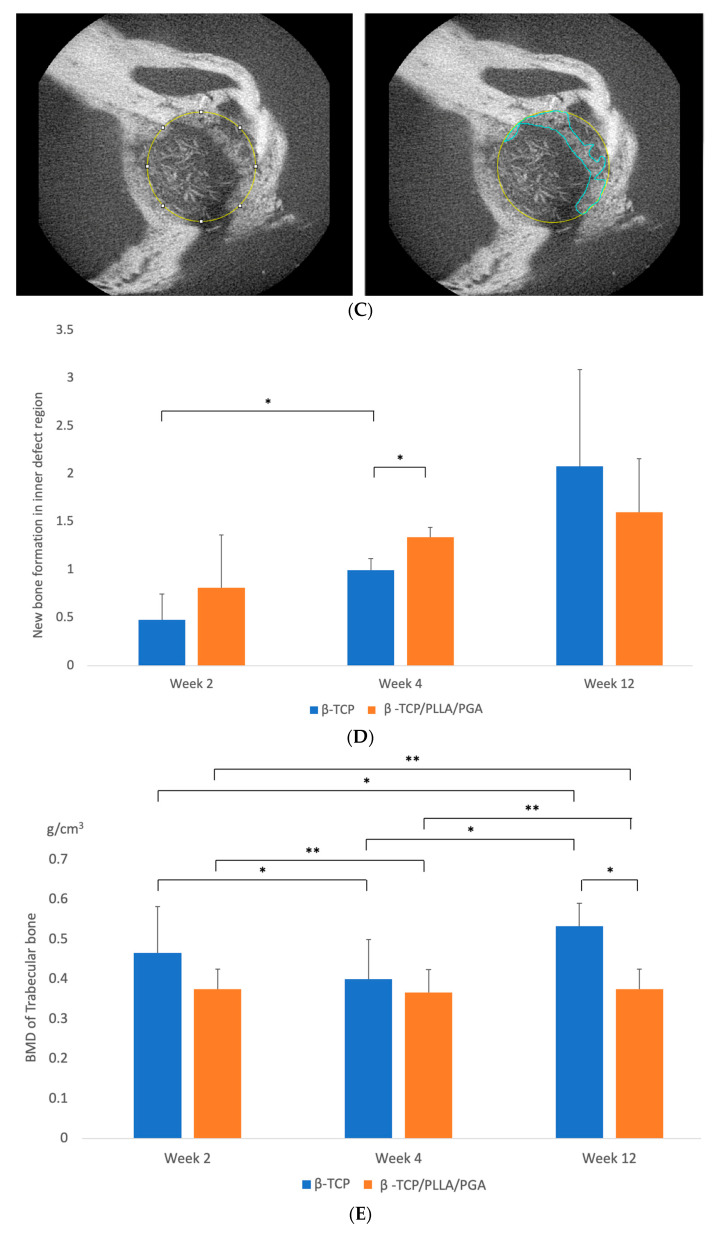
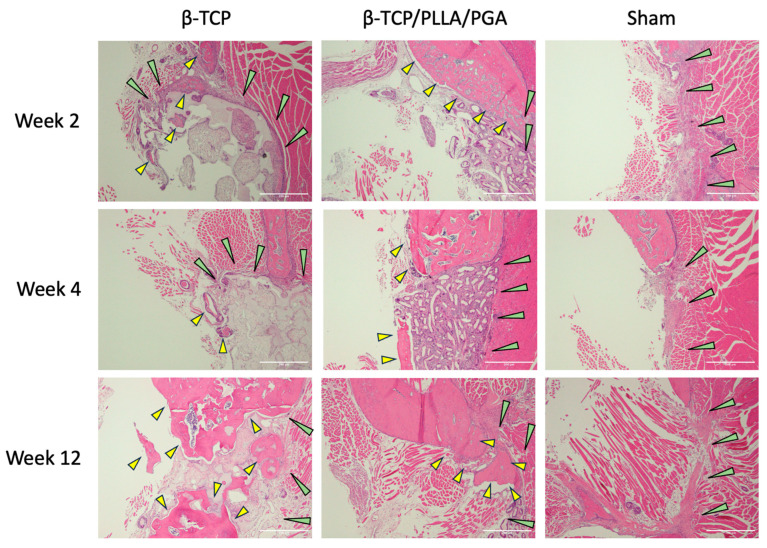
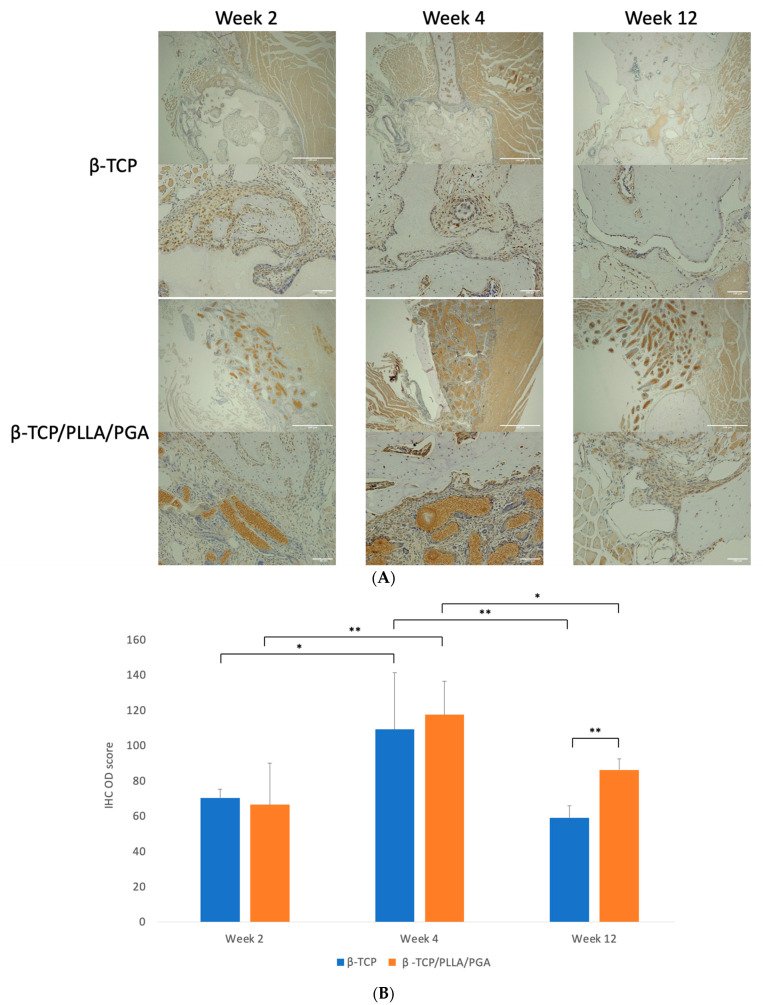
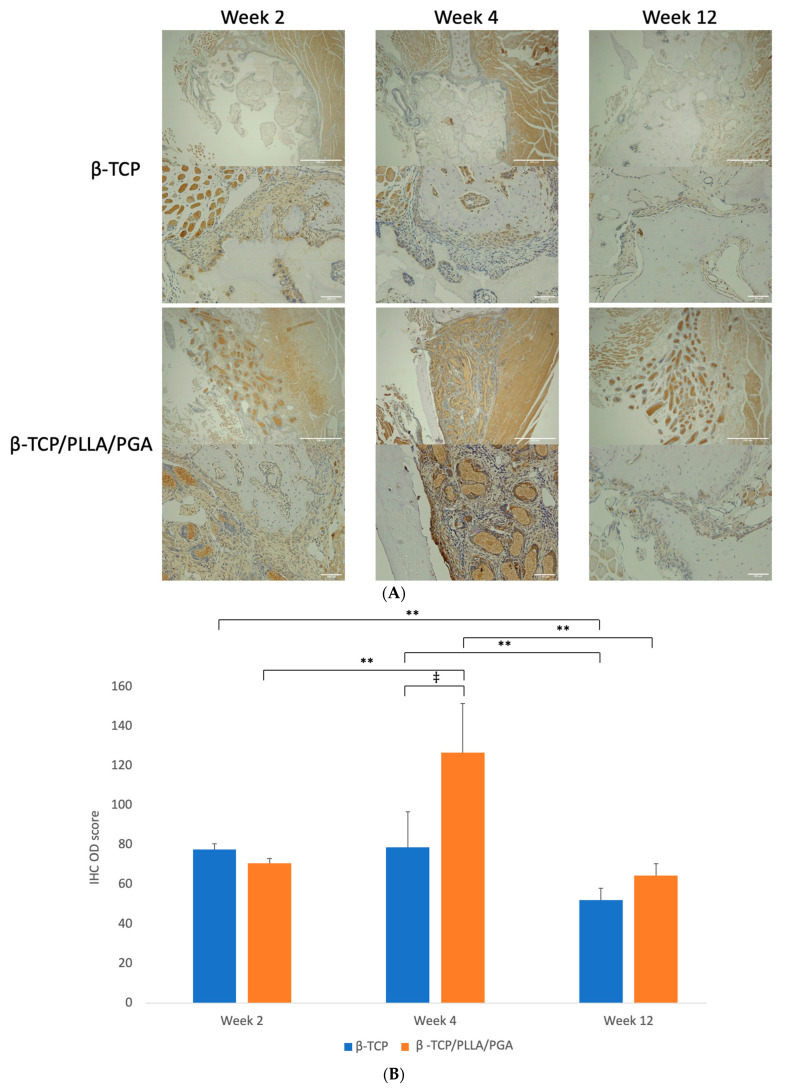
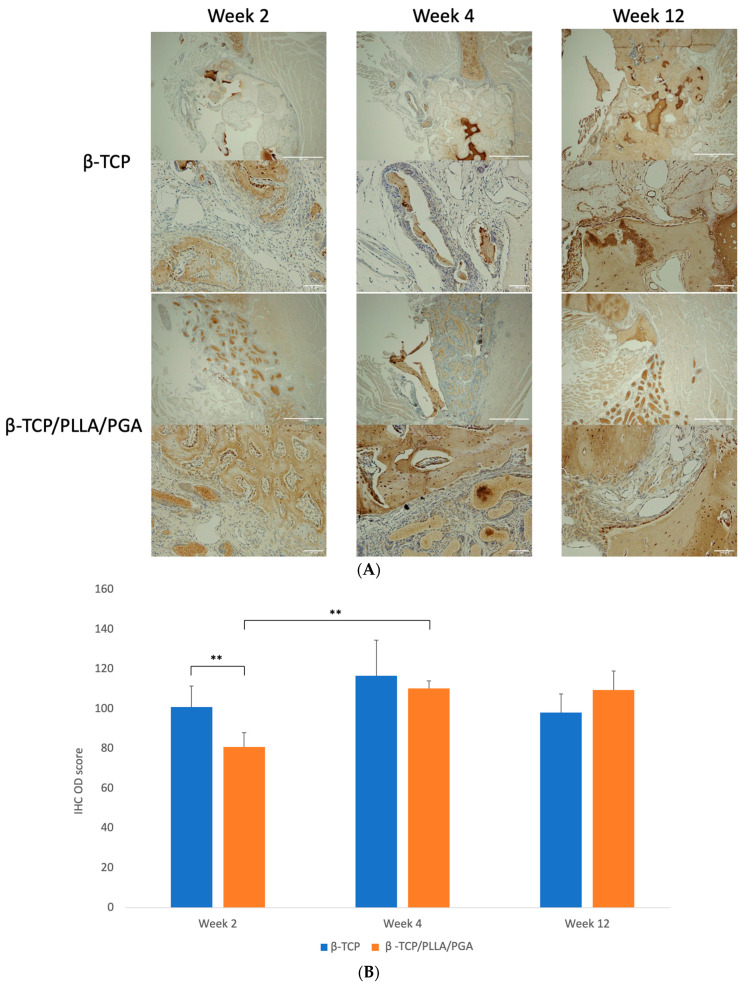
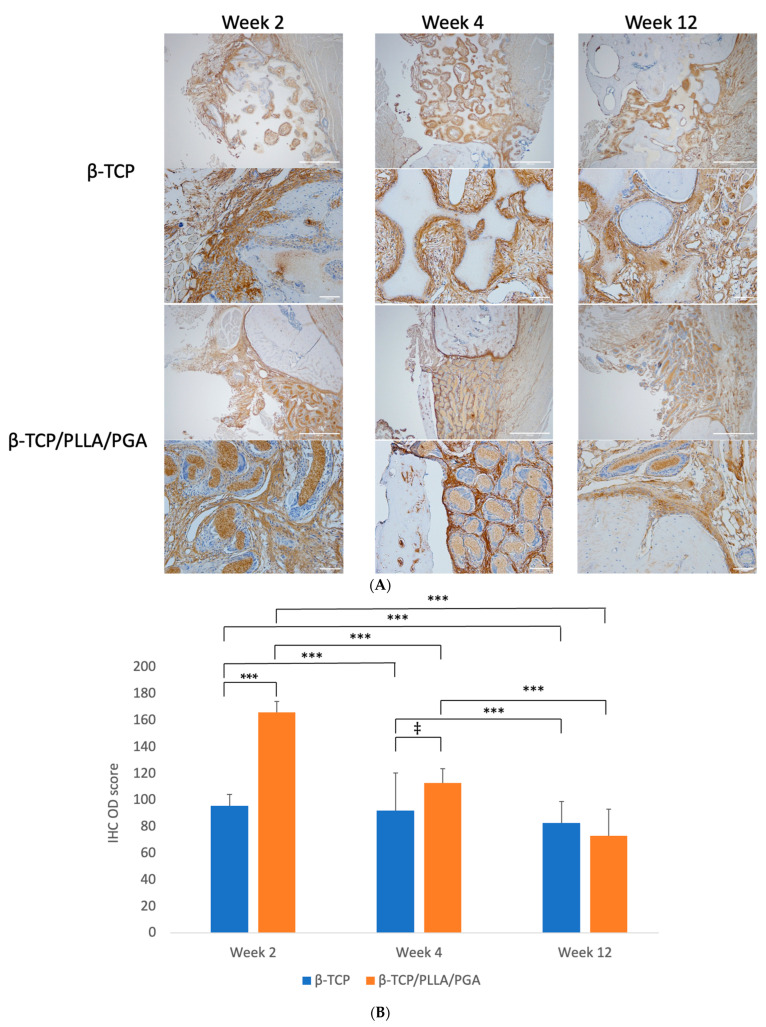
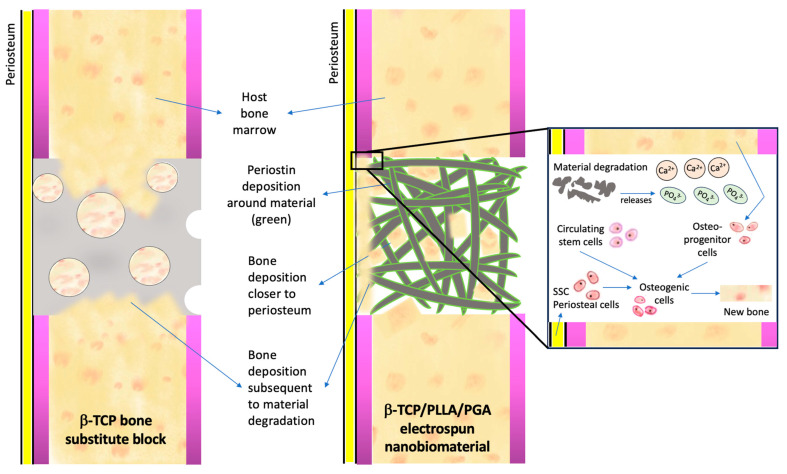
Maxillofacial bone defects are treated by autografting or filling with synthetic materials in various forms and shapes. Electrospun nanobiomaterials are becoming popular due to their easy placement and handling; combining ideal biomaterials extrapolates better outcomes. We used a novel electrospun cotton-like fiber made from two time-tested bioresorbable materials, β-TCP and PLLA/PGA, to check the feasibility of its application to maxillofacial bone defects through an in vivo rat mandibular bone defect model. Novel β-TCP/PLLA/PGA and pure β-TCP blocks were evaluated for new bone regeneration through assessment of bone volume, inner defect diameter reduction, and bone mineral density. Bioactive/osteoconductivity was checked by scoring the levels of Runt-related transcription factor x, Leptin Receptor, Osteocalcin, and Periostin biomarkers. Bone regeneration in both β-TCP/PLLA/PGA and β-TCP was comparable at initial timepoints. Osteogenic cell accumulation was greater in β-TCP/PLLA/PGA than in β-TCP at initial as well as late phases. Periostin expression was more marked in β-TCP/PLLA/PGA. This study demonstrated comparable results between β-TCP/PLLA/PGA and β-TCP in terms of bone regeneration and bioactivity, even with a small material volume of β-TCP/PLLA/PGA and a decreased percentage of β-TCP. Electrospun β-TCP/PLLA/PGA is an ideal nanobiomaterial for inducing bone regeneration through osteoconductivity and bioresorbability in bony defects of the maxillofacial region.

Keywords: electrospun nanobiomaterial; maxillofacial bone regeneration; synthetic/artificial bone graft substitutes; β-TCP/PLLA/PGA cotton-like fiber; β-tricalcium phosphate.


Conflict of interest statement

The authors declare no conflicts of interest. The funders had no role in the design of the study, in the collection, analysis, or interpretation of data, in the writing of the manuscript, or in the decision to publish the results.

Figures

Figure 1
Figure 1
β-TCP/PLLA/PGA (up) and β-TCP (down) scaffolds. β-TCP/PLLA/PGA electrospun cotton-like fibers (upper left) and SEM images of the fibers (from left to right): ×50, ×400, and ×2000 magnifications. β-TCP bone substitute block (lower left) and SEM images of β-TCP block (from left to right): ×50, ×100, and ×500 magnifications.
Figure 2
Figure 2
(A): Animation of the rat mandible showing scaffold placement inside the mandibular critical defect (4 mm) on the right side. (B): Flowchart detailing experimental workflow. (C): Steps during surgery: (a) Disinfection of the rat submandibular region; (b) Skin incision exposing the muscular layer; (c) Periosteal incision and mandibular angle region exposed; (d) Creation of a 4-millimeter defect above the mandibular angle; (e,f) β-TCP/PLLA/PGA and β-TCP packed into the defect, respectively; (g) Wound closure.
Figure 3
Figure 3
(A): 3D reconstructed Micro-CT images displaying buccal, lingual, and sagittal views (from left to right). Comparison of each group at weeks 2, 4, and 12. Note the subsequent defect rim closure progressing over the weeks. The Sham group had negligible bone regeneration, with small stumps visible by week 12. A defect size of 4 mm was standard across all groups. Volume of biomaterial applied: β-TCP/PLLA/PGA group—3 mg, and β-TCP group—16 mg. Scale bar = 1 mm. (B): Graph demonstrating the BV/TV ratio between β-TCP/PLLA/PGA and β-TCP. The BV/TV ratio was consistently comparable between both groups at set time points. A defect size of 4 mm was standard across all groups. Volume of biomaterial applied: β-TCP/PLLA/PGA group—3 mg, and β-TCP group—16 mg (graph symbols denote statistical significance). * p ≤ 0.05; ** p ≤ 0.01. (C): Illustration of new bone formation and defect diameter reduction in the β-TCP/PLLA/PGA group. The defect diameter was recreated (yellow circle), new bone formed within the confines of the defect was traced (blue marking), and the corresponding volume was drawn. (D): New bone growth from the inner edges of the defect. β-TCP/PLLA/PGA had faster defect rim closure than β-TCP at weeks 2 and 4 (graph symbols denote statistical significance). * p ≤ 0.05. (E): Differences in the BMD of trabecular bone formed in both groups were analyzed using CTAn software version 1.19+ (graph symbols denote statistical significance). * p < 0.05; ** p ≤ 0.01.
Figure 3
Figure 3
(A): 3D reconstructed Micro-CT images displaying buccal, lingual, and sagittal views (from left to right). Comparison of each group at weeks 2, 4, and 12. Note the subsequent defect rim closure progressing over the weeks. The Sham group had negligible bone regeneration, with small stumps visible by week 12. A defect size of 4 mm was standard across all groups. Volume of biomaterial applied: β-TCP/PLLA/PGA group—3 mg, and β-TCP group—16 mg. Scale bar = 1 mm. (B): Graph demonstrating the BV/TV ratio between β-TCP/PLLA/PGA and β-TCP. The BV/TV ratio was consistently comparable between both groups at set time points. A defect size of 4 mm was standard across all groups. Volume of biomaterial applied: β-TCP/PLLA/PGA group—3 mg, and β-TCP group—16 mg (graph symbols denote statistical significance). * p ≤ 0.05; ** p ≤ 0.01. (C): Illustration of new bone formation and defect diameter reduction in the β-TCP/PLLA/PGA group. The defect diameter was recreated (yellow circle), new bone formed within the confines of the defect was traced (blue marking), and the corresponding volume was drawn. (D): New bone growth from the inner edges of the defect. β-TCP/PLLA/PGA had faster defect rim closure than β-TCP at weeks 2 and 4 (graph symbols denote statistical significance). * p ≤ 0.05. (E): Differences in the BMD of trabecular bone formed in both groups were analyzed using CTAn software version 1.19+ (graph symbols denote statistical significance). * p < 0.05; ** p ≤ 0.01.
Figure 4
Figure 4
H&E view of β-TCP/PLLA/PGA and β-TCP groups at weeks 2, 4, and 12. Increased activity was observed with regard to the defect margins. Green arrows depict the defect margin; yellow arrows denote newly formed bone. Note the absence of inflammation in both groups, especially at initial time points (×4 magnification, scale bar = 200 μm).
Figure 5
Figure 5
(A): Runx2 expression in β-TCP/PLLA/PGA and β-TCP groups (above: ×4 magnification, scale bar = 200 μm; below: ×20 magnification, scale bar = 100 μm). (B): Variance in the Runx2 expression. The β-TCP/PLLA/PGA group had significantly high expression at the end of week 12 (graph symbols denote statistical significance). * p < 0.05; ** p ≤ 0.01.
Figure 6
Figure 6
(A): Image showing LepR-positive cells in reaction to the implanted scaffold. Strong expression of LepR-positive cells in close contact with the β-TCP/PLLA/PGA group by week 4 (above: ×4 magnification, scale bar = 200 μm; below: ×20 magnification, scale bar = 100 μm). (B): Graph depicting the LepR IHC OD score. Results were parallel to Runx2 scores (* graph symbols denote statistical significance). ‡ p < 0.005; ** p ≤ 0.01.
Figure 7
Figure 7
(A): OCN expression as seen at weeks 2, 4, and 12. β-TCP had consistent levels at weeks 4 and 12, indicating an increase in mature regenerated bone (above: ×4 magnification, scale bar = 200 μm; below: ×20 magnification, scale bar = 100 μm). (B): OCN–IHC OD scoring graph. Comparable results were observed at all time points (* graph symbols denote statistical significance). ** p < 0.01.
Figure 8
Figure 8
(A): Periostin deposition around the scaffolds. The protein deposition followed the shape of β-TCP/PLLA/PGA fibers, evident at week 4 (above: ×4 magnification, scale bar = 200 μm; below: ×20 magnification, scale bar = 100 μm). (B): Periostin IHC OD values. Highest scoring seen in β-TCP/PLLA/PGA at week 2 and thereafter at week 4 (* graph symbols denote statistical significance). ‡ p ≤ 0.005; *** p ≤ 0.001.
Figure 9
Figure 9
Mechanism of bone regeneration induced by calcium–phosphate scaffolds. Please refer to the text above for an explanation.

Similar articles

Cited by

References

    1. Wu V., Helder M.N., Bravenboer N., Ten Bruggenkate C.M., Jin J., Klein-Nulend J., Schulten E.A.J.M. Bone Tissue Regeneration in the Oral and Maxillofacial Region: A Review on the Application of Stem Cells and New Strategies to Improve Vascularization. Stem Cells Int. 2019;30:6279721. doi: 10.1155/2019/6279721. - DOI - PMC - PubMed
    1. Valtanen R.S., Yang Y.P., Gurtner G.C., Maloney W.J., Lowenberg D.W. Synthetic and Bone tissue engineering graft substitutes: What is the future? Injury. 2021;52:S72–S77. doi: 10.1016/j.injury.2020.07.040. - DOI - PubMed
    1. Campana V.G., Milano E., Pagano M., Barba C., Cicione G., Salonna W., Lattanzi G., Logroscino G. Bone substitutes in orthopaedic surgery: From basic science to clinical practice. J. Mater. Sci. Mater. Med. 2014;25:2445–2461. doi: 10.1007/s10856-014-5240-2. - DOI - PMC - PubMed
    1. Schmidt A.H. Autologous bone graft: Is it still the gold standard? Injury. 2021;52:S18–S22. doi: 10.1016/j.injury.2021.01.043. - DOI - PubMed
    1. Chaushu G., Mardinger O., Peleg M., Ghelfan O., Nissan J. Analysis of complications following augmentation with cancellous block allografts. J. Periodontol. 2010;81:1759–1764. doi: 10.1902/jop.2010.100235. - DOI - PubMed

Grants and funding

LinkOut - more resources