

Structural Outlier Detection and Zernike-Canterakis Moments for Molecular Surface Meshes-Fast Implementation in Python
- PMID: 38202635
- PMCID: PMC10779519
- DOI: 10.3390/molecules29010052
Structural Outlier Detection and Zernike-Canterakis Moments for Molecular Surface Meshes-Fast Implementation in Python
Abstract
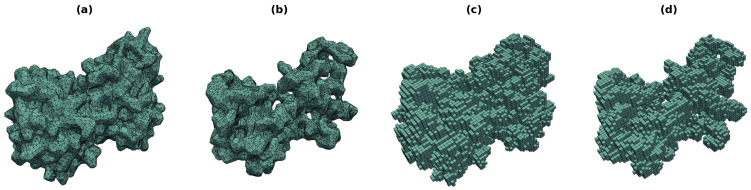
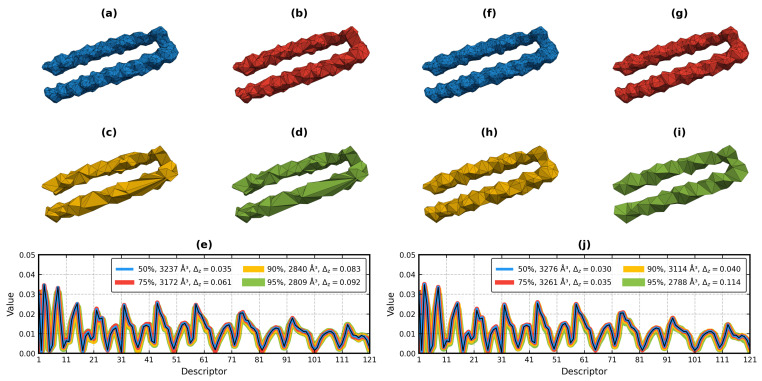
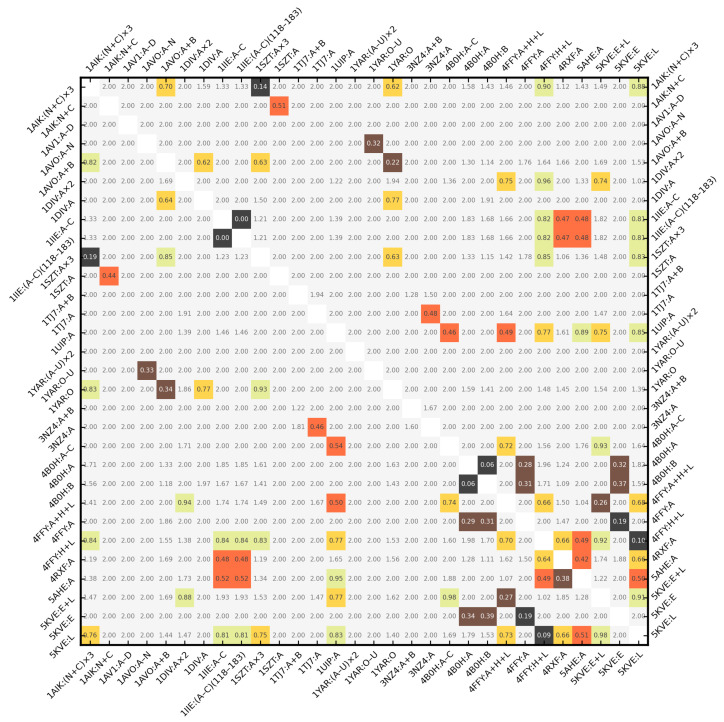
Object retrieval systems measure the degree of similarity of the shape of 3D models. They search for the elements of the 3D model databases that resemble the query model. In structural bioinformatics, the query model is a protein tertiary/quaternary structure and the objective is to find similarly shaped molecules in the Protein Data Bank. With the ever-growing size of the PDB, a direct atomic coordinate comparison with all its members is impractical. To overcome this problem, the shape of the molecules can be encoded by fixed-length feature vectors. The distance of a protein to the entire PDB can be measured in this low-dimensional domain in linear time. The state-of-the-art approaches utilize Zernike-Canterakis moments for the shape encoding and supply the retrieval process with geometric data of the input structures. The BioZernike descriptors are a standard utility of the PDB since 2020. However, when trying to calculate the ZC moments locally, the issue of the deficiency of libraries readily available for use in custom programs (i.e., without relying on external binaries) is encountered, in particular programs written in Python. Here, a fast and well-documented Python implementation of the Pozo-Koehl algorithm is presented. In contrast to the more popular algorithm by Novotni and Klein, which is based on the voxelized volume, the PK algorithm produces ZC moments directly from the triangular surface meshes of 3D models. In particular, it can accept the molecular surfaces of proteins as its input. In the presented PK-Zernike library, owing to Numba's just-in-time compilation, a mesh with 50,000 facets is processed by a single thread in a second at the moment order 20. Since this is the first time the PK algorithm is used in structural bioinformatics, it is employed in a novel, simple, but efficient protein structure retrieval pipeline. The elimination of the outlying chain fragments via a fast PCA-based subroutine improves the discrimination ability, allowing for this pipeline to achieve an 0.961 area under the ROC curve in the BioZernike validation suite (0.997 for the assemblies). The correlation between the results of the proposed approach and of the 3D Surfer program attains values up to 0.99.
Keywords: Numba; Python; Zernike moments; bioinformatics; computational geometry; molecular surface; principal component analysis; protein structure; shape retrieval.
Conflict of interest statement
The author declares no conflict of interest. The funders had no role in the design of the study; in the collection, analyses, or interpretation of data; in the writing of the manuscript, or in the decision to publish the results.
Figures


Similar articles
-
Protein 3D Structure and Electron Microscopy Map Retrieval Using 3D-SURFER2.0 and EM-SURFER.Curr Protoc Bioinformatics. 2017 Dec 8;60:3.14.1-3.14.15. doi: 10.1002/cpbi.37. Curr Protoc Bioinformatics. 2017. PMID: 29220075 Free PMC article.
-
ZMPY3D: accelerating protein structure volume analysis through vectorized 3D Zernike moments and Python-based GPU integration.Bioinform Adv. 2024 Jul 25;4(1):vbae111. doi: 10.1093/bioadv/vbae111. eCollection 2024. Bioinform Adv. 2024. PMID: 39100546 Free PMC article.
-
FP-Zernike: An Open-source Structural Database Construction Toolkit for Fast Structure Retrieval.Genomics Proteomics Bioinformatics. 2024 May 9;22(1):qzae007. doi: 10.1093/gpbjnl/qzae007. Genomics Proteomics Bioinformatics. 2024. PMID: 38894604 Free PMC article.
-
Efficient 3D geometric and Zernike moments computation from unstructured surface meshes.IEEE Trans Pattern Anal Mach Intell. 2011 Mar;33(3):471-84. doi: 10.1109/TPAMI.2010.139. IEEE Trans Pattern Anal Mach Intell. 2011. PMID: 20714011
-
Advances in the Development of Shape Similarity Methods and Their Application in Drug Discovery.Front Chem. 2018 Jul 25;6:315. doi: 10.3389/fchem.2018.00315. eCollection 2018. Front Chem. 2018. PMID: 30090808 Free PMC article. Review.
References
-
- Burley S.K., Bhikadiya C., Bi C., Bittrich S., Chen L., Crichlow G.V., Christie C.H., Dalenberg K., Di Costanzo L., Duarte J.M., et al. RCSB Protein Data Bank: Powerful new tools for exploring 3D structures of biological macromolecules for basic and applied research and education in fundamental biology, biomedicine, biotechnology, bioengineering and energy sciences. Nucleic Acids Res. 2020;49:D437–D451. doi: 10.1093/nar/gkaa1038. - DOI - PMC - PubMed
-
- PDB Statistics. [(accessed on 21 September 2023)]. Available online: https://www.rcsb.org/stats/summary.
Grants and funding
LinkOut - more resources
Full Text Sources
