

Biomarkers in Cancer Detection, Diagnosis, and Prognosis
- PMID: 38202898
- PMCID: PMC10780704
- DOI: 10.3390/s24010037
Biomarkers in Cancer Detection, Diagnosis, and Prognosis
Abstract
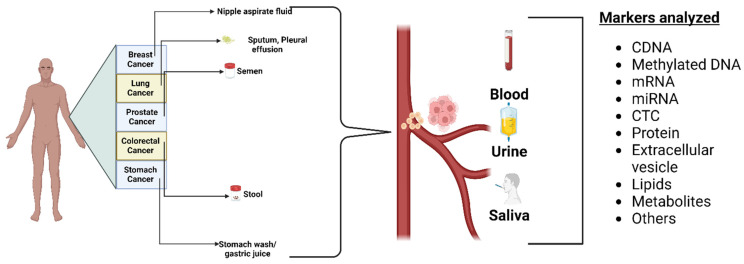
Biomarkers are vital in healthcare as they provide valuable insights into disease diagnosis, prognosis, treatment response, and personalized medicine. They serve as objective indicators, enabling early detection and intervention, leading to improved patient outcomes and reduced costs. Biomarkers also guide treatment decisions by predicting disease outcomes and facilitating individualized treatment plans. They play a role in monitoring disease progression, adjusting treatments, and detecting early signs of recurrence. Furthermore, biomarkers enhance drug development and clinical trials by identifying suitable patients and accelerating the approval process. In this review paper, we described a variety of biomarkers applicable for cancer detection and diagnosis, such as imaging-based diagnosis (CT, SPECT, MRI, and PET), blood-based biomarkers (proteins, genes, mRNA, and peptides), cell imaging-based diagnosis (needle biopsy and CTC), tissue imaging-based diagnosis (IHC), and genetic-based biomarkers (RNAseq, scRNAseq, and spatial transcriptomics).
Keywords: CT needle biopsy; DNA; MRI; PET; RNA; RNAseq; biomarkers; lipids; proteomics.
Conflict of interest statement
The authors declare no conflict of interest.
Figures
Similar articles
-
Personalized oncology: recent advances and future challenges.Metabolism. 2013 Jan;62 Suppl 1:S11-4. doi: 10.1016/j.metabol.2012.08.016. Epub 2012 Sep 19. Metabolism. 2013. PMID: 22999010 Review.
-
Integrated proteo-genomic approach for early diagnosis and prognosis of cancer.Cancer Lett. 2015 Dec 1;369(1):28-36. doi: 10.1016/j.canlet.2015.08.003. Epub 2015 Aug 11. Cancer Lett. 2015. PMID: 26276717 Review.
-
Novel secretome-to-transcriptome integrated or secreto-transcriptomic approach to reveal liquid biopsy biomarkers for predicting individualized prognosis of breast cancer patients.BMC Med Genomics. 2019 May 30;12(1):78. doi: 10.1186/s12920-019-0530-7. BMC Med Genomics. 2019. PMID: 31146747 Free PMC article.
-
The footprints of cancer development: Cancer biomarkers.Cancer Treat Rev. 2009 May;35(3):193-200. doi: 10.1016/j.ctrv.2008.10.004. Epub 2008 Dec 4. Cancer Treat Rev. 2009. PMID: 19062197 Review.
-
Exploitation of Gene Expression and Cancer Biomarkers in Paving the Path to Era of Personalized Medicine.Genomics Proteomics Bioinformatics. 2017 Aug;15(4):220-235. doi: 10.1016/j.gpb.2016.11.005. Epub 2017 Aug 13. Genomics Proteomics Bioinformatics. 2017. PMID: 28813639 Free PMC article. Review.
Cited by
-
The Ineffectiveness of Osimertinib in Epidermal Growth Factor Receptor (EGFR)-Mutated Stage IV Lung Adenocarcinoma With Bone Metastasis: A Case Report.Cureus. 2024 Aug 5;16(8):e66240. doi: 10.7759/cureus.66240. eCollection 2024 Aug. Cureus. 2024. PMID: 39108772 Free PMC article.
-
Comprehensive analysis of the clinical significance and molecular mechanism of T-box transcription factor 3 in osteosarcoma.J Cancer. 2024 May 30;15(12):4007-4019. doi: 10.7150/jca.96168. eCollection 2024. J Cancer. 2024. PMID: 38911382 Free PMC article.
-
Impact of Metabolites from Foodborne Pathogens on Cancer.Foods. 2024 Dec 1;13(23):3886. doi: 10.3390/foods13233886. Foods. 2024. PMID: 39682958 Free PMC article. Review.
-
Toward Timely and Equitable Advanced Biomarker Testing for Patients with Metastatic Cancer in Canada.Curr Oncol. 2025 Feb 27;32(3):141. doi: 10.3390/curroncol32030141. Curr Oncol. 2025. PMID: 40136345 Free PMC article.
-
Association of ALDH3A1 expression with tumor differentiation, pathological stage, and nodal status in oral squamous cell carcinoma.J Taibah Univ Med Sci. 2025 Jun 24;20(3):396-404. doi: 10.1016/j.jtumed.2025.06.007. eCollection 2025 Jun. J Taibah Univ Med Sci. 2025. PMID: 40657474 Free PMC article.
References
-
- Allegra C.J., Jessup J.M., Somerfield M.R., Hamilton S.R., Hammond E.H., Hayes D.F., McAllister P.K., Morton R.F., Schilsky R.L. American Society of Clinical Oncology provisional clinical opinion: Testing for KRAS gene mutations in patients with metastatic colorectal carcinoma to predict response to anti–epidermal growth factor receptor monoclonal antibody therapy. J. Clin. Oncol. 2009;27:2091–2096. doi: 10.1200/JCO.2009.21.9170. - DOI - PubMed
-
- Bang Y.-J., Van Cutsem E., Feyereislova A., Chung H.C., Shen L., Sawaki A., Lordick F., Ohtsu A., Omuro Y., Satoh T. Trastuzumab in combination with chemotherapy versus chemotherapy alone for treatment of HER2-positive advanced gastric or gastro-oesophageal junction cancer (ToGA): A phase 3, open-label, randomised controlled trial. Lancet. 2010;376:687–697. doi: 10.1016/S0140-6736(10)61121-X. - DOI - PubMed
-
- Bossuyt P.M., Reitsma J.B., Bruns D.E., Gatsonis C.A., Glasziou P.P., Irwig L.M., Moher D., Rennie D., De Vet H.C., Lijmer J.G. The STARD statement for reporting studies of diagnostic accuracy: Explanation and elaboration. Ann. Intern. Med. 2003;138:W1–W12. doi: 10.7326/0003-4819-138-1-200301070-00012-w1. - DOI - PubMed
Publication types
MeSH terms
Substances
Grants and funding
LinkOut - more resources
Full Text Sources
Medical
