Review
. 2023 Dec 26;24(1):130.
doi: 10.3390/s24010130.

An Overview on Recent Advances in Biomimetic Sensors for the Detection of Perfluoroalkyl Substances

Affiliations
Review

An Overview on Recent Advances in Biomimetic Sensors for the Detection of Perfluoroalkyl Substances

Fatemeh Ahmadi Tabar et al. Sensors (Basel). .

Abstract

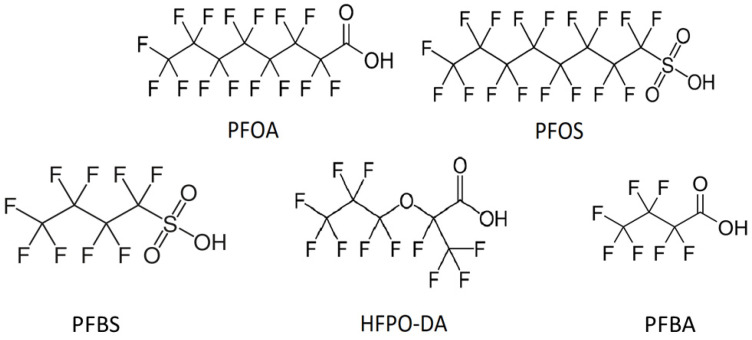
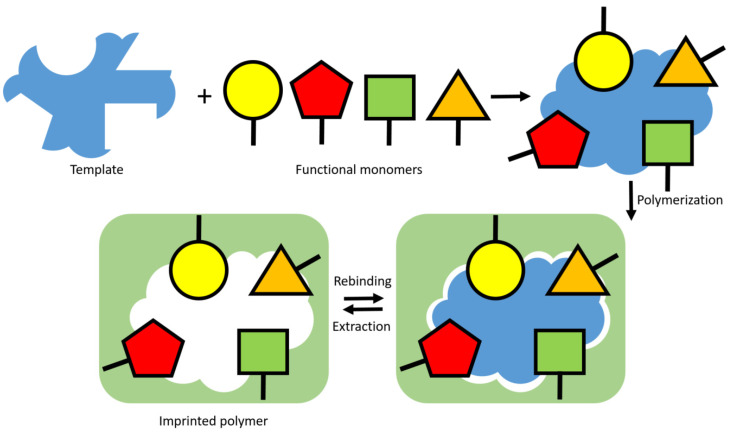
Per- and polyfluoroalkyl substances (PFAS) are a class of materials that have been widely used in the industrial production of a wide range of products. After decades of bioaccumulation in the environment, research has demonstrated that these compounds are toxic and potentially carcinogenic. Therefore, it is essential to map the extent of the problem to be able to remediate it properly in the next few decades. Current state-of-the-art detection platforms, however, are lab based and therefore too expensive and time-consuming for routine screening. Traditional biosensor tests based on, e.g., lateral flow assays may struggle with the low regulatory levels of PFAS (ng/mL), the complexity of environmental matrices and the presence of coexisting chemicals. Therefore, a lot of research effort has been directed towards the development of biomimetic receptors and their implementation into handheld, low-cost sensors. Numerous research groups have developed PFAS sensors based on molecularly imprinted polymers (MIPs), metal-organic frameworks (MOFs) or aptamers. In order to transform these research efforts into tangible devices and implement them into environmental applications, it is necessary to provide an overview of these research efforts. This review aims to provide this overview and critically compare several technologies to each other to provide a recommendation for the direction of future research efforts focused on the development of the next generation of biomimetic PFAS sensors.

Keywords: aptamers; biomimetic sensors; environmental pollution; molecularly imprinted polymers; polyfluoroalkyl substances.


Conflict of interest statement

The authors declare that they have no known competing financial interests or personal relationships that could have appeared to influence the work reported in this paper.

Figures

Figure 1
Figure 1
The chemical structures of perfluorooctanoic acid PFOA (molecular weight MW: 414 g/mol), perfluorooctane sulfonate PFOS (MW: 500 g/mol), perfluorobutanesulfonic acid PFBS (MW: 300 g/mol), hexafluoropropylene oxide dimer acid HFPO-DA (MW: 330 g/mol), and perfluorobutanoic acid PFBA (MW: 214 g/mol).
Figure 2
Figure 2
Schematic representation of the concept of molecular imprinting. The synthetic receptor formation starts by a stereochemical arrangement of functional monomers around a template of interest through self-assembly. The most adopted approach consist of adding an initiator and crosslinker to the pre-polymerization mixture and thermally or UV-induced polymerization. This creates a highly crosslinked polymeric network around the template that serves as a plastic mold to which the template can specifically rebind upon extraction.
Figure 3
Figure 3
Schematic illustration of molecular imprinting directly on an electrode surface. As shown, the templates leave the imprinted cavities on the top of polymeric matrix and target analytes can rebind with the imprints. Figure reprinted from [95]. Copyright 2022, with permission from Elsevier.
Figure 4
Figure 4
Schematic illustration of the heat transfer method setup. The temperature T1 is constant by using a heating element and a temperature control unit. The temperature in the fluid (T2) is varying by the changes on the MIPs layer.
Figure 5
Figure 5
(a) Temperature response (T2) for both MIP and NIP after exposure to different concentrations of PFOA in PBS (T1 was kept constant at 37 °C). (b) Dose–response curve of MIP- and NIP-covered sensor chips obtained by HTM. The LoD for these measurements was calculated as 0.48 nM based on the intercept of the 3σ line with the MIP curve. Reproduced with permission from [104]. Copyright 2023, Elsevier (CC-BY).
Figure 6
Figure 6
Schematic illustration of the PFOS detection procedure. (a) Electropolymerization of o-phenylenediamine (o-PD) on a glassy carbon macroelectrode. PFOS molecules are shown as black ovals and the white ovals are the biding cavities remained after PFOS removal. (b) Driving of oxygen reduction on the MIP-modified electrode. (c) Rebinding of the template molecule with the MIPs. (d) Blocking the electrochemical signal of the redox reaction by bound PFOS molecules. (e) The Rct values increases with the increase in the PFOS concentration. (f) The normalized Rct against the logarithm of PFOS concentration. Reproduced with permission from [93]. Copyright 2020, American Chemical Society (CC-BY).
Figure 7
Figure 7
Schematic illustration of the voltametric sensor consisting of MIP and gold nanostars (AuNS) coatings for PFOS determination. Right: The GCE surface is first modified with AuNS and then electropolymerized with o-PD using cyclic voltammetry (CV). Left: The CV curve and the probes’ oxidation peak for pristine GCE, AuNS/GCE, and MIP/AuNS/GCE before and after PFOS removal. Figure adapted from [125]. Copyright 2021, with permission from Elsevier.
Figure 8
Figure 8
(a) Differential pulse voltammetry (DPV) of MIPs Co/Fe@CNF at different PFOA concentrations in molar units and (b) linear relationship between the current density and the logarithm of the PFOA concentration. Figure adapted from [67]. Copyright 2023, with permission from Elsevier.
Figure 9
Figure 9
Schematically representing the formation of a target–aptamer complex. The aptamer folds into a 3D structure, upon which it binds to the target molecule. Reproduced with permission from [132]. Copyright 2017, Society for Neuroscience (CC-BY).
Figure 10
Figure 10
(a) The predicted 2D structures of aptamer after exposure to PFOA. (b) Fluorescence responses for binding of PFOA with different concentrations to the aptamer. The aptamer was modified with fluorescein (FAM) at 5′-end and dabcyl (D) at 3′-end, which was used as the quencher strand. Reproduced with permission from [60]. Copyright 2021, Elsevier (CC-BY-NC-ND).
Figure 11
Figure 11
Schematic illustration of the different interactions between fluorinated MOFs and PFAS molecules including redox, electrostatic, hydrophobic, hydrogen bonding and F–F interactions. Reproduced with permission [66]. Copyright 2022, John Wiley and Sons (CC-BY-NC).
Figure 12
Figure 12
Fluorescence emission of the PCNs suspension at excitation wavelength λex = 430 nm upon exposure to different concentrations of PFOA in water (0–10 μg/mL). Figure adopted from [137]. Copyright 2021, with permission from American Chemical Society.

Similar articles

Cited by

References

    1. Chen C., Wang J., Yang S., Yan Z., Cai Q., Yao S. Analysis of Perfluorooctane Sulfonate and Perfluorooctanoic Acid with a Mixed-Mode Coating-Based Solid-Phase Microextraction Fiber. Talanta. 2013;114:11–16. doi: 10.1016/j.talanta.2013.04.018. - DOI - PubMed
    1. Kazemi R., Potts E.I., Dick J.E. Quantifying Interferent Effects on Molecularly Imprinted Polymer Sensors for Per- and Polyfluoroalkyl Substances (PFAS) Anal. Chem. 2020;92:10597–10605. doi: 10.1021/acs.analchem.0c01565. - DOI - PubMed
    1. Smaili H., Ng C. Adsorption as a Remediation Technology for Short-Chain per- and Polyfluoroalkyl Substances (PFAS) from Water—A Critical Review. Environ. Sci. 2022;9:344–362. doi: 10.1039/D2EW00721E. - DOI
    1. Yu H., Chen Y.F., Guo H.Q., Ma W.T., Li J., Zhou S.G., Lin S., Yan L.S., Li K.X. Preparation of Molecularly Imprinted Carbon Microspheres by One-Pot Hydrothermal Method and Their Adsorption Properties to Perfluorooctane Sulfonate. Chin. J. Anal. Chem. 2019;47:1776–1784. doi: 10.1016/S1872-2040(19)61200-4. - DOI
    1. Hassan M.H., Khan R., Andreescu S. Advances in Electrochemical Detection Methods for Measuring Contaminants of Emerging Concerns. Electrochem. Sci. Adv. 2022;2:e2100184. doi: 10.1002/elsa.202100184. - DOI

LinkOut - more resources