. 2023 Dec 28;24(1):191.
doi: 10.3390/s24010191.

Detection of SO2F2 Using a Photoacoustic Two-Chamber Approach

Affiliations

Detection of SO2F2 Using a Photoacoustic Two-Chamber Approach

Hassan Yassine et al. Sensors (Basel). .

Abstract

The wide use of sulfuryl difluoride (SO2F2) for termite control in buildings, warehouses and shipping containers requires the implementation of suitable sensors for reliable detection. SO2F2 is highly toxic to humans and the environment, and moreover, it is a potent greenhouse gas. We developed two photoacoustic two-chamber sensors with the aim to detect two different concentration ranges, 0-1 vol.-% SO2F2 and 0-100 ppm SO2F2, so that different applications can be targeted: the sensor for high concentrations for the effective treatment of buildings, containers, etc., and the sensor for low concentrations as personal safety device. Photoacoustic detectors were designed, fabricated, and then filled with either pure SO2F2 or pure substituent gas, the refrigerant R227ea, to detect SO2F2. Absorption cells with optical path lengths of 50 mm and 1.6 m were built for both concentration ranges. The sensitivity to SO2F2 as well as cross-sensitivities to CO2 and H2O were measured. The results show that concentrations below 1 ppm SO2F2 can be reliably detected, and possible cross-sensitivities can be effectively compensated.

Keywords: photoacoustic spectroscopy; sulfuryl difluoride (SO2F2) detection; two-chamber photoacoustic sensors.


Conflict of interest statement

The authors declare no conflicts of interest.

Figures

Figure 1
Figure 1
Schematic illustration of the photoacoustic sensor setup using the two-chamber approach. The graphs show the emitted spectral power IEm(λ) of the JSIR 350-4-AL-R-D6.0-2-A7 IR emitter used (Micro-Hybrid Electronic GmbH, Germany) between 2.5 µm and 15 µm at an emitter temperature of 550 °C (electrical input power of 0.36 W), calculated using Planck’s law from [31] and the information provided in the datasheet [32]. Radiation losses resulting from the transmission through the window of the IR emitter were not considered. It shows the absorption ADet(λ) of a SO2F2 detector with a detector length lDet of 1.5 mm, calculated using the Beer–Lambert law.
Figure 2
Figure 2
Picture showing the back side (left) and front side with detector window (right) of the constructed detector chamber (5 mm × 5 mm × 4 mm). Two copper tubes (1 mm × 0.5 mm) were soldered into the sides of the detector chamber to fill the detector with gas and a 500 µm double side polished <110> 4-inch Si window with a metallization layer was soldered to the detector. The MEMS microphone is integrated into the detector chamber, and the contacts are led outside the detector chamber via a gas-tight glass feedthrough.
Figure 3
Figure 3
(a) Picture of the absorption cell (20 mm × 50 mm) made of brass, consisting of four segments together with a photoacoustic detector in the foreground. The optical path length is 50 mm and the diameter of the optical path is 3 mm. The photoacoustic detector was mounted to the first end of the absorption cell and the IR emitter to the second end. (b) Overall setup of the multi-pass White cell with an optical path length of 1.6 m, with the IR emitter and the photoacoustic detector. The IR emitter was mounted in the opening on the right side, while the detector was mounted in the opening on the left side.
Figure 4
Figure 4
Variation in the signal of the SO2F2 photoacoustic detector and the R227ea photoacoustic detector with respect to the change in the modulation frequency of the IR emitter in the range between 20 Hz and 500 Hz. The detector signal decreases with the increase in modulation frequency. These measurements were performed with the sensor setup with the 50 mm absorption cell in N2 atmosphere.
Figure 5
Figure 5
(a) Variation in the sensor signal of both photoacoustic detectors as a function of the SO2F2 concentration change in the absorption cell (l = 50 mm). A logistic function as in Equation (2) describes the detector response well. (b) Sensitivity of both photoacoustic detectors in %FS/50 ppm in concentration range between 50 and 1000 ppm SO2F2.
Figure 6
Figure 6
(a) Variation in the measured and the simulated signals of both photoacoustic detectors as a function of the SO2F2 concentration in the absorption cell (l = 50 mm) between 0 and 1000 ppm as well as that at SO2F2 concentrations of 2000 ppm, 5000 ppm and 10,000 ppm in the absorption cell (l = 50 mm) in (b).
Figure 7
Figure 7
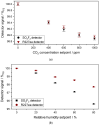
(a) Measured signal of both photoacoustic detectors with 400 ppm, 600 ppm, 800 ppm and 1000 ppm CO2 in the absorption cell (l = 50 mm) and (b) 20%, 40%, 60% and 80% relative humidity (at T = 30 °C).
Figure 8
Figure 8
(a) Variation in the sensor signal of both photoacoustic detectors as a function of the SO2F2 concentration change in the absorption cell (l = 1.6 m). A logistic function as in Equation (2) describes the detector response well. (b) Sensitivity of both photoacoustic detectors in %FS/1ppm in concentration range between 1 and 100 ppm SO2F2.
Figure 9
Figure 9
Variation in the measured and the simulated signals of both photoacoustic detectors as a function of the SO2F2 concentration change in the absorption cell (l = 1.6 m) between 0 and 100 ppm.
Figure 10
Figure 10
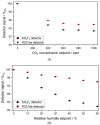
(a) Measured signal of both photoacoustic detectors to 400 ppm, 600 ppm, 800 ppm and 1000 ppm CO2 in the absorption cell (l = 1.6 m) and (b) to 10%, 20%, 30%, 40%, 50% and 60% relative humidity (at T = 30 °C).

References

    1. Yu D., Deng L., Yao B., Vollmer M.K., Chen L., Li Y., Xu H., O’Doherty S., Song Q., Ning S. Atmospheric mixing ratios and emissions of sulfuryl fluoride (SO2F2) in China. Atmos. Res. 2022;275:106222. doi: 10.1016/j.atmosres.2022.106222. - DOI
    1. Gressent A., Rigby M., Ganesan A.L., Prinn R.G., Manning A.J., Mühle J., Salameh P.K., Krummel P.B., Fraser P.J., Steele L.P., et al. Growing atmospheric emissions of sulfuryl fluoride. J. Geophys. Res. Atmos. 2021;126:e2020JD034327. doi: 10.1029/2020JD034327. - DOI
    1. NIOSH Pocket Guide to Chemical Hazards. National Institute for Occupational Safety and Health (NIOSH); Washington, DC, USA: 2019.
    1. Papadimitriou V.C., Portmann R.W., Fahey D.W., Mühle J., Weiss R.F., Burkholder J.B. Experimental and theoretical study of the atmospheric chemistry and global warming potential of SO2F2. J. Phys. Chem. A. 2008;112:12657–12666. doi: 10.1021/jp806368u. - DOI - PubMed
    1. Sulbaek Andersen M.P., Blake D.R., Rowland F.S., Hurley M.D., Wallington T.J. Atmospheric chemistry of sulfuryl fluoride: Reaction with OH radicals, Cl atoms and O3, atmospheric lifetime, IR spectrum, and global warming potential. Environ. Sci. Technol. 2009;43:1067–1070. doi: 10.1021/es802439f. - DOI - PubMed

LinkOut - more resources