. 2023 Dec 19;25(1):22.
doi: 10.3390/ijms25010022.

High-Throughput Measure of Mitochondrial Superoxide Levels as a Marker of Coronary Artery Disease to Accelerate Drug Translation in Patient-Derived Endothelial Cells Using Opera Phenix® Technology

Affiliations

High-Throughput Measure of Mitochondrial Superoxide Levels as a Marker of Coronary Artery Disease to Accelerate Drug Translation in Patient-Derived Endothelial Cells Using Opera Phenix® Technology

Weiqian E Lee et al. Int J Mol Sci. .

Abstract

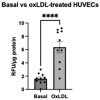
Improved human-relevant preclinical models of coronary artery disease (CAD) are needed to improve translational research and drug discovery. Mitochondrial dysfunction and associated oxidative stress contribute to endothelial dysfunction and are a significant factor in the development and progression of CAD. Endothelial colony-forming cells (ECFCs) can be derived from peripheral blood mononuclear cells (PBMCs) and offer a unique potentially personalised means for investigating new potential therapies targeting important components of vascular function. We describe the application of the high-throughput and confocal Opera Phenix® High-Content Screening System to examine mitochondrial superoxide (mROS) levels, mitochondrial membrane potential, and mitochondrial area in both established cell lines and patient-derived ECFCs simultaneously. Unlike traditional plate readers, the Opera Phenix® is an imaging system that integrates automated confocal microscopy, precise fluorescent detection, and multi-parameter algorithms to visualize and precisely quantify targeted biological processes at a cellular level. In this study, we measured mROS production in human umbilical vein endothelial cells (HUVECs) and patient-derived ECFCs using the mROS production probe, MitoSOXTM Red. HUVECs exposed to oxidized low-density lipoprotein (oxLDL) increased mROS levels by 47.7% (p < 0.0001). A pooled group of patient-derived ECFCs from participants with CAD (n = 14) exhibited 30.9% higher mROS levels compared to patients with no CAD when stimulated with oxLDL (n = 14; p < 0.05). When tested against a small group of candidate compounds, this signal was attenuated by PKT-100 (36.22% reduction, p = 0.03), a novel P2X7 receptor antagonist. This suggests the P2X7 receptor as a valid target against excess mROS levels. As such, these findings highlight the potential of the MitoSOX-Opera Phenix technique to be used for drug discovery efforts in CAD.

Keywords: drug screening; endothelial colony-forming cells; endothelial dysfunction; high-content imaging; high-throughput screening; mROS; mitochondria.


Conflict of interest statement

G.A.F. has received grant support from the National Health & Medical Research Council (Australia), Abbott Diagnostic, Sanofi, Janssen Pharmaceuticals, and NSW Health. G.A.F. has received personal fees from CSL and CPC Clinical Research. G.A.F. serves as a Board Member for the Heart Foundation, President of the Australian Cardiovascular Alliance, Founding Director/CMO of Prokardia, and CSO of CAD Frontiers. G.A.F. has a patent “Patent Biomarkers and Oxidative Stress” which was awarded in the USA in May 2017 (US9638699B2) and licensed to Northern Sydney Local Health District. M.K. and G.A.F are co-founders of Prokardia Pty Ltd. and named inventors on a provisional patent filed by The University of Sydney (Use of P2X7R antagonists in cardiovascular disease; PCT/AU2018/050905) licensed by start-up Prokardia as well as a provisional method-of-use patent for AZD9056– “Adamantyl P2X7 receptor antagonists and their use in the treatment of cardiovascular diseases” (P0061015AU). W.E.L., M.B., E.G., O.T., S.T.V., K.A.K, M.P.G. and S.M.G. report no conflict of interest.

Figures
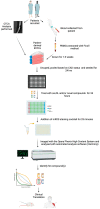
Figure 1
Figure 1
Schematic diagram of the workflow of the approach for diagnostic and therapeutic application of the Opera Phenix® High-Content System. Created using BioRender.com (accessed 12 October 2023).
Figure 2
Figure 2
Evaluation of fluorescent microscopy results of mROS production of HUVECs stimulated with or without oxLDL. MROS•− was evaluated in HUVECs using 5 μM MitoSOXTM Red. Relative fluorescence was normalised to protein content (per μg). Data were represented as mean ± S.E.M. Ten independent experiments were performed (n = 10). Each condition was performed in triplicate. **** p < 0.0001, paired samples t-test was performed.
Figure 3
Figure 3
Post hoc automated analysis workflow using the Harmony® High-Content Imaging and Analysis Software (version 5.2). (A) The nuclei are first identified by the system using the Hoechst 33342 channel. (B) The mitochondrial region is then identified using the MitoTrackerTM Deep Red channel around the nuclei that was identified previously. (C) MitoSOXTM Red signal captured within the mitochondrial region and MitoSOXTM Red fluorescence is measured using the ‘sliding parabola’ algorithm. Scale bar = 50 μm.
Figure 4
Figure 4
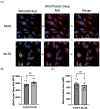
(A) Representative Opera Phenix® fluorescent confocal microscopy images showing specific colocalization of mROS production of HUVECs with/without oxLDL stimulation using 5 μM MitoSOXTM Red (yellow), 20 nM MitoTrackerTM Deep Red staining (red) of the mitochondrial region of cells, and Hoechst 33342 (blue) to determine cell nuclei. Twenty fields of view were taken per well. Scale bar = 50 μm. Non-specific fluorescence that does not colocalise with the MitoTrackerTM Deep Red fluorescence is excluded from the quantification. Evaluation of (B) mitochondrial membrane potential and (C) mitochondrial area using 20 nM MitoTrackerTM Deep Red between HUVECs treated with/without oxLDL using MitoTrackerTM Deep Red. Data were represented as mean ± S.E.M. Seven independent experiments were performed. Each condition was performed in triplicate. ns means non-significant, paired samples t-test was performed.
Figure 5
Figure 5
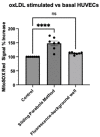
Evaluation of image analysis methods using the automated Harmony® software. The MitoSOXTM Red intensity was evaluated using two methods: ‘sliding parabola’ and ‘fluorescence minus background well’ after 24 h of treatment with or without oxLDL. Data are represented as mean ± S.E.M. Seven independent experiments were performed. Each condition was performed in triplicate. **** p < 0.0001, ns means non-significant, one-way ANOVA followed by Dunnett’s multiple comparisons test.
Figure 6
Figure 6
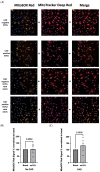
OxLDL stimulation realises differences in redox signature in pooled groups of patient-derived ECFCs with or without CAD. (A) Representative confocal images of pooled patient-derived ECFCs with no CAD, pooled patient-derived ECFCs with CAD, oxLDL-stimulated, pooled patient-derived ECFCs with no CAD and oxLDL-stimulated, pooled patient-derived ECFCs with clinically actionable CAD stained with 5 μM MitoSOXTM Red (yellow), 10 nM MitoTrackerTM Deep Red (red) and using 5 μM MitoSOXTM Red (yellow), 20 nM MitoTrackerTM Deep Red (red), and Hoechst 33342 (blue). Ten fields of view were taken per well. Scale bar = 100 μm. (BE) MROS was evaluated in pooled groups of patient-derived ECFCs with/without CAD at basal or oxLDL-stimulated conditions using 5 μM MitoSOXTM Red. (B,C) MitoSOXTM Red Signal % increase was determined by normalising oxLDL-stimulated groups to basal groups. (D,E) MitoSOXTM Red Signal % increase was determined by normalising pooled groups of patient-derived ECFCs with CAD to pooled groups of patient-derived ECFCs without CAD. Each condition was performed in duplicate. (F) Mitochondrial membrane potential and (G) mitochondrial area were evaluated in pooled groups of patient-derived ECFCs with/without CAD in oxLDL-stimulated conditions using 20 nM MitoTrackerTM Deep Red. Data are represented as mean ± S.E.M. of three independent experiments (n = 3). * p < 0.05, ns means non-significant, independent samples t-test was performed.
Figure 6
Figure 6
OxLDL stimulation realises differences in redox signature in pooled groups of patient-derived ECFCs with or without CAD. (A) Representative confocal images of pooled patient-derived ECFCs with no CAD, pooled patient-derived ECFCs with CAD, oxLDL-stimulated, pooled patient-derived ECFCs with no CAD and oxLDL-stimulated, pooled patient-derived ECFCs with clinically actionable CAD stained with 5 μM MitoSOXTM Red (yellow), 10 nM MitoTrackerTM Deep Red (red) and using 5 μM MitoSOXTM Red (yellow), 20 nM MitoTrackerTM Deep Red (red), and Hoechst 33342 (blue). Ten fields of view were taken per well. Scale bar = 100 μm. (BE) MROS was evaluated in pooled groups of patient-derived ECFCs with/without CAD at basal or oxLDL-stimulated conditions using 5 μM MitoSOXTM Red. (B,C) MitoSOXTM Red Signal % increase was determined by normalising oxLDL-stimulated groups to basal groups. (D,E) MitoSOXTM Red Signal % increase was determined by normalising pooled groups of patient-derived ECFCs with CAD to pooled groups of patient-derived ECFCs without CAD. Each condition was performed in duplicate. (F) Mitochondrial membrane potential and (G) mitochondrial area were evaluated in pooled groups of patient-derived ECFCs with/without CAD in oxLDL-stimulated conditions using 20 nM MitoTrackerTM Deep Red. Data are represented as mean ± S.E.M. of three independent experiments (n = 3). * p < 0.05, ns means non-significant, independent samples t-test was performed.
Figure 7
Figure 7
Evaluation of cell viability. HUVECs were treated with compounds and/or oxLDL for 24 h. Cell viability was evaluated using a CellTiter-Glo® kit. Relative cell viability was calculated by normalising cell viability to the vehicle control. Cell viability in HUVECs treated with several concentrations of colchicine, PKT-100, or AZD9056 under (A) basal and (B) oxLDL-stimulated conditions. Data are represented as mean ± S.E.M. of at least 3 independent experiments. Each condition was performed in triplicate. One-way ANOVA followed by Dunnett’s multiple comparisons test. **** p < 0.0001.
Figure 8
Figure 8
Dose–response curve of (A) colchicine, (B) PKT-100, and (C) AZD9056 on mROS production at different concentrations in oxLDL-stimulated HUVECs. MROS levels were evaluated using 5 μM MitoSOXTM Red at 24 h after compound treatment using a fluorescence microplate reader. The % reduction was determined by normalising MitoSOXTM Red intensity to protein concentration before subsequently normalising to vehicle control. Data are represented as the mean ± S.D. of at least 3 independent experiments. Each condition was performed in triplicate.
Figure 9
Figure 9
Evaluation of drug candidates on mROS production, mitochondrial membrane potential, and mitochondrial area in pooled patient-derived ECFCs with CAD. (A) MROS production was evaluated using 5 μM MitoSOXTM Red at 24 h after 100 nM drug treatment using the Opera Phenix®. The % reduction was determined by normalising MitoSOXTM Red intensity of CAD patient-derived ECFCs treated with different compounds to CAD patient-derived ECFCs treated with vehicle control (VC). (B) Mitochondrial membrane potential and (C) mitochondrial area was evaluated using 20 nM MitoTrackerTM Deep Red at 24 h after 100 nM PKT-100 treatment using the Opera Phenix®. Data are represented as the mean ± S.D. Results are presented as an average of three independent experiments (n = 3). Unpaired t-test was performed. * p < 0.05, ns means non-significant.

References

    1. Cardiovascular Diseases (CVDs) [(accessed on 24 April 2023)]. Available online: https://www.who.int/news-room/fact-sheets/detail/cardiovascular-diseases...
    1. Libby P., Buring J.E., Badimon L., Hansson G.K., Deanfield J., Bittencourt M.S., Tokgözoğlu L., Lewis E.F. Atherosclerosis. Nat. Rev. Dis. Primer. 2019;5:56. doi: 10.1038/s41572-019-0106-z. - DOI - PubMed
    1. Lee W.E., Genetzakis E., Figtree G.A. Novel Strategies in the Early Detection and Treatment of Endothelial Cell-Specific Mitochondrial Dysfunction in Coronary Artery Disease. Antioxidants. 2023;12:1359. doi: 10.3390/antiox12071359. - DOI - PMC - PubMed
    1. Xu S., Ilyas I., Little P.J., Li H., Kamato D., Zheng X., Luo S., Li Z., Liu P., Han J., et al. Endothelial Dysfunction in Atherosclerotic Cardiovascular Diseases and Beyond: From Mechanism to Pharmacotherapies. Pharmacol. Rev. 2021;73:924–967. doi: 10.1124/pharmrev.120.000096. - DOI - PubMed
    1. Wang D., Yang Y., Lei Y., Tzvetkov N.T., Liu X., Yeung A.W.K., Xu S., Atanasov A.G. Targeting Foam Cell Formation in Atherosclerosis: Therapeutic Potential of Natural Products. Pharmacol. Rev. 2019;71:596–670. doi: 10.1124/pr.118.017178. - DOI - PubMed