. 2023 Dec 19;25(1):54.
doi: 10.3390/ijms25010054.

Gene Characterization of Nocturnin Paralogues in Goldfish: Full Coding Sequences, Structure, Phylogeny and Tissue Expression

Affiliations

Gene Characterization of Nocturnin Paralogues in Goldfish: Full Coding Sequences, Structure, Phylogeny and Tissue Expression

Diego Madera et al. Int J Mol Sci. .

Abstract

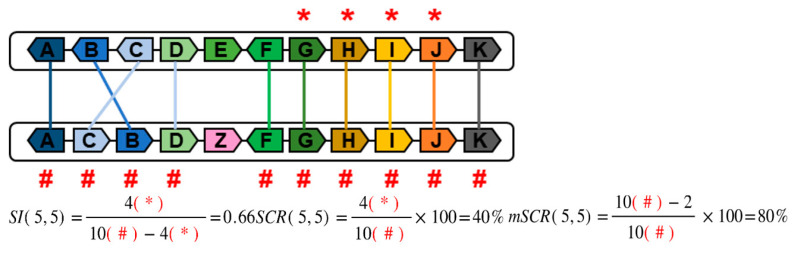
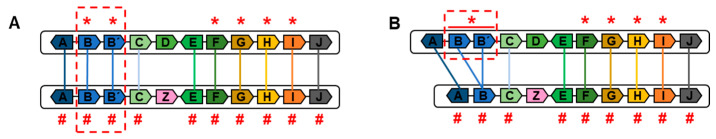
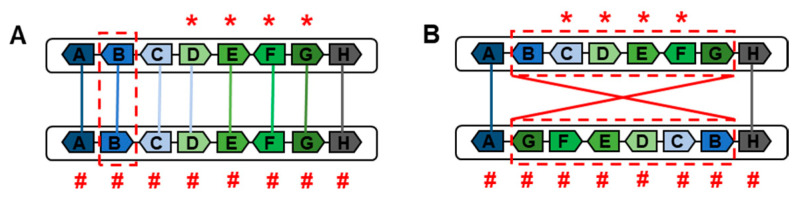
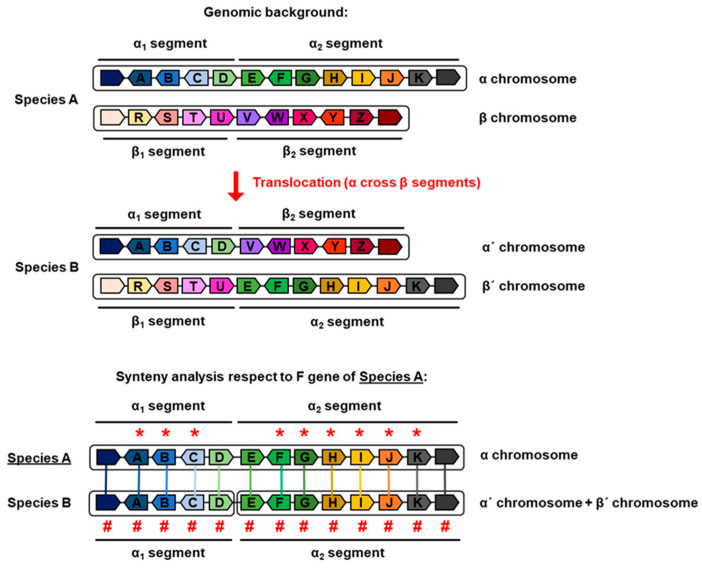
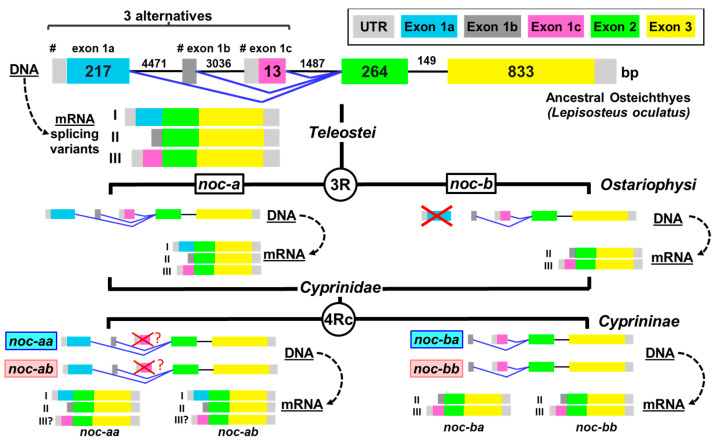
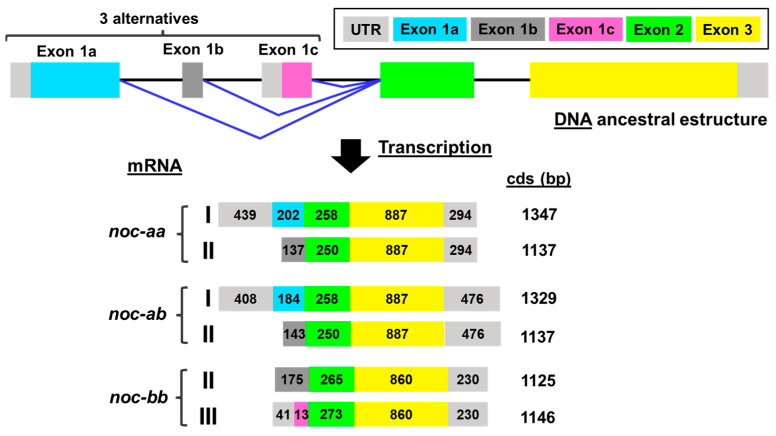
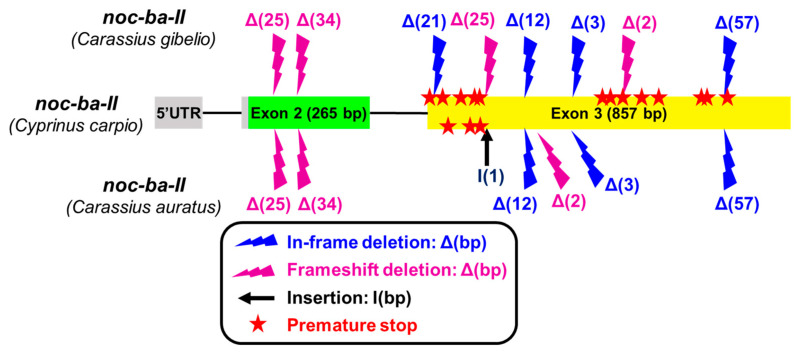
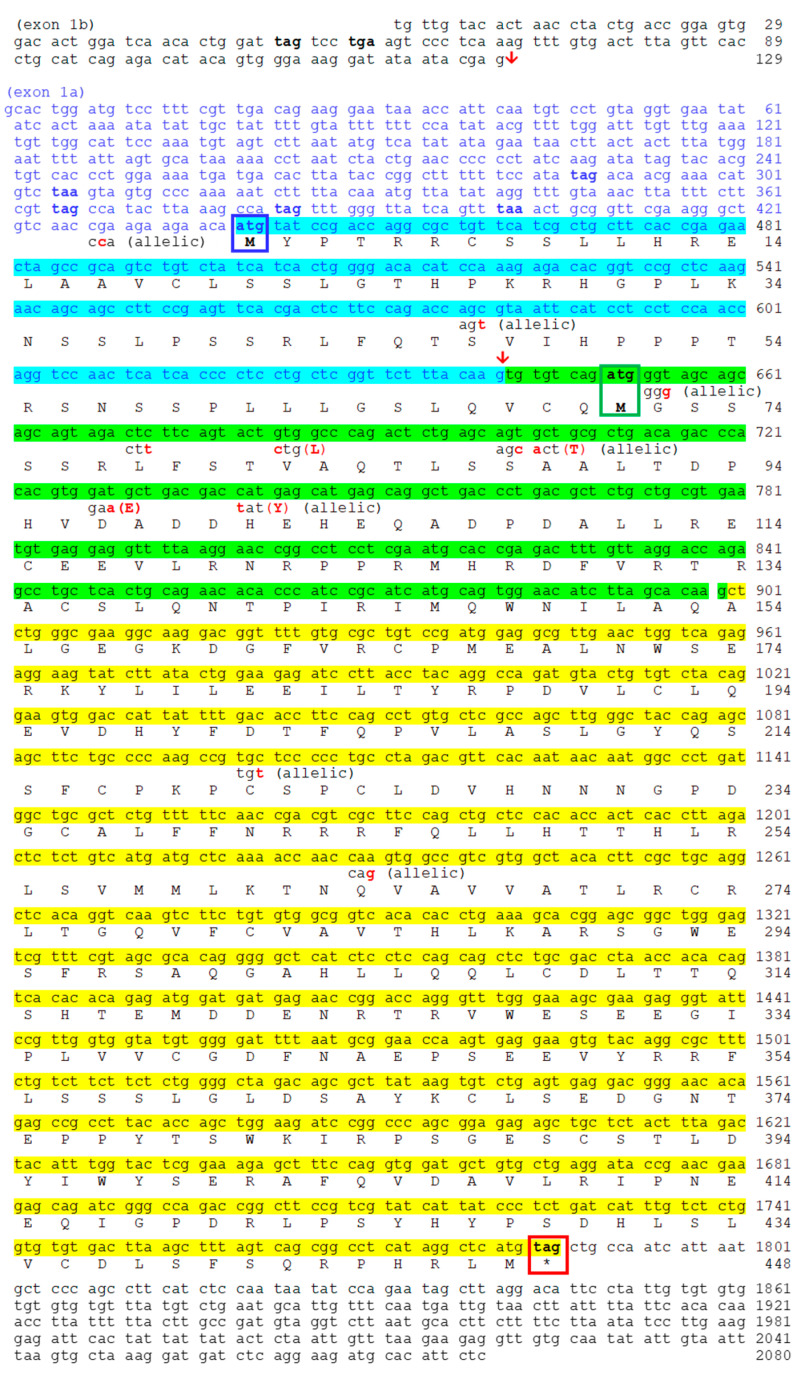
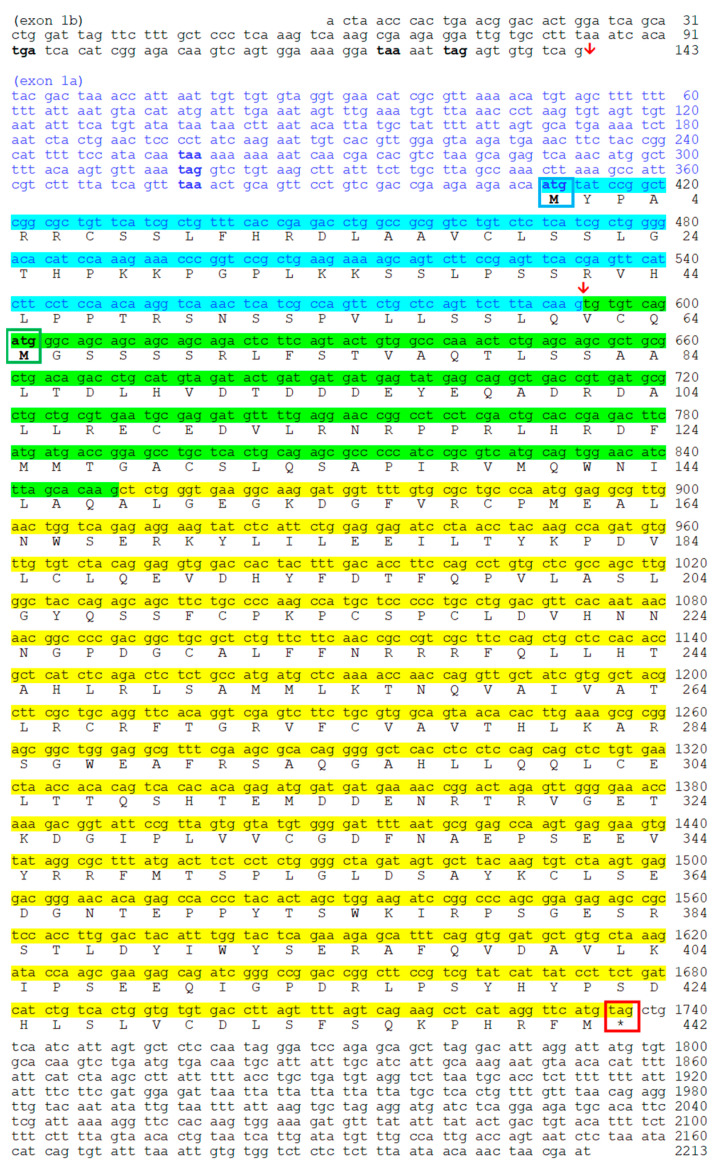
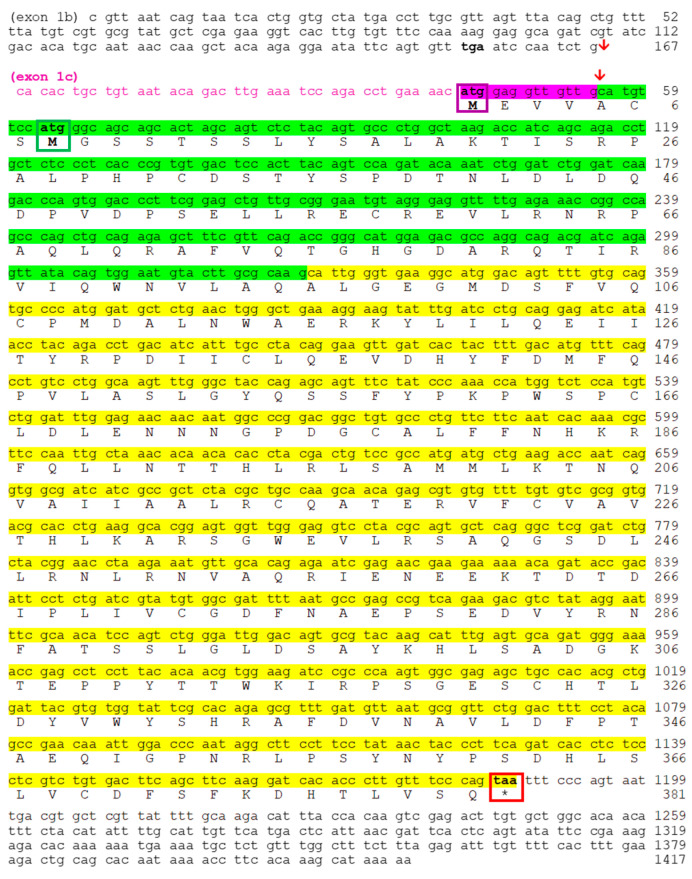
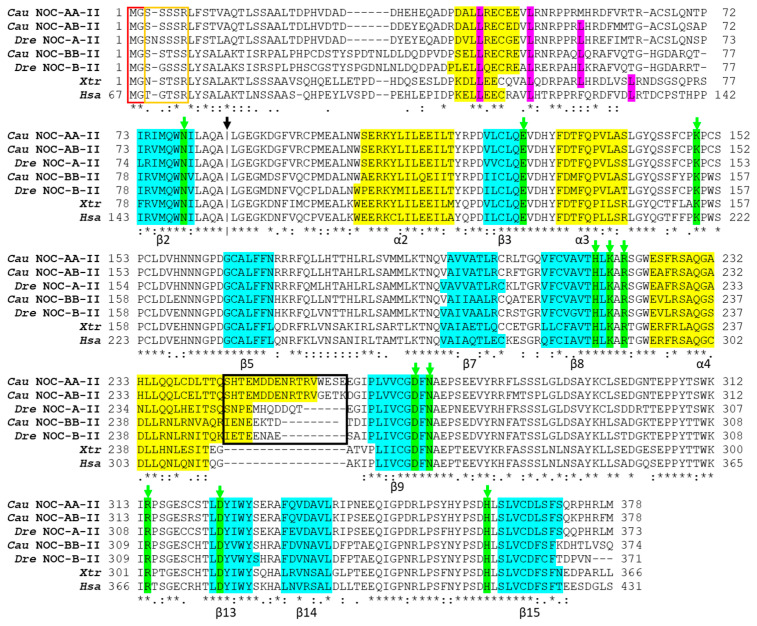
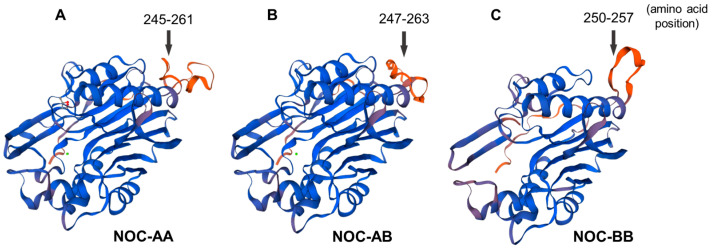
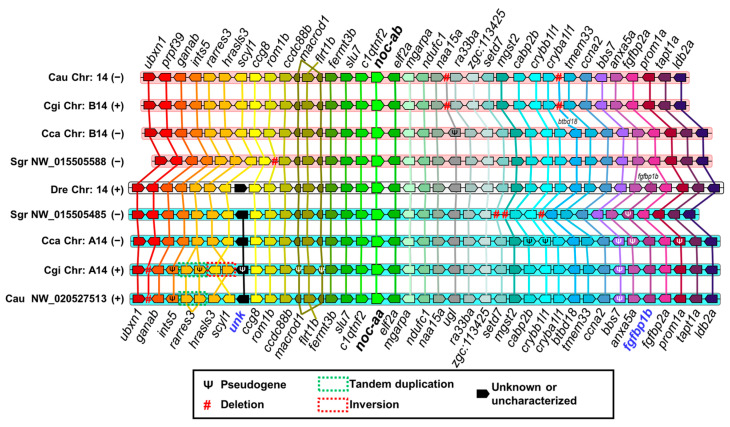
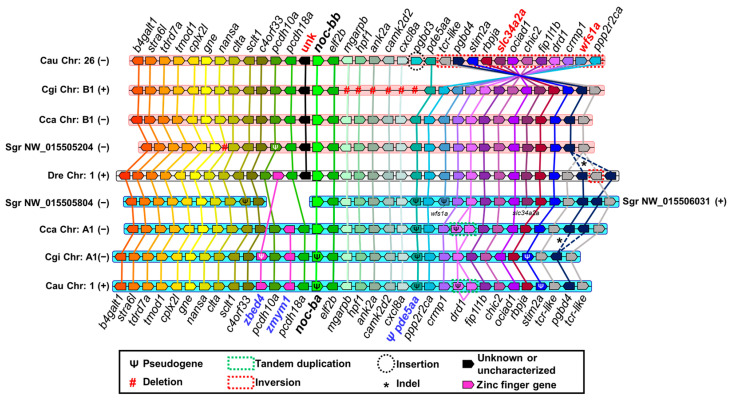
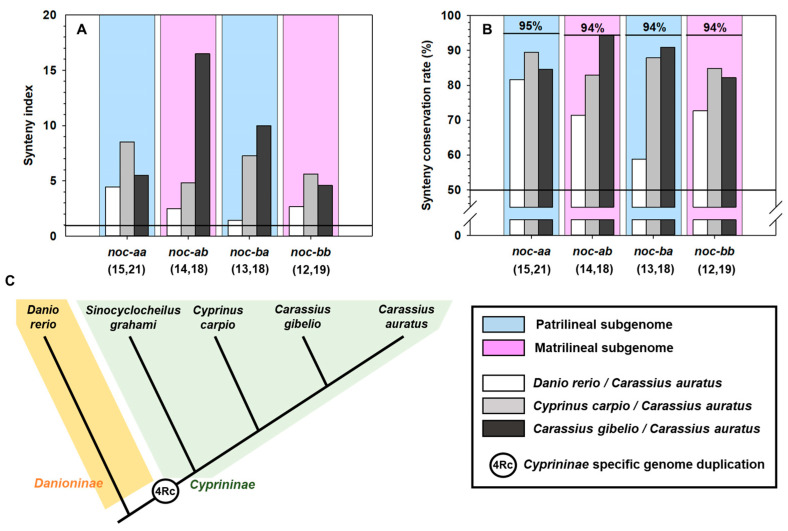
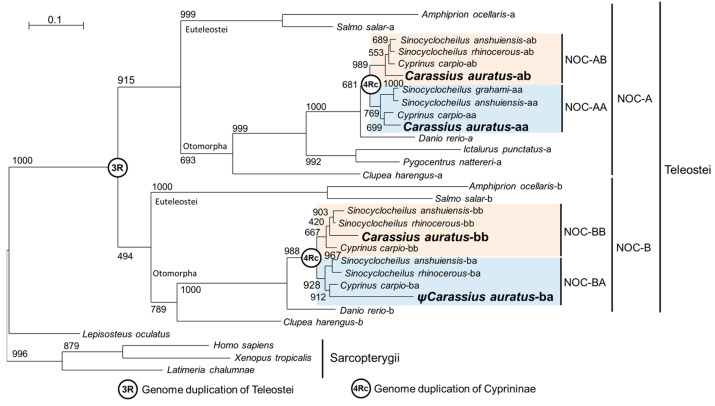
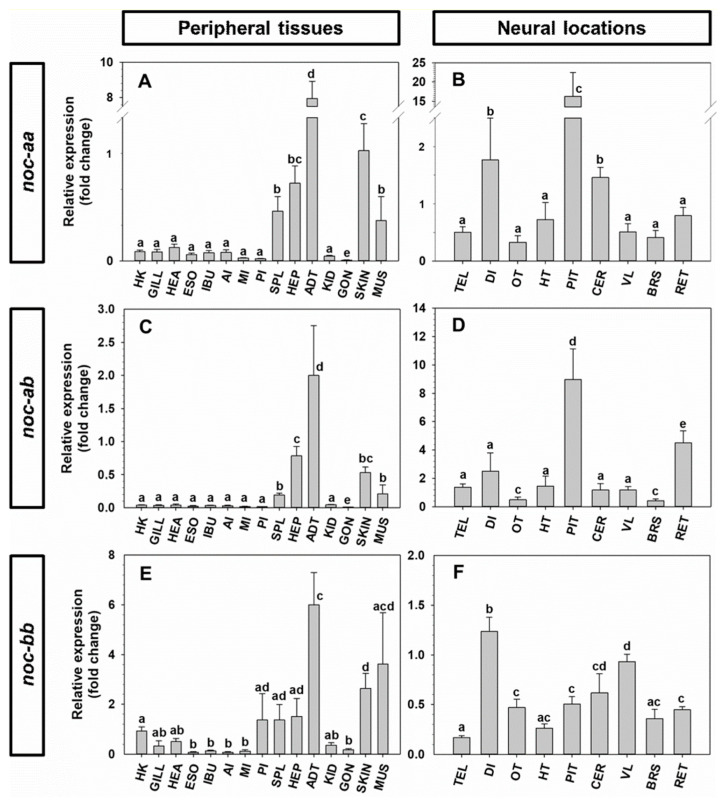
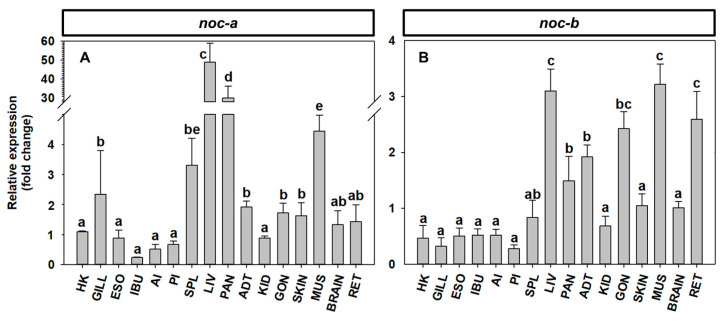
The aim of this work is the full characterization of all the nocturnin (noc) paralogues expressed in a teleost, the goldfish. An in silico analysis of the evolutive origin of noc in Osteichthyes is performed, including the splicing variants and new paralogues appearing after teleostean 3R genomic duplication and the cyprinine 4Rc. After sequencing the full-length mRNA of goldfish, we obtained two isoforms for noc-a (noc-aa and noc-ab) with two splice variants (I and II), and only one for noc-b (noc-bb) with two transcripts (II and III). Using the splicing variant II, the prediction of the secondary and tertiary structures renders a well-conserved 3D distribution of four α-helices and nine β-sheets in the three noc isoforms. A synteny analysis based on the localization of noc genes in the patrilineal or matrilineal subgenomes and a phylogenetic tree of protein sequences were accomplished to stablish a classification and a long-lasting nomenclature of noc in goldfish, and valid to be extrapolated to allotetraploid Cyprininae. Finally, both goldfish and zebrafish showed a broad tissue expression of all the noc paralogues. Moreover, the enriched expression of specific paralogues in some tissues argues in favour of neo- or subfunctionalization.

Keywords: Carassius auratus; gene evolution; molecular cloning; nocturnin nomenclature; phylogenetic tree; protein structure; synteny analysis; synteny quantification; tissue distribution; zebrafish.


Conflict of interest statement

The authors declare no conflict of interest. The funders had no role in the design of the study; in the collection, analyses, or interpretation of data; in the writing of the manuscript; or in the decision to publish the results.

Figures

Figure A1
Figure A1
Schematic representation of two orthologous chromosome segments. White boxes represent the chromosomes. Genes are represented with pentagons whose sharp vertex indicates the transcription sense. Same colors and letters indicate same genes. *, genes with conserved relative position. #, genes in common.
Figure A2
Figure A2
Schematic representation of tandem duplication in two (A) or one (B) orthologous chromosome segments. White boxes represent the chromosomes. Genes are represented with pentagons whose sharp vertex indicates the transcription sense. Similar colors and letters indicate the same genes. Red boxes indicate tandem duplication. * refers to genes with a conserved relative position between both chromosome segments. # refers togenes in common on both chromosome segments.
Figure A3
Figure A3
Schematic representation of a single (A) and a gene cluster (B) inversion in two orthologous chromosome segments. White boxes represent the chromosomes. Genes are represented with pentagons whose sharp vertex indicates the transcription sense. Similar colors and letters indicate the same genes. Red boxes indicate the gene and inverted gene cluster. * refers to genes with a conserved relative position between both chromosome segments. # refers to genes in common on both chromosome segments.
Figure A4
Figure A4
Schematic representation of a synteny analysis in a translocation of two orthologous chromosomes. White boxes indicate the chromosomes. Genes are represented with pentagons whose sharp vertex indicates the transcription sense. Similar colors and/or letters indicate the same genes. The red arrow indicates the translocation point. * refers to genes with a conserved relative position between both chromosome segments. # refers to genes in common on both chromosome segments.
Figure 1
Figure 1
Nocturnin gene structure in Osteichthyes. Full-genome duplications are indicated as 3R (Teleostei specific) and 4Rc (Cyprininae specific). Proposed model for the exon–intron structure of the gene encoding nocturnin in different Osteichthyes clades, and its transcription into mRNA (dashed lines). The I, II and III indicate the alternative splicing variants. # indicates the alternative transcription start sites. Exons are represented by boxes and introns by lines. Angled blue lines indicate alternative splicing of the first exon (exon 1a, exon 1b or exon 1c) in mature mRNA. The length (bases pair, bp) of exons (inside the boxes) and introns (above lines) is indicated for the Lepisosteus oculatus gene. Lost exons during evolution of Ostariophysi and Cyprininae are represented by red crosses. Question marks indicate unconfirmed loss of variant III in the noc-a paralogues of cyprinines. Light pink and cyan backgrounds on Cyprininae nocturnin names indicate matrilineal and patrilineal origin, respectively.
Figure 2
Figure 2
Exon-intron structure and transcription pattern of nocturnin gene paralogues in goldfish obtained by mRNA sequencing. I, II, and III indicate the alternative splicing variants. Exon 1a, exon 1b, and exon 1c are the alternatives of the first exon in mature mRNA. Angled blue lines indicate an alternative splicing mechanism. Coding exons are indicated by colored boxes and introns by lines. Grey boxes indicate untranslated regions (UTR and exon 1b). The length (bases pair, bp) of exons is indicated inside the boxes. The length of coding sequences (cds) is also indicated.
Figure 3
Figure 3
Mutations accumulated in the noc-ba paralogue of Carassius gibelio (Gene ID: 127988217) and Carassius auratus (Gene ID: 113105808) compared to Cyprinus carpio (accession no. XM_019094354.2). Illustration represents the exon–intron structure of the splicing variant II of noc-ba. Exons are indicated by boxes and introns by lines. The symbols above (C. gibelio) and below (C. auratus) indicate the mutations compared to C. carpio sequence. The blue and purple rays represent in-frame and frameshift deletions, respectively, and the base pairs suppressed, Δ(bp). The black arrow I(1) indicates an insertion of 1 bp. The red stars represent premature stop codons in transcribed sequence.
Figure 4
Figure 4
Nucleotide and deduced amino acid sequences of goldfish noc-aa. Sequences are accessible through GenBank. Splice Variant I is composed of exon 1a in blue (coding sequence with cyan background), exon 2 (green background) and exon 3 (yellow background) (allele 1 accession no. OR651354). Splice Variant II is composed of non-coding exon 1b, exon 2, and exon 3 (accession no. OR651356). Red arrow indicates the insertion point of exon 1a or exon 1b on exon 2. Bold font indicates stop codons upstream of the initial methionine codon. Coding region extends from the first methionine residue (blue box for variant I, green box for variant II) to the stop codon (* and red box). Backgrounds colored cyan, green, and yellow indicate the coding part of exon 1a, 2, and 3, respectively. Red letters indicate differences in nucleotides and amino acids between the two allelic sequences (allele 2, accession no. OR651355 and OR651357).
Figure 5
Figure 5
Nucleotide and deduced amino acid sequences of goldfish noc-ab. Both sequences are accessible through GenBank. Splice Variant I is composed of exon 1a in blue (coding sequence with cyan background), exon 2 (green background), and exon 3 (yellow background) (accession no. OR651297). Splice Variant II is composed of non-coding exon 1b, exon 2, and exon 3 (accession no. OR651298). Red arrow indicates the insertion point of exon 1a or exon 1b on exon 2. Bold font indicates stop codons upstream of initial methionine codon. Coding region extends from the first methionine residue (blue box for variant I, green box for variant II) to the stop codon (* and red box). Backgrounds cyan, green and yellow indicate the coding part of exons 1a, 2, and 3, respectively.
Figure 6
Figure 6
Nucleotide and deduced amino acid sequences of goldfish noc-bb. Both sequences are accessible through GenBank. Splice Variant III is composed of exon 1c in purple (coding sequence with purple background), exon 2 (green background), and exon 3 (yellow background) (accession no. OR651299). Splice Variant II is composed of non-coding exon 1b, exon 2, and exon 3 (accession no. OR651300). Red arrow indicates the insertion point of exon 1b or exon 1c on exon 2. Bold font indicates stop codons upstream of initial methionine codon. Coding region extends from the first methionine residue (purple box for variant III, green box for variant II) to the stop codon (* and red box). Backgrounds colored purple, green and yellow indicate exons 1c, 2, and 3, respectively.
Figure 7
Figure 7
Alignment of the deduced amino acid sequences of splicing variant II of goldfish NOC-AA (Cau NOC-AA-II: WNX29031), NOC-AB (Cau NOC-AB-II: WNX29026), and NOC-BB (Cau NOC-BB-II: WNX29028) with NOC sequences from Danio rerio (Dre NOC-A-II: XP_005169676.1) and (Dre NOC-B-II: XP_021331689.1), Xenopus tropicalis (Xtr: KAE8630336.1), and Homo sapiens (Hsa: NP_036250.2). Multiple sequence alignment was conducted using Clustal v.X2. Bottom symbols (. : *), indicating a significant conservation from minor to major. Horizontal hyphens indicate gaps introduced to optimize the alignment. The vertical hyphen line (black arrow) marks the transition between exon 2 and 3. The secondary structure was predicted using JPred4. Structural elements are indicated as follows: yellow boxes (α-helix) and blue boxes (β-sheet). The names of α and β follow the nomenclature of Abshire and coworkers [27]. Green boxes pointed to by a green arrow indicate the amino acids conserved in the active site. Pink boxes mark the position of the heptad leucine repeat. Red rectangles indicate putative myristoylation sites, and the orange rectangle indicates a Ser/Thr-rich region. Black rectangles indicate the non-conserved domain of goldfish NOC paralogues compared to human and frog NOC.
Figure 8
Figure 8
Tertiary predicted 3D structures of splicing variant II of goldfish; nocturnin: NOC-AA (A), NOC-AB (B), and NOC-BB (C). In blue are the conserved segments. The non-conserved domains in human and goldfish are represented in orange (the arrows indicate the amino acids’ position in Figure 7).
Figure 9
Figure 9
Synteny analysis of noc-a paralogues in Danio rerio (Dre), Sinocyclocheilus graham (Sgr), Cyprinus carpio (Cca), Carassius gibelio (Cgi), and Carassius auratus (Cau). Black bolded names indicate nocturnin paralogues in the center of synteny. Chromosomes are represented with a white background in Danio rerio (as the reference species) and a cyan or pink background in the other species, depending on the patrilineal or matrilineal subgenome, respectively, of the ancestral duplication of Cyprininae (4Rc). Chromosome coding corresponds to that of the genome project (Supplementary Table S2), and the (+) or (−) symbols represent the sense or antisense orientation of the chromosome, respectively, in the projects analyzed. Genes are represented with pentagons whose sharp vertex indicates the transcription sense. Same colors indicate orthologous genes. Black pentagons represent unknown genes or genes without orthologous in any chromosome analyzed. Mutations are inferred comparing the orthologous chromosomes: pseudogene (Ψ), deletion (#), tandem duplication (green dashed boxes), and inversion (red dashed boxes). Gene abbreviations are indicated in the Supplementary Table S3. Gene names in bold blue indicate diagnostic markers of patrilineal chromosomes.
Figure 10
Figure 10
Synteny analysis of noc-b paralogues in Danio rerio (Dre), Sinocyclocheilus graham (Sgr), Cyprinus carpio (Cca), Carassius gibelio (Cgi), and Carassius auratus (Cau). Black bolded names indicate nocturnin paralogues in the center of synteny. Chromosomes are represented with a white background in Danio rerio (as reference species) and with a cyan or pink background in the other species depending on the patrilineal or matrilineal subgenome, respectively, of the ancestral duplication of Cyprininae (4Rc). Chromosome coding corresponds to that of the genome project (supplementary Table S2), and the (+) or (−) symbols represent the sense or antisense orientation of the chromosome, respectively, in the projects analyzed. Genes are represented with pentagons whose sharp vertex indicates the transcription sense. Same colors indicate orthologous genes. Black pentagons represent unknown genes. Pink pentagons indicate zinc finger genes. Mutations are inferred comparing the orthologous chromosomes: pseudogene (Ψ), deletion (#), tandem duplication (green boxes), inversion (red boxes), insertion (black circle), and provisional indel (*). Gene abbreviations are indicated in the Supplementary Table S4. Gene names in bold blue (below) or bold brown (above) indicate diagnostic markers of patrilineal or matrilineal chromosomes, respectively.
Figure 11
Figure 11
(A,B) Synteny index and synteny conservation rate in Carassius auratus compared to Danio rerio (white), Cyprinus carpio (light gray) and Carassius gibelio (dark gray). Numbers in parentheses indicate genes upstream and downstream of the noc paralogue analyzed. Blue and pink backgrounds indicate patrilineal or matrilineal origin of chromosomes, respectively. The lower horizontal line indicates the threshold (1 for synteny index, 50% for synteny conservation rate), where the conserved loci positions are more frequent than the non-conserved. The line above in the graphs in B indicates the maximum synteny conservation rate (%) for each paralogue. (C) Assumed phylogeny of species analyzed in the synteny study.
Figure 12
Figure 12
Phylogenetic tree showing the 4Rc relationships among NOC sequences. The evolutionary model used was the Jones–Taylor–Thornton, Gamma-distributed (JTT + G). The tree was inferred by the maximun likelihood method (ML). The numbers in the nodes refer to bootstrap values of a total of 1000 replicates. The scale bar indicates the average number of substitutions per position. The binomial name of the species is given on the right side of the tree. Letters A and B indicate NOC isoforms in teleosts. 3R and 4Rc indicate the proposed whole-genome duplication events in Teleostei and Cyprininae, respectively. Blue and pink boxes indicate the patrilineal of matrilineal clades of Cyprininae species, respectively. Ψ, indicates pseudogene. Species names and GenBank accession numbers of the sequences are indicated in Supplementary Figure S3.
Figure 13
Figure 13
Expression of noc-aa, noc-ab and noc-bb in peripheral (A,C,E) and neural tissues of goldfish. Data are expressed as mean + S.E.M. (n = 6) relative to the hepatopancreas (A,C,E) and to the diencephalon (B,D,F). Different letters indicate statistical differences among tissues (ANOVA-SNK; p < 0.05). Head kidney (HK), gill (GILL), heart (HEA), esophagus (ESO), intestinal bulb (IBU), anterior intestine (AI), middle intestine (MI), posterior intestine (PI), spleen (SPL), hepatopancreas (HEP), adipose tissue (ADT), caudal kidney (KID), gonad (GON), skin (SKIN), muscle (MUS), telencephalon (TEL), diencephalon (DI), optic tectum (OT), hypothalamus (HT), pituitary (PIT), cerebellum (CER), vagal lobe (VL), brainstem (BRS), retina (RET).
Figure 14
Figure 14
Expression of noc-a (A) and noc-b (B) in peripheral tissues and brain in zebrafish. Data are expressed as mean + S.E.M. (n = 5) relative to the brain. Different letters indicate statistical differences among tissues (ANOVA-SNK; p < 0.05). Head kidney (HK), gill (GILL), esophagus (ESO), intestinal bulb (IBU), anterior intestine (AI), posterior intestine (PI), spleen (SPL), liver (LIV), pancreas (PAN), adipose tissue (ADT), caudal kidney (KID), gonad (GON), skin (SKIN), muscle (MUS), brain (BRAIN), retina (RET).

Similar articles

Cited by

References

    1. Green C.B., Besharse J.C. Identification of a novel vertebrate circadian clock-regulated gene encoding the protein nocturnin. Proc. Natl. Acad. Sci. USA. 1996;93:14884–14888. doi: 10.1073/pnas.93.25.14884. - DOI - PMC - PubMed
    1. Müller W.E.G., Wang X., Grebenjuk V.A., Korzhev M., Wiens M., Schlossmacher U., Schröder H.C. Nocturnin in the demosponge Suberites domuncula: A potential circadian clock protein controlling glycogenin synthesis in sponges. Biochem. J. 2012;448:233–242. doi: 10.1042/BJ20120357. - DOI - PubMed
    1. Chang V., Meuti M.E. Circadian transcription factors differentially regulate features of the adult overwintering diapause in the Northern house mosquito, Culex pipiens. Insect Biochem. Mol. Biol. 2020;121:103365. doi: 10.1016/j.ibmb.2020.103365. - DOI - PubMed
    1. Grönke S., Bickmeyer I., Wunderlich R., Jäckle H., Kühnlein R.P. Curled encodes the Drosophila homolog of the vertebrate circadian deadenylase nocturnin. Genetics. 2009;183:219–232. doi: 10.1534/genetics.109.105601. - DOI - PMC - PubMed
    1. Yang X., Fu J., Wei X. Expression patterns of zebrafish nocturnin genes and the transcriptional activity of the frog nocturnin promoter in zebrafish rod photoreceptors. Mol. Vis. 2017;23:1039–1047. - PMC - PubMed

LinkOut - more resources