Integrated Bulk Segregant Analysis, Fine Mapping, and Transcriptome Revealed QTLs and Candidate Genes Associated with Drought Adaptation in Wild Watermelon
- PMID: 38203237
- PMCID: PMC10779233
- DOI: 10.3390/ijms25010065
Integrated Bulk Segregant Analysis, Fine Mapping, and Transcriptome Revealed QTLs and Candidate Genes Associated with Drought Adaptation in Wild Watermelon
Abstract
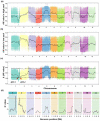
Drought stress has detrimental effects on crop productivity worldwide. A strong root system is crucial for maintaining water and nutrients uptake under drought stress. Wild watermelons possess resilient roots with excellent drought adaptability. However, the genetic factors controlling this trait remain uninvestigated. In this study, we conducted a bulk segregant analysis (BSA) on an F2 population consisting of two watermelon genotypes, wild and domesticated, which differ in their lateral root development under drought conditions. We identified two quantitative trait loci (qNLR_Dr. Chr01 and qNLR_Dr. Chr02) associated with the lateral root response to drought. Furthermore, we determined that a small region (0.93 Mb in qNLR_Dr. Chr01) is closely linked to drought adaptation through quantitative trait loci (QTL) validation and fine mapping. Transcriptome analysis of the parent roots under drought stress revealed unique effects on numerous genes in the sensitive genotype but not in the tolerant genotype. By integrating BSA, fine mapping, and the transcriptome, we identified six genes, namely L-Ascorbate Oxidase (AO), Cellulose Synthase-Interactive Protein 1 (CSI1), Late Embryogenesis Abundant Protein (LEA), Zinc-Finger Homeodomain Protein 2 (ZHD2), Pericycle Factor Type-A 5 (PFA5), and bZIP transcription factor 53-like (bZIP53-like), that might be involved in the drought adaptation. Our findings provide valuable QTLs and genes for marker-assisted selection in improving water-use efficiency and drought tolerance in watermelon. They also lay the groundwork for the genetic manipulation of drought-adapting genes in watermelon and other Cucurbitacea species.
Keywords: drought tolerance; genetic resources; genomics-assisted breeding; quantitative trait loci (QTL) mapping; transcriptome; wild watermelon.
Conflict of interest statement
The authors declare no conflict of interest.
Figures


Similar articles
-
The integration of quantitative trait locus mapping and transcriptome studies reveals candidate genes for water stress response in St. Augustinegrass.BMC Plant Biol. 2025 May 19;25(1):662. doi: 10.1186/s12870-025-06692-7. BMC Plant Biol. 2025. PMID: 40389851 Free PMC article.
-
Genetic mapping of physiological traits associated with terminal stage drought tolerance in rice.BMC Genet. 2020 Jul 14;21(1):76. doi: 10.1186/s12863-020-00883-x. BMC Genet. 2020. PMID: 32664865 Free PMC article.
-
Fine mapping QTL for drought resistance traits in rice (Oryza sativa L.) using bulk segregant analysis.Mol Biotechnol. 2011 Sep;49(1):90-5. doi: 10.1007/s12033-011-9382-x. Mol Biotechnol. 2011. PMID: 21298364
-
Using genetic mapping and genomics approaches in understanding and improving drought tolerance in pearl millet.J Exp Bot. 2011 Jan;62(2):397-408. doi: 10.1093/jxb/erq265. Epub 2010 Sep 5. J Exp Bot. 2011. PMID: 20819788 Review.
-
Recognizing the hidden half in wheat: root system attributes associated with drought tolerance.J Exp Bot. 2021 Jul 10;72(14):5117-5133. doi: 10.1093/jxb/erab124. J Exp Bot. 2021. PMID: 33783492 Review.
Cited by
-
Transient Receptor Potential Channels: Multiple Modulators of Peripheral Neuropathic Pain in Several Rodent Models.Neurochem Res. 2024 Apr;49(4):872-886. doi: 10.1007/s11064-023-04087-4. Epub 2024 Jan 28. Neurochem Res. 2024. PMID: 38281247 Review.
-
CmPPR4 gene controls drought resilience in melon ecotypes.Plant Biotechnol J. 2025 Jun;23(6):1881-1891. doi: 10.1111/pbi.70019. Epub 2025 Feb 22. Plant Biotechnol J. 2025. PMID: 39985786 Free PMC article.
References
-
- Regan P.M., Kim H., Maiden E. Climate change, adaptation, and agricultural output. Reg. Environ. Chang. 2018;19:113–123. doi: 10.1007/s10113-018-1364-0. - DOI
-
- FAOSTAT Food and Agriculture Organization of the United Nations. [(accessed on 16 August 2022)]. Available online: http://faostat.fao.org.
-
- Mall M., Kumar R., Akhtar M.Q. Chapter 1—Horticultural crops and abiotic stress challenges. In: Chandra Rai A., Rai A., Kumar Rai K., Rai V.P., Kumar A., editors. Stress Tolerance in Horticultural Crops. Woodhead Publishing; Sawston, UK: 2021. pp. 1–19.
MeSH terms
Substances
Grants and funding
- SCKJ-JYRC-2022-18/Project of Sanya Yazhou Bay Science and Technology City
- 321MS064/Natural Science Foundation of Hainan Province
- CARS25-17/Earmarked Fund for China Agriculture Research System
- 2017QNA6016, +226-2022-00100/the Fundamental Research Funds for the Central Universities
- LY21C150008/Zhejiang Provincial Natural Science Foundation
LinkOut - more resources
Full Text Sources
Research Materials
Miscellaneous

