

Genome-Wide Association Analysis of Heat Tolerance in F2 Progeny from the Hybridization between Two Congeneric Oyster Species
- PMID: 38203295
- PMCID: PMC10778899
- DOI: 10.3390/ijms25010125
Genome-Wide Association Analysis of Heat Tolerance in F2 Progeny from the Hybridization between Two Congeneric Oyster Species
Abstract
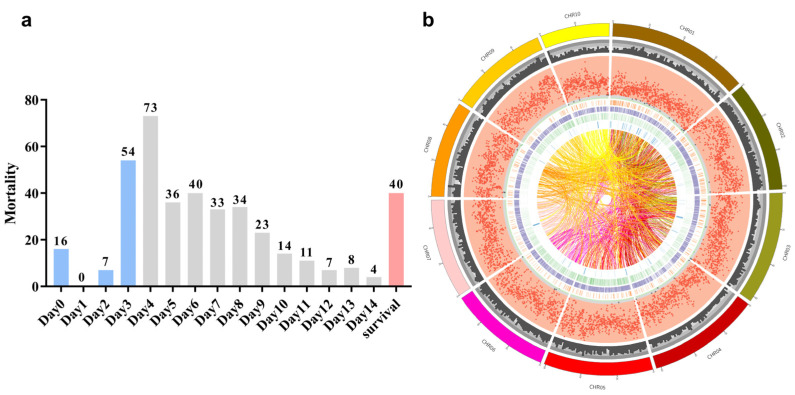
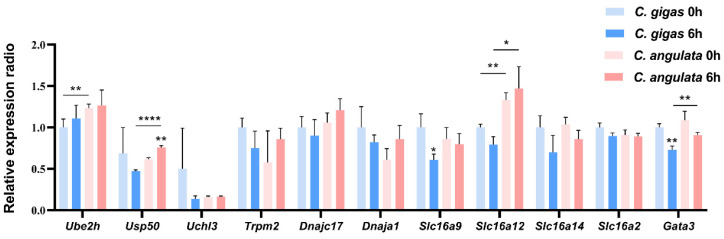
As the world's largest farmed marine animal, oysters have enormous economic and ecological value. However, mass summer mortality caused by high temperature poses a significant threat to the oyster industry. To investigate the molecular mechanisms underlying heat adaptation and improve the heat tolerance ability in the oyster, we conducted genome-wide association analysis (GWAS) analysis on the F2 generation derived from the hybridization of relatively heat-tolerant Crassostrea angulata ♀ and heat-sensitive Crassostrea gigas ♂, which are the dominant cultured species in southern and northern China, respectively. Acute heat stress experiment (semi-lethal temperature 42 °C) demonstrated that the F2 population showed differentiation in heat tolerance, leading to extremely differentiated individuals (approximately 20% of individuals die within the first four days with 10% survival after 14 days). Genome resequencing and GWAS of the two divergent groups had identified 18 significant SNPs associated with heat tolerance, with 26 candidate genes located near these SNPs. Eleven candidate genes that may associate with the thermal resistance were identified, which were classified into five categories: temperature sensor (Trpm2), transcriptional factor (Gata3), protein ubiquitination (Ube2h, Usp50, Uchl3), heat shock subfamily (Dnajc17, Dnaja1), and transporters (Slc16a9, Slc16a14, Slc16a9, Slc16a2). The expressional differentiation of the above genes between C. gigas and C. angulata under sublethal temperature (37 °C) further supports their crucial role in coping with high temperature. Our results will contribute to understanding the molecular mechanisms underlying heat tolerance, and provide genetic markers for heat-resistance breeding in the oyster industry.
Keywords: Crassostrea angulata; Crassostrea gigas; F2 progeny; GWAS; heat tolerance; oysters.
Conflict of interest statement
The authors declare that they have no known competing financial interest or personal relationships that could have appeared to influence the work reported in this paper.
Figures


References
-
- Xiao S., Wong N.K., Li J., Lin Y., Zhang Y.H., Ma H.T., Mo R.G., Zhang Y., Yu Z.N. Analysis of in situ Transcriptomes Reveals Divergent Adaptive Response to Hyper- and Hypo-Salinity in the Hong Kong Oyster, Crassostrea hongkongensis. Front. Physiol. 2018;9:1491. doi: 10.3389/fphys.2018.01491. - DOI - PMC - PubMed
-
- Yuasa M., Kawabeta K., Eguchi A., Abe H., Yamashita E., Koba K., Tominaga M. Characterization of taste and micronutrient content of rock oysters (Crassostrea nippona) and Pacific oysters (Crassostrea gigas) in Japan. Int. J. Gastron. Food Sci. 2018;13:52–57. doi: 10.1016/j.ijgfs.2018.06.001. - DOI
-
- Guo X.M. Use and exchange of genetic resources in molluscan aquaculture. Rev. Aquacult. 2009;1:251–259. doi: 10.1111/j.1753-5131.2009.01014.x. - DOI
-
- Guo Z.X., Zhao F.J.Z., Chen H., Tu M.L., Tao S.F., Wang Z.Y., Wu C., He S.D., Du M. Heat treatments of peptides from oyster (Crassostrea gigas) and the impact on their digestibility and angiotensin I converting enzyme inhibitory activity. Food Sci. Biotechnol. 2020;29:961–967. doi: 10.1007/s10068-020-00736-4. - DOI - PMC - PubMed
MeSH terms
LinkOut - more resources
Full Text Sources
Research Materials
Miscellaneous
