. 2023 Dec 21;25(1):141.
doi: 10.3390/ijms25010141.

Enhancement of Immune Functions by Limosilactobacillus reuteri KBL346: In Vitro and In Vivo Studies

Affiliations

Enhancement of Immune Functions by Limosilactobacillus reuteri KBL346: In Vitro and In Vivo Studies

Chanseop Park et al. Int J Mol Sci. .

Abstract

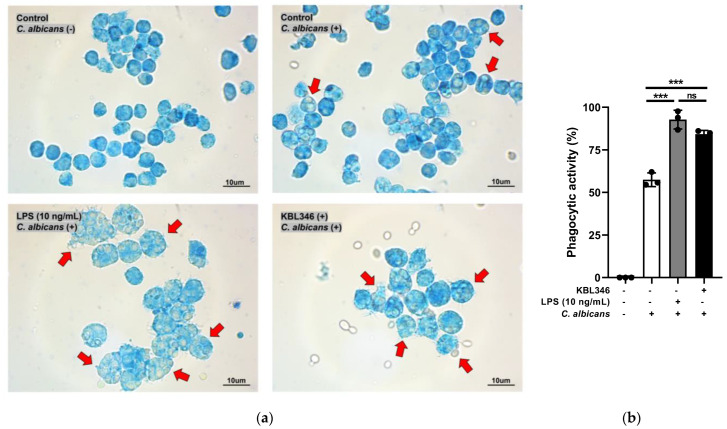
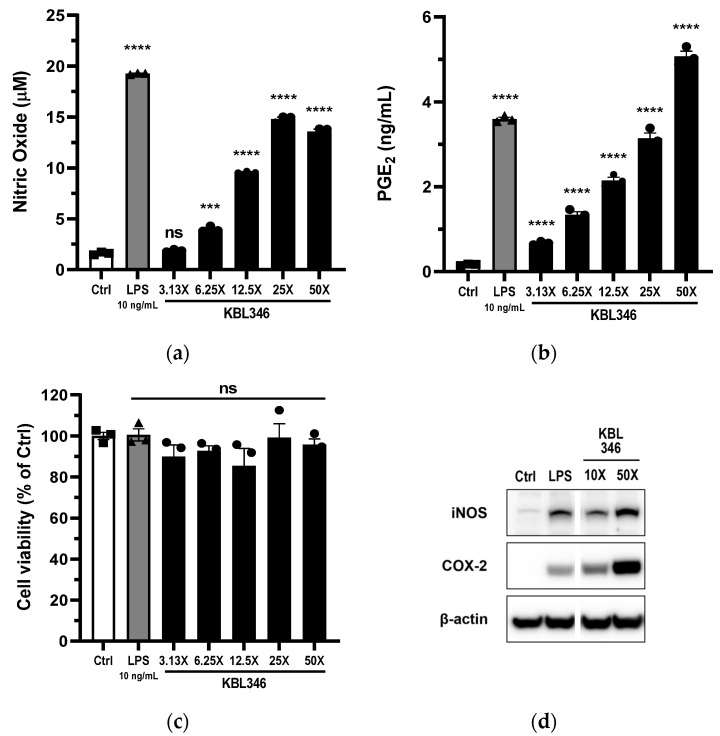
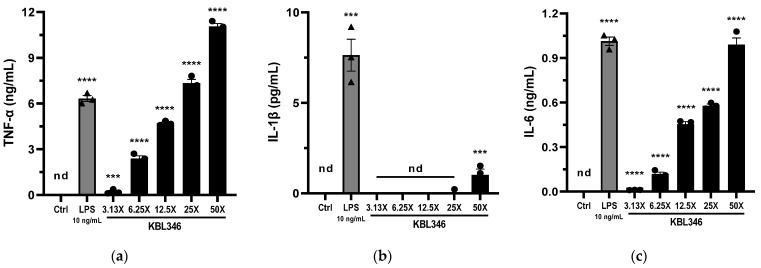
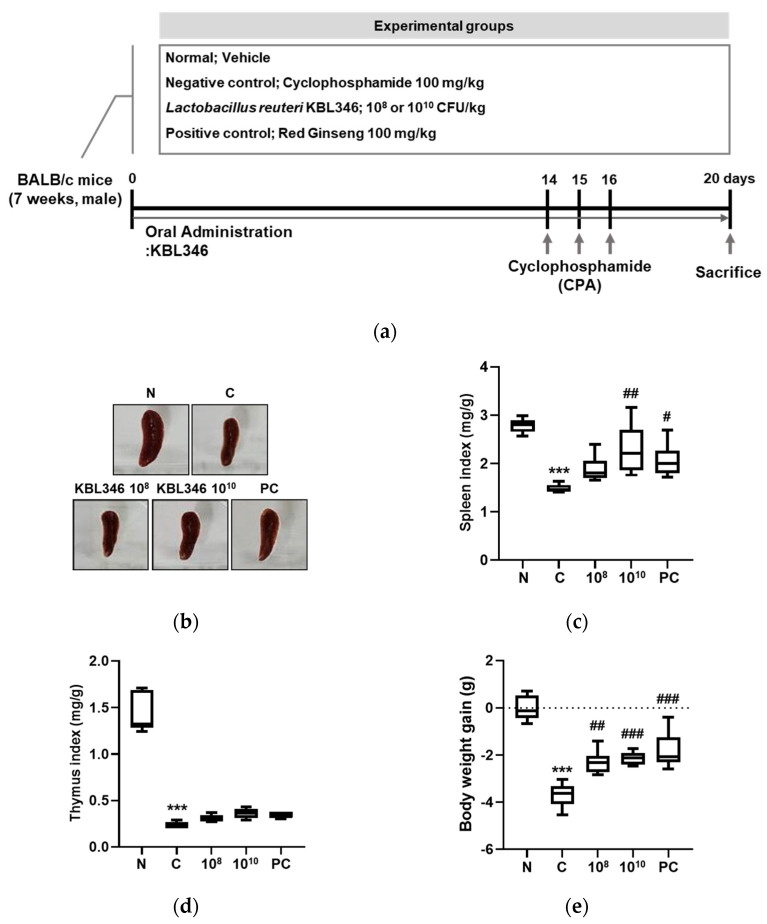
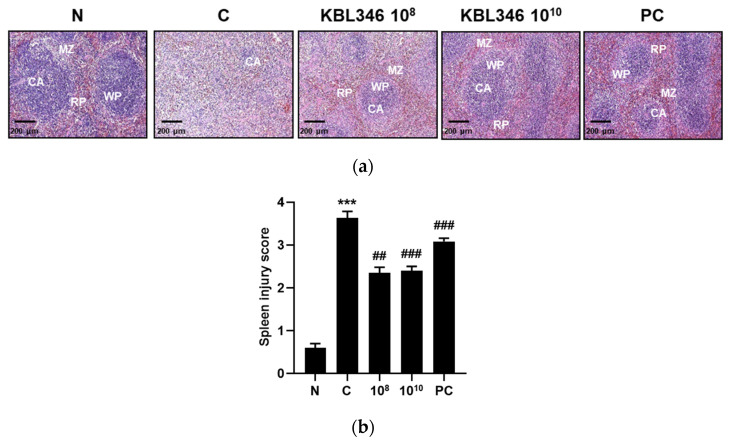
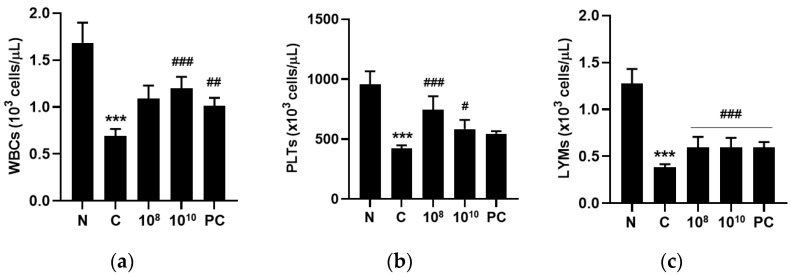
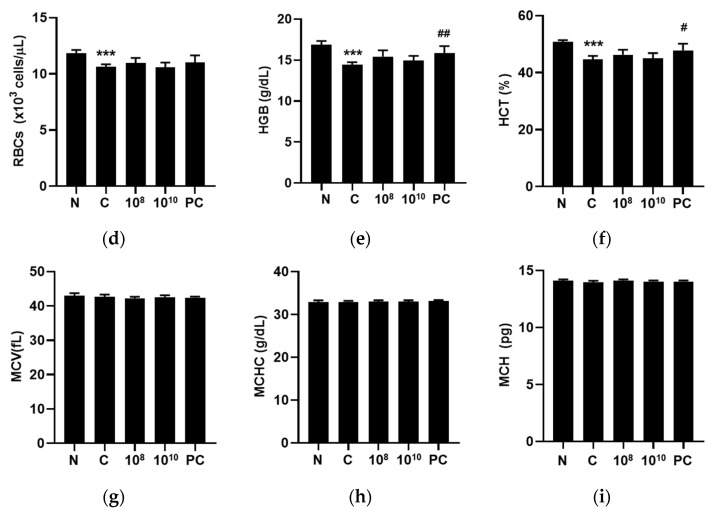
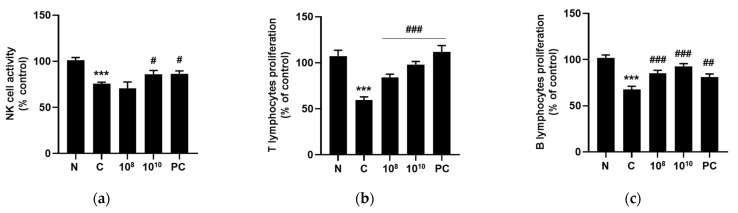
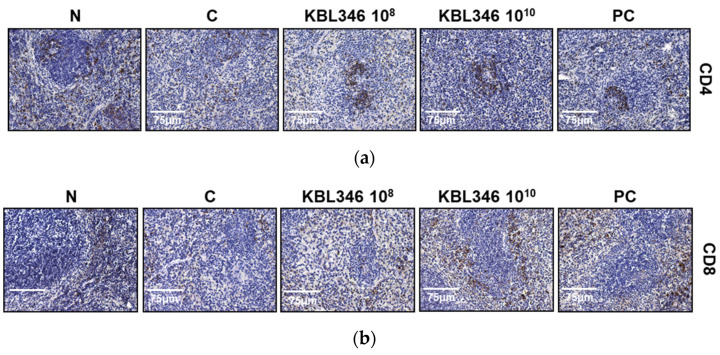
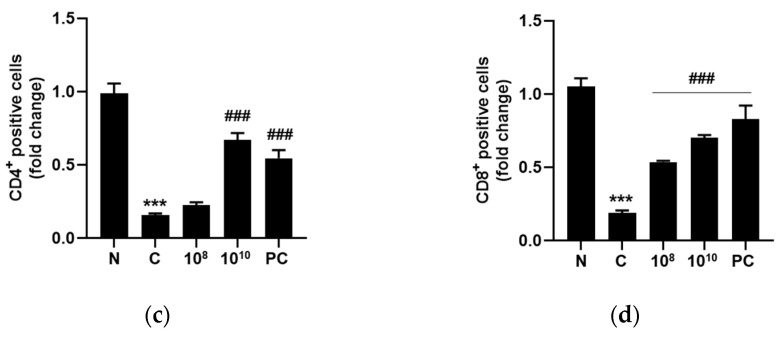
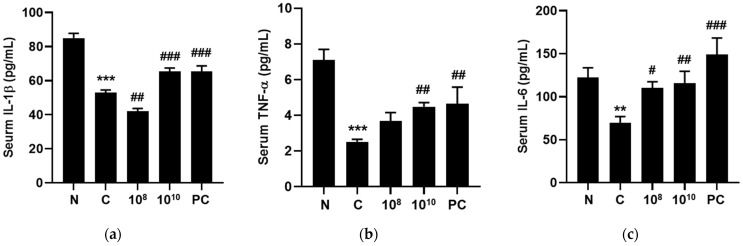
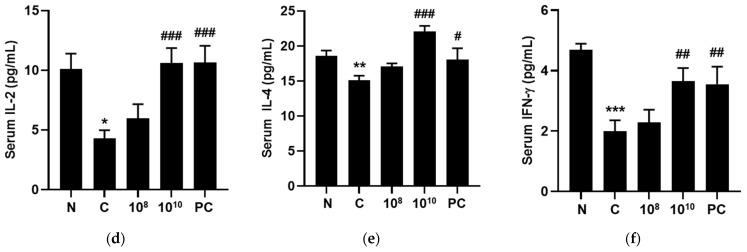
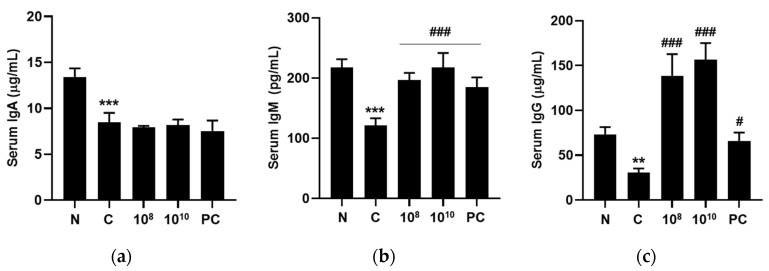
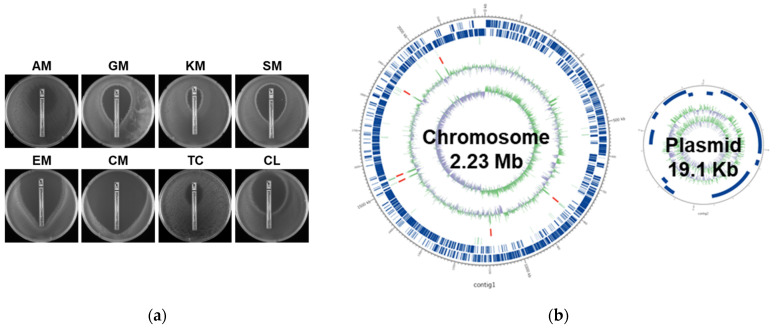
Lactobacilli have been widely used as probiotics because of their benefits for intestinal health and physiological functions. Among a variety of Lactobacillus genera, Limosilactobacillus reuteri has been studied for its ability to exert anti-inflammatory functions and its role in controlling metabolic disorders, as well as the production of the antimicrobial compound reuterin. However, the effects and mechanisms of L. reuteri on enhancing immune responses in the immunosuppressed states have been relatively understudied. In this study, we isolated an immunomodulatory strain, namely, L. reuteri KBL346 (KBL346), from a fecal sample of a 3-month-old infant in Korea. We evaluated the immunostimulatory activity and hematopoietic function of KBL346 in macrophages and cyclophosphamide (CPA)-induced immunosuppressed mice. KBL346 increased the phagocytic activity against Candida albicans MYA-4788 in macrophages, and as biomarkers for this, increased secretions of nitric oxide (NO) and prostaglandin E2 (PGE2) were confirmed. Also, the secretions of innate cytokines (TNF-α, IL-1β, and IL-6) were increased. In CPA-induced immunosuppressed mice, KBL346 at a dosage of 1010 CFU/kg protected against spleen injury and suppressed levels of immune-associated parameters, including NK cell activity, T and B lymphocyte proliferation, CD4+ and CD8+ T cell abundance, cytokines, and immunoglobulins in vivo. The effects were comparable or superior to those in the Korean red ginseng positive control group. Furthermore, the safety assessment of KBL346 as a probiotic was conducted by evaluating its antibiotic resistance, hemolytic activity, cytotoxicity, and metabolic characteristics. This study demonstrated the efficacy and safety of KBL346, which could potentially be used as a supplement to enhance the immune system.

Keywords: Limosilactobacillus reuteri; cyclophosphamide; immunity; macrophage; probiotics; safety.


Conflict of interest statement

The authors declare that this research was conducted in the absence of any commercial or financial relationships that could be construed as a potential conflict of interest. The funders had no role in the design of the study; in the collection, analyses, or interpretation of data; in the writing of the manuscript; or in the decision to publish the results.

Figures

Figure 1
Figure 1
Effects of KBL346 on phagocytic activity in macrophage. After coculture of KBL346 and RAW264.7 cells (ratio, 50:1), Candida albicans MYA-4788 was added to RAW264.7 cells at an MOI of 10. (a) Light micrograph showing RAW264.7 cells (magnification, ×1000) stained with 0.5% methylene blue reagent. Red arrows indicate phagocytic activities of RAW264.7 cells. (b) Phagocytic activity was calculated as the ratio of phagocytic cells to total macrophages in the micrograph. ns, not significant difference compared with the marked sample (p > 0.05); * significant difference compared with the marked samples (*** p < 0.001).
Figure 2
Figure 2
Effects of KBL346 on the production of nitric oxide (NO) and prostaglandin E2 (PGE2) in macrophages. KBL346 and RAW264.7 cells were cocultured at ratios from 3.13:1 to 100:1. As a positive control group, 10 ng/mL of lipopolysaccharide (LPS) was treated, and the negative control group (ctrl) was not treated with either LPS or bacteria. (a,b) The levels of immune mediators (NO, PGE2) in the culture supernatant of RAW264.7 cells were measured. (c) The viability of RAW264.7 cells was assessed using MTT assay. The viability was calculated as a percentage of that in the control group based on the control group using an MTT assay kit. (d) After coculturing KBL346 with RAW264.7 cells at ratios of 10:1 and 100:1, the expressions of inducible nitric oxide synthase (iNOS) and cyclooxygenase-2 (COX-2) were analyzed using Western blotting. As a positive control group, treatment with 10 ng/mL of LPS was used. Data are expressed as the mean ± SD (n = 3). ns, not significant compared with the control group (p > 0.05); * significant difference compared with the control group (*** p < 0.001, **** p < 0.0001).
Figure 3
Figure 3
Effects of KBL346 on production of cytokines by macrophages. KBL346 and RAW264.7 cells were cocultured at ratios from 3.13:1 to 100:1. As a positive control group, treatment with 10 ng/mL of lipopolysaccharide (LPS) was used, and the control group (ctrl) was not treated with either LPS or bacteria. The level of immunomodulatory cytokines ((a) TNF-α; (b) IL-1β; (c) IL6) was measured in the culture supernatant using an ELISA kit. Data are expressed as the mean ± SD (n = 3). nd, not detected; * significant difference compared with control group (*** p < 0.001, **** p < 0.0001).
Figure 4
Figure 4
Effects of KBL346 on immune signaling pathways in macrophage. (a) Schematic representation of cellular signaling pathway of Toll-like receptors (TLRs) in macrophages. (b,c) After coculture of KBL346 and RAW264.7 cells at ratios of 10:1 and 100:1, phosphorylation and expression of mitogen-activated protein kinase (MAPK; blue in (a)) in MAPK signaling pathway or nuclear factor-κB (NF-κB; green in (a)) in the NF-κB signaling pathway were determined using immunochemical method. As a positive control group, treatment with 10 ng/mL concentration of LPS was used. β-actin was used as an internal loading control.
Figure 5
Figure 5
Effect of KBL346 on immune-enhancing activity in CPA-treated BALB/c mice. (a) Experimental design and timeline of in vivo study; (b,c) spleen size and spleen index; (d) thymus index; (e) body weight after 20 days of KBL346 administration. N, naïve mouse; C, CPA (100 mg/kg)-treated mouse; 108, CPA-treated mouse administered with 108 CFU/kg of KBL346; 1010, CPA-treated mouse administered with 1010 CFU/kg of KBL346; PC, positive control group administered with red ginseng (100 mg/kg). * Significant difference compared with the naïve group (*** p < 0.001). # Significant difference compared with the CPA-treated control group (# p < 0.05, ## p < 0.01, ### p < 0.001).
Figure 6
Figure 6
Effect of KBL346 on the restoration of structural disorganization (a) and injury score (b) of spleen in CPA-induced immunosuppressed mice. RP, red pulp; WP, white pulp; MZ, marginal zone; CA, central arteriole. N, naïve mouse; C, CPA (100 mg/kg)-treated mouse; 108, CPA-treated mouse administered with 108 CFU/kg of KBL346; 1010, CPA-treated mouse administered with 1010 CFU/kg of KBL346; PC, positive control group administered with red ginseng (100 mg/kg). * Significant difference compared with the naïve group (*** p < 0.001). # Significant difference compared with the CPA-treated control group (## p < 0.001, ### p < 0.001).
Figure 7
Figure 7
Changes in immunological blood cell profile by KBL346 in CPA-induced immunosuppressed mice. (a) WBCs, white blood cells; (b) PLTs, platelets; (c) LYMs, lymphocyte; (d) RBCs, red blood cell; (e) HGB, hemoglobin; (f) HCT, hematocrit; (g) MCV, mean corpuscle volume; (h) MCHC, mean corpuscle hemoglobin concentration; (i) MCH, mean corpuscle hemoglobin. N, naïve mouse; C, CPA (100 mg/kg)-treated mouse; 108, CPA-treated mouse administered with 108 CFU/kg of KBL346; 1010, CPA-treated mouse administered with 1010 CFU/kg of KBL346; PC, positive control group administered with red ginseng (100 mg/kg). * Significant difference compared with the naïve group (*** p < 0.001). # Significant difference compared with the CPA-treated control group (# p < 0.05, ## p < 0.01, ### p < 0.001).
Figure 7
Figure 7
Changes in immunological blood cell profile by KBL346 in CPA-induced immunosuppressed mice. (a) WBCs, white blood cells; (b) PLTs, platelets; (c) LYMs, lymphocyte; (d) RBCs, red blood cell; (e) HGB, hemoglobin; (f) HCT, hematocrit; (g) MCV, mean corpuscle volume; (h) MCHC, mean corpuscle hemoglobin concentration; (i) MCH, mean corpuscle hemoglobin. N, naïve mouse; C, CPA (100 mg/kg)-treated mouse; 108, CPA-treated mouse administered with 108 CFU/kg of KBL346; 1010, CPA-treated mouse administered with 1010 CFU/kg of KBL346; PC, positive control group administered with red ginseng (100 mg/kg). * Significant difference compared with the naïve group (*** p < 0.001). # Significant difference compared with the CPA-treated control group (# p < 0.05, ## p < 0.01, ### p < 0.001).
Figure 8
Figure 8
Effects of KBL346 on NK cell activity (a) and T cell (b) and B cell (c) proliferation in CPA-induced immunosuppressed mice. N, naïve mouse; C, CPA (100 mg/kg)-treated mouse; 108, CPA-treated mouse administered with 108 CFU/kg of KBL346; 1010, CPA-treated mouse administered with 1010 CFU/kg of KBL346; PC, positive control group administered with red ginseng (100 mg/kg). * Significant difference compared with the naïve group (*** p < 0.001). # Significant difference compared with the CPA-treated control group (# p < 0.05, ## p < 0.01, ### p < 0.001).
Figure 9
Figure 9
Restoration of CD4- and CD8-positive T lymphocytes in the spleen of CPA-induced immunosuppressed mice. (a,b) Representative immunohistochemical staining images and (c,d) fold changes of CD4+ and CD8+ cells in CPA-treated mouse spleen. Scale bar: 75 μm. N, naïve mouse; C, CPA (100 mg/kg)-treated mouse; 108, CPA-treated mouse administered with 108 CFU/kg of KBL346; 1010, CPA-treated mouse administered with 1010 CFU/kg of KBL346; PC, positive control group administered with red ginseng (100 mg/kg). * Significant difference compared with the naïve group (*** p < 0.001). # Significant difference compared with the CPA-treated control group (### p < 0.001).
Figure 9
Figure 9
Restoration of CD4- and CD8-positive T lymphocytes in the spleen of CPA-induced immunosuppressed mice. (a,b) Representative immunohistochemical staining images and (c,d) fold changes of CD4+ and CD8+ cells in CPA-treated mouse spleen. Scale bar: 75 μm. N, naïve mouse; C, CPA (100 mg/kg)-treated mouse; 108, CPA-treated mouse administered with 108 CFU/kg of KBL346; 1010, CPA-treated mouse administered with 1010 CFU/kg of KBL346; PC, positive control group administered with red ginseng (100 mg/kg). * Significant difference compared with the naïve group (*** p < 0.001). # Significant difference compared with the CPA-treated control group (### p < 0.001).
Figure 10
Figure 10
Effect of KBL346 on serum cytokine levels in CPA-induced immunosuppressed mice. (a) IL-1β, (b) TNF-α, (c) IL-6, (d) IL-2, (e) IL-4, and (f) IFN-γ levels in serum. N, naïve mouse; C, CPA (100 mg/kg)-treated mouse; 108, CPA-treated mouse administered with 108 CFU/kg of KBL346; 1010, CPA-treated mouse administered with 1010 CFU/kg of KBL346; PC, positive control group administered with red ginseng (100 mg/kg). * Significant difference compared with the naïve group (* p < 0.05, ** p < 0.01, *** p < 0.001). # Significant difference compared with the CPA-treated control group (# p < 0.05, ## p < 0.01, ### p < 0.001).
Figure 10
Figure 10
Effect of KBL346 on serum cytokine levels in CPA-induced immunosuppressed mice. (a) IL-1β, (b) TNF-α, (c) IL-6, (d) IL-2, (e) IL-4, and (f) IFN-γ levels in serum. N, naïve mouse; C, CPA (100 mg/kg)-treated mouse; 108, CPA-treated mouse administered with 108 CFU/kg of KBL346; 1010, CPA-treated mouse administered with 1010 CFU/kg of KBL346; PC, positive control group administered with red ginseng (100 mg/kg). * Significant difference compared with the naïve group (* p < 0.05, ** p < 0.01, *** p < 0.001). # Significant difference compared with the CPA-treated control group (# p < 0.05, ## p < 0.01, ### p < 0.001).
Figure 11
Figure 11
Effect of KBL346 on serum immunoglobulin levels in CPA-induced immunosuppressed mice. (a) IgA, (b) IgM, and (c) IgG levels in serum. N, naïve mouse; C, CPA (100 mg/kg)-treated mouse; 108, CPA-treated mouse administered with 108 CFU/kg of KBL346; 1010, CPA-treated mouse administered with 1010 CFU/kg of KBL346; PC, positive control group administered with red ginseng (100 mg/kg). * Significant difference compared with the naïve group (** p < 0.01, *** p < 0.001). # Significant difference compared with the CPA-treated control group (# p < 0.05, ### p < 0.001).
Figure 12
Figure 12
Safety assessment of KBL346 as a probiotic strain. (a) Images from antibiotic resistance test using E-strip. AM, ampicillin; GM, gentamicin; KM, kanamycin; SM, streptomycin; EM, erythromycin; CM, clindamycin; TC, tetracyclin; CL, chloramphenicol. (b) Genome Atlas view of the chromosome and plasmid in L. reuteri KBL346. (c) Hemolytic activity analysis of S. aureus ATCC12600 (left) and KBL346 (right) measured in BHI broth containing blood. (d) Cytotoxicity of Caco-2 cells measured using LDH activity assay after the treatment of ATCC12600 and KBL346 (Caco-2 cells:bacteria = 20,000:1). ns, not significant compared with the control group (p > 0.05); * significant difference compared with the control group (** p < 0.01, *** p < 0.001, **** p < 0.0001).
Figure 12
Figure 12
Safety assessment of KBL346 as a probiotic strain. (a) Images from antibiotic resistance test using E-strip. AM, ampicillin; GM, gentamicin; KM, kanamycin; SM, streptomycin; EM, erythromycin; CM, clindamycin; TC, tetracyclin; CL, chloramphenicol. (b) Genome Atlas view of the chromosome and plasmid in L. reuteri KBL346. (c) Hemolytic activity analysis of S. aureus ATCC12600 (left) and KBL346 (right) measured in BHI broth containing blood. (d) Cytotoxicity of Caco-2 cells measured using LDH activity assay after the treatment of ATCC12600 and KBL346 (Caco-2 cells:bacteria = 20,000:1). ns, not significant compared with the control group (p > 0.05); * significant difference compared with the control group (** p < 0.01, *** p < 0.001, **** p < 0.0001).

Similar articles

Cited by

References

    1. Lo B.C., Chen G.Y., Núñez G., Caruso R. Gut microbiota and systemic immunity in health and disease. Int. Immunol. 2021;33:197–209. doi: 10.1093/intimm/dxaa079. - DOI - PMC - PubMed
    1. Sun K., Xie C., Xu D., Yang X., Tang J., Ji X. Lactobacillus isolates from healthy volunteers exert immunomodulatory effects on activated peripheral blood mononuclear cells. J. Biomed. Res. 2013;27:116–126. - PMC - PubMed
    1. Taweechotipatr M., Iyer C., Spinler J.K., Versalovic J., Tumwasorn S. Lactobacillus saerimneri and Lactobacillus ruminis: Novel human-derived probiotic strains with immunomodulatory activities. FEMS Microbiol. Lett. 2009;29:65–72. doi: 10.1111/j.1574-6968.2009.01506.x. - DOI - PMC - PubMed
    1. Zhang N., Li C., Niu Z., Kang H., Wang M., Zhang B., Tian H. Colonization and immunoregulation of Lactobacillus plantarum BF_15, a novel probiotic strain from the feces of breast-fed infants. Food Funct. 2020;11:3156–3166. doi: 10.1039/C9FO02745A. - DOI - PubMed
    1. Han S.K., Shin Y.J., Lee D.Y., Kim K.M., Yang S.J., Kim D.S., Choi J.W., Lee S., Kim D.H. Lactobacillus rhamnosus HDB1258 modulates gut microbiota-mediated immune response in mice with or without lipopolysaccharide-induced systemic inflammation. BMC Microbiol. 2021;21:146. doi: 10.1186/s12866-021-02192-4. - DOI - PMC - PubMed