. 2023 Dec 21;25(1):150.
doi: 10.3390/ijms25010150.

Human Precision-Cut Liver Slices: A Potential Platform to Study Alcohol-Related Liver Disease

Affiliations

Human Precision-Cut Liver Slices: A Potential Platform to Study Alcohol-Related Liver Disease

Una Rastovic et al. Int J Mol Sci. .

Abstract

Alcohol-related liver disease (ALD) encompasses a range of pathological conditions that are complex to study at the clinical and preclinical levels. Despite the global burden of ALD, there is a lack of effective treatments, and mortality is high. One of the reasons for the unsuccessful development of novel therapies is that experimental studies are hindered by the challenge of recapitulating this multifactorial disorder in vitro, including the contributions of hepatotoxicity, impaired lipid metabolism, fibrosis and inflammatory cytokine storm, which are critical drivers in the pathogenesis of ALD in patients and primary targets for drug development. Here, we present the unique characteristics of the culture of human precision-cut liver slices (PCLS) to replicate key disease processes in ALD. PCLS were prepared from human liver specimens and treated with ethanol alone or in combination with fatty acids and lipopolysaccharide (FA + LPS) for up to 5 days to induce hepatotoxic, inflammatory and fibrotic events associated with ALD. Alcohol insult induced hepatocyte death which was more pronounced with the addition of FA + LPS. This mixture showed a significant increase in the cytokines conventionally associated with the prototypical inflammatory response observed in severe ALD, and interestingly, alcohol alone exhibited a different effect. Profibrogenic activation was also observed in the slices and investigated in the context of slice preparation. These results support the versatility of this organotypic model to study different pathways involved in alcohol-induced liver damage and ALD progression and highlight the applicability of the PCLS for drug discovery, confirming their relevance as a bridge between preclinical and clinical studies.

Keywords: alcoholic hepatitis; ethanol hepatotoxicity; ex vivo models; fibrosis; organotypic culture.


Conflict of interest statement

The authors declare no conflicts of interest. The funders had no role in the design of the study; in the collection, analyses or interpretation of data; in the writing of the manuscript; or in the decision to publish the results.

Figures

Figure 1
Figure 1
Human precision-cut liver slices (PCLS) preparation and culture. PCLS are prepared from tumour distal portion of resected liver tissue (referred to as baseline). Tissue cores are prepared with the coring press (5 mm in diameter, 1 cm long), and are sliced with the Krumdieck (Alabama R&D) tissue slicer to produce 5 mg PCLS (approx. 250 µm thick). After PCLS preparation, slices are cultured for 2 h during the recovery step. Slices are cultured in a shaker incubator, in carbogen chambers (95% O2, 5% CO2) containing a Petri dish with distilled water to prevent evaporation, incubated at 37 °C, and shaking at 70 rpm. After recovery, they are cultured overnight, and the treatment with alcohol insults starts the following morning (Day 0). Culture plates with slices treated with alcohol insults are kept separately in an EtOH chamber which in addition to distilled water contains a Petri dish with 500 mM ethanol to prevent ethanol evaporation from the medium. Figure created with BioRender.com.
Figure 2
Figure 2
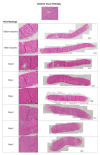
Representative H&E staining of human precision-cut liver slices (PCLS) over time compared to the baseline tissue used to obtain PCLS. Histology images show preserved liver histoarchitecture in PCLS and viable hepatocytes over time in culture. Middle panel: selected areas of the slice (scale bar: 50 µm), right panel: manually stitched image acquisition of the whole slice using Multiple Image Alignment (MIA) option in Olympus cellSens Standard 2.3 software (scale bar: 200 µm). Magnification: 400×. Blue arrows indicate the integrity of the tissue edge/cut surface over time; blue stars indicate cell damage, i.e., areas of necrosis, at or parallel to the cut surface of the slice. The pattern of cell damage did not follow lobular organisation.
Figure 3
Figure 3
Longitudinal assessment of human precision-cut liver slices (PCLS) culture viability. (A) Hepatocyte death rate measured as a % of maximal M65 release per mg of tissue per hour in culture supernatants. Measurement of M65 in culture supernatants was only possible from the after-recovery timepoint onwards as this is the first timepoint when the slices are cultured. M65 release was measured after 2 h incubation at the after-recovery timepoint, after 15 h incubation at Day 0 and after 24 h incubation at timepoints Day 1–Day 5. Mean ± 95% CI. n (patients) = 7; minimum 3 samples per patient. (B) PCLS viability measured as ATP content in the tissue. Mean ± 95%CI. The full red line indicates the viability threshold (2 nmol/mg ATP/protein). n (patients) = 5, minimum 3 samples per patient. (C) PCLS weight over time. Mean ± 95% CI. n (patients) = 7, minimum 3 samples per patient. * p ≤ 0.05.
Figure 4
Figure 4
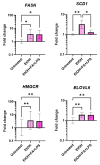
Expression of genes involved in lipid synthesis and remodelling in human precision-cut liver slices (PCLS) exposed to alcohol insults. Change in gene expression in the PCLS induced by the insults quantified in PCLS cultured for 3 days, normalised per no-insult control. Geomean ± SD. * p ≤ 0.05, ** p ≤ 0.01; n (patients) = 3, 1 sample per patient.
Figure 5
Figure 5
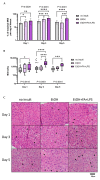
Hepatotoxic effect of alcohol insults on human precision-cut liver slices (PCLS). (A) Total hepatocyte death measured as a release of M65 epitope of cytokeratin-18 in culture supernatants expressed as a percentage of maximal M65 release per mg of tissue. Geomean ± 95% CI. * p ≤ 0.05, ** p ≤ 0.01, *** p ≤ 0.001, **** p ≤ 0.0001; n (patients) = 3–7 per timepoint, minimum 3 samples per patient. (B) Apoptosis observed in PCLS measured as a release of M30 epitope of caspase-cleaved cytokeratin-18 in culture supernatants. Tukey box plot. * p ≤ 0.05, ** p ≤ 0.01, *** p ≤ 0.001, **** p ≤ 0.0001; n (patients) = 3–7 per timepoint, minimum 3 samples. (C) Representative H&E staining of PCLS treated with alcohol insults over time. Black arrows: hepatocyte damage (swelling of cells, pale cytoplasm, loss of nuclei). Scale bar: 50 µm, magnification: 400×.
Figure 6
Figure 6
Release of proinflammatory cytokines in human precision-cut liver slices culture supernatants following alcohol treatment. Tukey box plot. * p ≤ 0.05, ** p ≤ 0.01, *** p ≤ 0.001, **** p ≤ 0.0001; n (patients) = 3–6 per timepoint, 1–3 samples per patient.
Figure 7
Figure 7
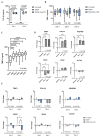
Profibrotic changes in human precision-cut liver slices (PCLS). (A) Release of the active form of TGF-β1 in culture supernatants. Tukey box plot. **** p ≤ 0.0001; n (patients) = 2–3 per timepoint, 2 samples per patient. (B) TIMP-1 release in culture supernatant in the presence of insults. Tukey box plot. n (patients) = 3–7 per timepoint, minimum 3 samples per patient. (C) TIMP-1 release in culture supernatant over time. Tukey box plot. **** p ≤ 0.0001; n (patients) = 3–7 per timepoint, minimum 3 samples per patient. (D) Change in gene expression induced by the cut during PCLS preparation quantified in PCLS cultured for 3 and 5 days, normalised per baseline uncut tissue that was used to obtain PCLS (Figure 1). Geomean ± SD. * p ≤ 0.05, ** p ≤ 0.01, *** p ≤ 0.001; n (patients) = 5, 1 sample per patient. (E) Change in gene expression in the PCLS induced by the insults quantified in PCLS cultured for 3 and 5 days, normalised per no-insult control for each timepoint. Geomean ± SD. * p ≤ 0.05; n (patients) = 5, 1 sample per patient.

References

    1. Global Status Report on Alcohol and Health 2018. [(accessed on 13 December 2022)]. Available online: https://www.who.int/publications/i/item/9789241565639.
    1. Mandrekar P., Bataller R., Tsukamoto H., Gao B. Alcoholic Hepatitis: Translational Approaches to Develop Targeted Therapies. Hepatology. 2016;64:1343–1355. doi: 10.1002/hep.28530. - DOI - PMC - PubMed
    1. Ndugga N., Lightbourne T.G., Javaherian K., Cabezas J., Verma N., Barritt A.S., Bataller R. Disparities between Research Attention and Burden in Liver Diseases: Implications on Uneven Advances in Pharmacological Therapies in Europe and the USA. BMJ Open. 2017;7:e013620. doi: 10.1136/bmjopen-2016-013620. - DOI - PMC - PubMed
    1. Seitz H.K., Bataller R., Cortez-Pinto H., Gao B., Gual A., Lackner C., Mathurin P., Mueller S., Szabo G., Tsukamoto H. Alcoholic Liver Disease. Nat. Rev. Dis. Primers. 2018;4:16. doi: 10.1038/s41572-018-0014-7. - DOI - PubMed
    1. Lackner C., Stauber R.E., Davies S., Denk H., Dienes H.P., Gnemmi V., Guido M., Miquel R., Paradis V., Schirmacher P., et al. Development and Prognostic Relevance of a Histologic Grading and Staging System for Alcohol-Related Liver Disease. J. Hepatol. 2021;75:810–819. doi: 10.1016/j.jhep.2021.05.029. - DOI - PubMed

LinkOut - more resources