Metabolomic Insight into Implications of Induction Chemotherapy Followed by Concomitant Chemoradiotherapy in Locally Advanced Head and Neck Cancer
- PMID: 38203359
- PMCID: PMC10779362
- DOI: 10.3390/ijms25010188
Metabolomic Insight into Implications of Induction Chemotherapy Followed by Concomitant Chemoradiotherapy in Locally Advanced Head and Neck Cancer
Abstract
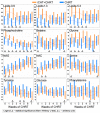
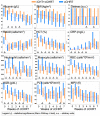
The present study compares two groups of locally advanced patients with head and neck squamous cell carcinoma (LA-HNSCC) undergoing concurrent chemoradiotherapy (cCHRT), specifically those for whom it is a first-line treatment and those who have previously received induction chemotherapy (iCHT). The crucial question is whether iCHT is a serious burden during subsequent treatment for LA-HNSCC and how iCHT affects the tolerance to cCHRT. Of the 107 LA-HNSCC patients, 54 received cisplatin-based iCHT prior to cCHRT. The patients were clinically monitored at weekly intervals from the day before until the completion of the cCHRT. The 843 blood samples were collected and divided into two aliquots: for laboratory blood tests and for nuclear magnetic resonance (NMR) spectroscopy (a Bruker 400 MHz spectrometer). The NMR metabolites and the clinical parameters from the laboratory blood tests were analyzed using orthogonal partial least squares analysis (OPLS) and the Mann-Whitney U test (MWU). After iCHT, the patients begin cCHRT with significantly (MWU p-value < 0.05) elevated blood serum lipids, betaine, glycine, phosphocholine, and reticulocyte count, as well as significantly lowered NMR inflammatory markers, serine, hematocrit, neutrophile, monocyte, red blood cells, hemoglobin, and CRP. During cCHRT, a significant increase in albumin and psychological distress was observed, as well as a significant decrease in platelet, N-acetyl-cysteine, tyrosine, and phenylalanine, in patients who received iCHT. Importantly, all clinical symptoms (except the decreased platelets) and most metabolic alterations (except for betaine, serine, tyrosine, glucose, and phosphocholine) resolve until the completion of cCHRT. In conclusion, iCHT results in hematological toxicity, altered lipids, and one-carbon metabolism, as well as downregulated inflammation, as observed at the beginning and during cCHRT. However, these complications are temporary, and most of them resolve at the end of the treatment. This suggests that iCHT prior to cCHRT does not pose a significant burden and should be considered as a safe treatment option for LA-HNSCC.
Keywords: LA-HNSCC; NMR spectroscopy; chemoradiotherapy; head and neck cancer; induction chemotherapy; metabolomics; treatment toxicity.
Conflict of interest statement
The authors declare no conflicts of interest.
Figures


Similar articles
-
Molecular response to induction chemotherapy and its correlation with treatment outcome in head and neck cancer patients by means of NMR-based metabolomics.BMC Cancer. 2021 Apr 15;21(1):410. doi: 10.1186/s12885-021-08137-4. BMC Cancer. 2021. PMID: 33858370 Free PMC article.
-
NMR-Based Metabolomics of Blood Serum in Predicting Response to Induction Chemotherapy in Head and Neck Cancer-A Preliminary Approach.Int J Mol Sci. 2024 Jul 10;25(14):7555. doi: 10.3390/ijms25147555. Int J Mol Sci. 2024. PMID: 39062797 Free PMC article.
-
Metabolite Biomarkers of Prolonged and Intensified Pain and Distress in Head and Neck Cancer Patients Undergoing Radio- or Chemoradiotherapy by Means of NMR-Based Metabolomics-A Preliminary Study.Metabolites. 2024 Jan 17;14(1):60. doi: 10.3390/metabo14010060. Metabolites. 2024. PMID: 38248863 Free PMC article.
-
The Effect of Induction Chemotherapy Using Docetaxel, Cisplatin, and Fluorouracil on Survival in Locally Advanced Head and Neck Squamous Cell Carcinoma: A Meta-Analysis.Cancer Res Treat. 2016 Jul;48(3):907-16. doi: 10.4143/crt.2015.359. Epub 2015 Nov 17. Cancer Res Treat. 2016. PMID: 26582394 Free PMC article. Review.
-
Chemotherapy in locally advanced head and neck squamous cell carcinoma.Cancer Treat Rev. 2016 Mar;44:10-6. doi: 10.1016/j.ctrv.2016.01.002. Epub 2016 Jan 22. Cancer Treat Rev. 2016. PMID: 26924194 Review.
References
-
- Haddad R.I., Posner M., Hitt R., Cohen E.E.W., Schulten J., Lefebvre J.L., Vermorken J.B. Induction chemotherapy in locally advanced squamous cell carcinoma of the head and neck: Role, controversy, and future directions. Ann. Oncol. 2018;29:1130–1140. doi: 10.1093/annonc/mdy102. - DOI - PMC - PubMed
-
- Vermorken J.B. Where and when to Use Induction Chemotherapy in Head and Neck Squamous Cell Cancer. In: Vermorken J.B., Budach V., Leemans C.R., Machiels J.P., Nicolai P., O’Sullivan B., editors. Critical Issues in Head and Neck Oncology. Springer; Cham, Switzerland: 2021. pp. 155–180.
MeSH terms
Substances
LinkOut - more resources
Full Text Sources
Medical
Research Materials
Miscellaneous

