. 2023 Dec 22;25(1):226.
doi: 10.3390/ijms25010226.

Mitochondrial Reactive Oxygen Species in TRIF-Dependent Toll-like Receptor 3 Signaling in Bronchial Epithelial Cells against Viral Infection

Affiliations

Mitochondrial Reactive Oxygen Species in TRIF-Dependent Toll-like Receptor 3 Signaling in Bronchial Epithelial Cells against Viral Infection

Ga Eul Chu et al. Int J Mol Sci. .

Abstract

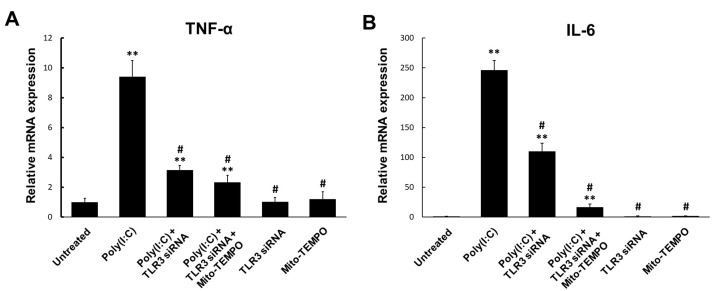
Toll-like receptor 3 (TLR3) plays an important role in double-stranded RNA recognition and triggers the innate immune response by acting as a key receptor against viral infections. Intracellular reactive oxygen species (ROS) are involved in TLR3-induced inflammatory responses during viral infections; however, their relationship with mitochondrial ROS (mtROS) remains largely unknown. In this study, we show that polyinosinic-polycytidylic acid (poly(I:C)), a mimic of viral RNA, induced TLR3-mediated nuclear factor-kappa B (NF-κB) signaling pathway activation and enhanced mtROS generation, leading to inflammatory cytokine production. TLR3-targeted small interfering RNA (siRNA) and Mito-TEMPO inhibited inflammatory cytokine production in poly(I:C)-treated BEAS-2B cells. Poly(I:C) recruited the TLR3 adaptor molecule Toll/IL-1R domain-containing adaptor, inducing IFN (TRIF) and activated NF-κB signaling. Additionally, TLR3-induced mtROS generation suppression and siRNA-mediated TRIF downregulation attenuated mitochondrial antiviral signaling protein (MAVS) degradation. Our findings provide insights into the TLR3-TRIF signaling pathway and MAVS in viral infections, and suggest TLR3-mtROS as a therapeutic target for the treatment of airway inflammatory and viral infectious diseases.

Keywords: TLR3 signaling; bronchial epithelial cells; mitochondria; reactive oxygen species; viral infection.


Conflict of interest statement

The authors declare no conflict of interest.

Figures

Figure 1
Figure 1
Poly(I:C) induces TLR3 and NF-κB signaling pathway activation. (A) BEAS-2B cells were stimulated with 10 μg/mL of poly(I:C) to assess TLR3 phosphorylation. (B) Relative protein expressions of phosphorylated TLR3 (p-TLR3), TLR3 and p-TLR3/TLR3 were measured at specific time points and normalized to GAPDH. Data represent the mean ± standard deviation (SD) from three independent experiments, with results normalized to untreated control cells. Statistical significance was assessed using Student’s t-test, ** p < 0.01 vs. untreated control cells. (C) Representative Western blot depicting the protein levels of phosphorylated IκB-α (p-IκB-α) and IκB-α in poly(I:C)-treated BEAS-2B cells over time. (D) Quantitative analysis of p-IκB-α, IκB-α and p-IκB-α/IκB-α expression levels normalized to GAPDH. Data are the mean ± SD of three independent experiments, and the results normalized to untreated control cells. Statistical analysis was performed via Student’s t-test, * p < 0.05, ** p < 0.01 vs. untreated control cells.
Figure 2
Figure 2
Poly(I:C)-induced mtROS generation. (A) BEAS-2B cells were stimulated with poly(I:C) in a time- and dose-dependent manner. mtROS levels were determined via flow cytometry after staining with 5 μM of MitoSOX. Control: non-treated; poly(I:C) 0 μg/mL: treated with only MitoSOX 5 μM. The mtROS levels were assessed via MitoSOX fluorescence at (B) 1 h and (C) 24 h using confocal microscopy (×400 magnification). BEAS-2B cells were stimulated with poly(I:C) in a dose-dependent manner at different time points, and the mtROS levels were obtained by staining with 5 μM of MitoSOX. (D,E) Quantitative fluorescence intensity was analyzed using ImageJ software (version 1.53e). Scale bar, 50 μm. Data are the mean ± standard deviation (SD) of three independent experiments, and the results normalized to untreated control cells. Statistical analysis was performed via Student’s t-test, ** p < 0.01 vs. untreated control cells.
Figure 3
Figure 3
mtROS scavenger Mito-TEMPO attenuates inflammatory cytokine production. (A) BEAS-2B cells were pretreated with or without Mito-TEMPO for 1 h, followed by stimulation with 10 μg/mL of poly(I:C). mtROS levels were evaluated using MitoSOX (5 μM) staining, visualized by confocal microscopy at 400× magnification. (B) Quantification of MitoSOX fluorescence in BEAS-2B cells across different groups. Fluorescence intensity was quantified using ImageJ software (version 1.53e). Data represent the mean ± standard deviation (SD) from three independent experiments, normalized to untreated control cells. Statistical significance was assessed with Student’s t-test, * p < 0.05, ** p < 0.01 vs. untreated control cells; # p < 0.01 vs. poly(I:C)-treated cells. (C) Representative Western blot illustrating TNF-α protein levels in poly(I:C)-treated BEAS-2B cells, with or without Mito-TEMPO pretreatment. (D) Quantitative analysis of TNF-α expression levels normalized to GAPDH. Data represent the mean ± SD from three independent experiments, normalized to untreated control cells. Statistical analysis was performed using Student’s t-test, ** p < 0.01 vs. untreated control cells.
Figure 4
Figure 4
TLR3 silencing reduces inflammatory cytokine induction. BEAS-2B cells were transfected with TLR3 siRNA and treated with 10 μg/mL of poly(I:C) for 6 h with or without Mito-TEMPO pre-treatment. Total BEAS-2B cell RNA was isolated to assess the (A) TNF-α and (B) IL-6 gene expression using real-time qPCR. Data are the mean ± standard deviation (SD) of three independent experiments, and the results are normalized to untreated control cells. Statistical analysis was performed using Student’s t-test, ** p < 0.01 vs. untreated control cells; # p < 0.01 vs. poly(I:C)-treated cells.
Figure 5
Figure 5
NF-κB pathway activated by TRIF-mediated TLR3 signaling. (A) BEAS-2B cells were stimulated with 10 μg/mL poly(I:C) to evaluate TRIF expression and NF-κB p65 phosphorylation. (B) Relative TRIF, phosphorylated NF-κB p65 (p-NF-κB p65), NF-κB p65 and p-NF-κB p65/NF-κB p65 protein expressions were assessed according to the indicated time point, and were normalized to the GAPDH reference protein. Data are the mean ± standard deviation (SD) of three independent experiments, and the results normalized to untreated control cells. Statistical analysis was performed using Student’s t-test, * p < 0.05, ** p < 0.01 vs. untreated control cells. (C) BEAS-2B cells were pre-treated with 1 μg/mL of TLR3 siRNA and stimulated with 10 μg/mL of poly(I:C) for 6 h. TLR3 and TRIF protein levels detected via Western blot. (D) NF-κB signaling molecule expression was evaluated in 1 μg/mL TRIF siRNA-transfected BEAS-2B cells using Western blot analysis. The cells were stimulated with 10 μg/mL of poly(I:C) for 6 h with or without TRIF gene silencing. (E) Relative TRIF, phosphorylated IκB-α (p-IκB-α), IκB-α and p-IκB-α/IκB-α protein expressions were assessed and normalized to GAPDH. Data are the mean ± SD of three independent experiments, and the results normalized to untreated control cells. Statistical analysis was performed using Student’s t-test, * p < 0.05, ** p < 0.01 vs. untreated control cells; # p < 0.01 vs. poly(I:C)-treated cells.
Figure 6
Figure 6
MAVS degradation is inhibited by Mito-TEMPO and TRIF siRNA. (A) BEAS-2B cells were stimulated with 10 μg/mL of poly(I:C) and the expression of MAVS signaling pathway analyzed using Western blot. (B) Relative MAVS, phosphorylated TBK-1 (p-TBK-1)/TBK-1 and p-IRF-3/IRF-3 protein expressions were assessed according to the indicated time point and normalized to the GAPDH reference protein. Data are the mean ± standard deviation (SD) of three independent experiments, and the results normalized to untreated control cells. Statistical analysis was performed using Student’s t-test, ** p < 0.01 vs. untreated control cells. (C) BEAS-2B cells were pre-treated with 100 μM Mito-TEMPO for 1 h and stimulated with 10 μg/mL of poly(I:C) for 6 h. Expressed MAVS protein levels were detected via Western blot. (D) Relative MAVS protein expressions were assessed according to the indicated time point and normalized to the GAPDH reference protein. Data are the mean ± SD of three independent experiments, and the results normalized to untreated control cells. Statistical analysis was performed using Student’s t-test, ** p < 0.01 vs. untreated control cells; # p < 0.01 vs. poly(I:C)-treated cells. (E) The expression of MAVS and its downstream molecules were evaluated in TRIF siRNA transfected BEAS-2B cells using Western blot analysis. The poly(I:C)-stimulated cells (6 h) with or without TRIF gene silencing. (F) Relative TRIF, MAVS, p-TBK-1/TBK-1 and p-IRF-3/IRF-3 protein expressions were assessed and normalized to GAPDH. Data are the mean ± SD of three independent experiments, and the results normalized to untreated control cells. Statistical analysis was performed using Student’s t-test, ** p < 0.01 vs. untreated control cells; # p < 0.01 vs. poly(I:C)-treated cells.
Figure 7
Figure 7
TLR3-dependent NF-κB signaling mechanism associated with MAVS.

Similar articles

Cited by

References

    1. Takeuchi O., Akira S. Pattern recognition receptors and inflammation. Cell. 2010;140:805–820. doi: 10.1016/j.cell.2010.01.022. - DOI - PubMed
    1. Albiger B., Dahlberg S., Henriques-Normark B., Normark S. Role of the innate immune system in host defence against bacterial infections: Focus on the Toll-like receptors. J. Intern. Med. 2007;261:511–528. doi: 10.1111/j.1365-2796.2007.01821.x. - DOI - PubMed
    1. Pandey S., Kawai T., Akira S. Microbial sensing by Toll-like receptors and intracellular nucleic acid sensors. Cold Spring Harb. Perspect. Biol. 2014;7:a016246. doi: 10.1101/cshperspect.a016246. - DOI - PMC - PubMed
    1. Kawasaki T., Kawai T. Toll-like receptor signaling pathways. Front. Immunol. 2014;5:461. doi: 10.3389/fimmu.2014.00461. - DOI - PMC - PubMed
    1. Kawai T., Akira S. Regulation of innate immune signalling pathways by the tripartite motif (TRIM) family proteins. EMBO Mol. Med. 2011;3:513–527. doi: 10.1002/emmm.201100160. - DOI - PMC - PubMed