. 2023 Dec 23;25(1):245.
doi: 10.3390/ijms25010245.

Developmental and Nutritional Dynamics of Malpighian Tubule Autofluorescence in the Asian Tiger Mosquito Aedes albopictus

Affiliations

Developmental and Nutritional Dynamics of Malpighian Tubule Autofluorescence in the Asian Tiger Mosquito Aedes albopictus

Anna Cleta Croce et al. Int J Mol Sci. .

Abstract

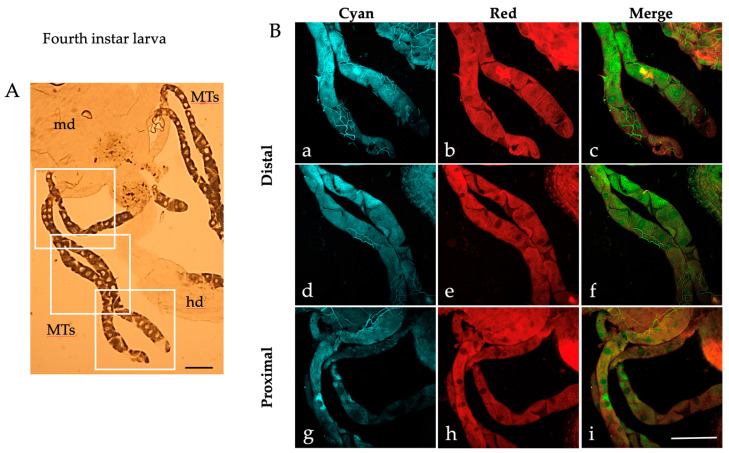
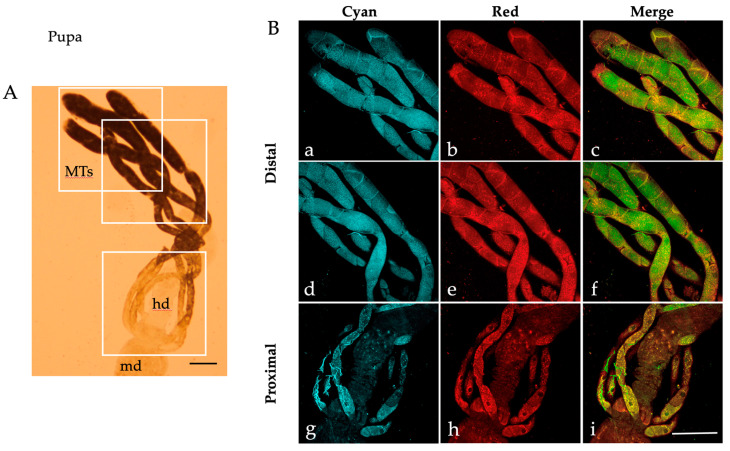
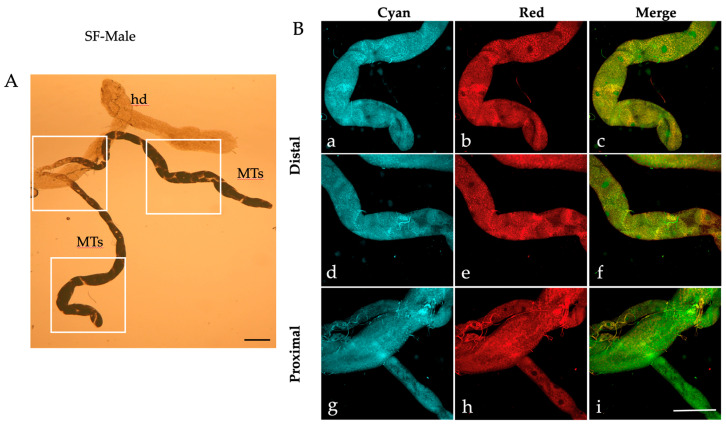
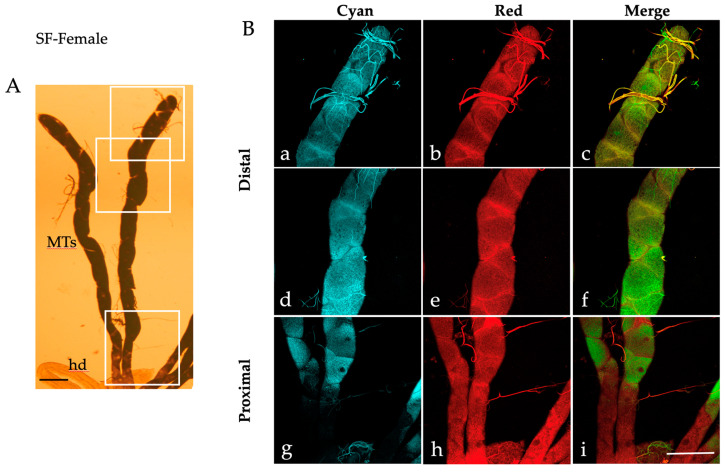
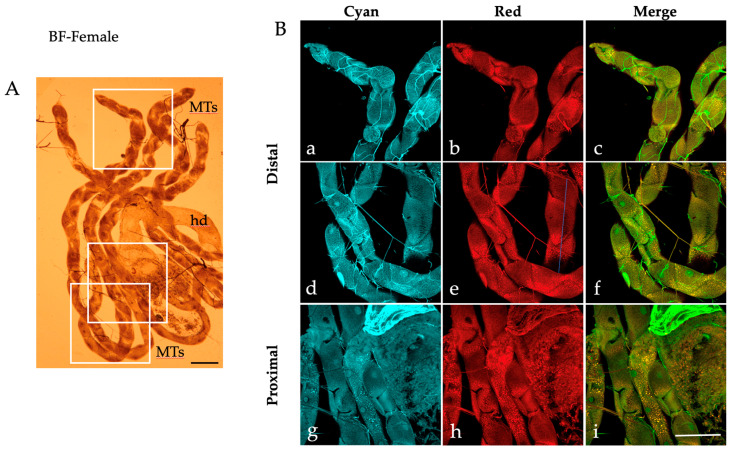
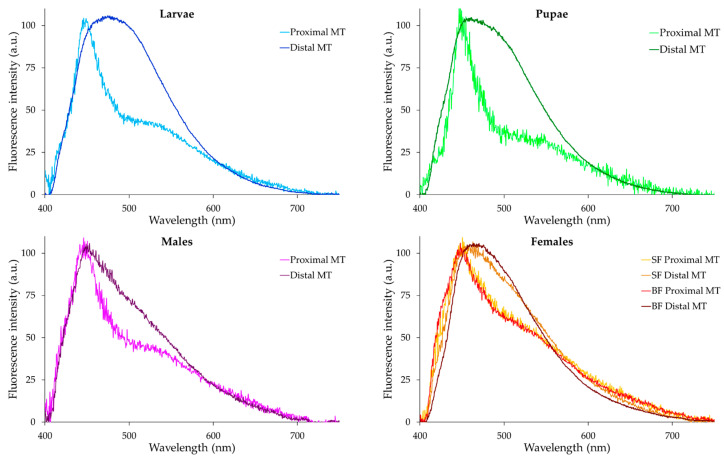
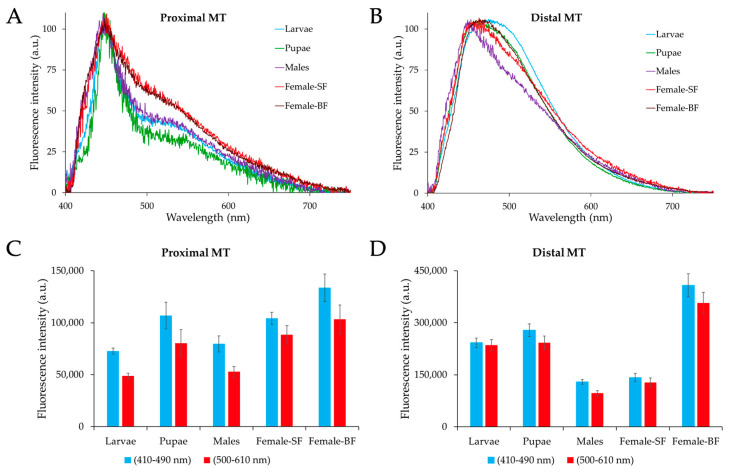
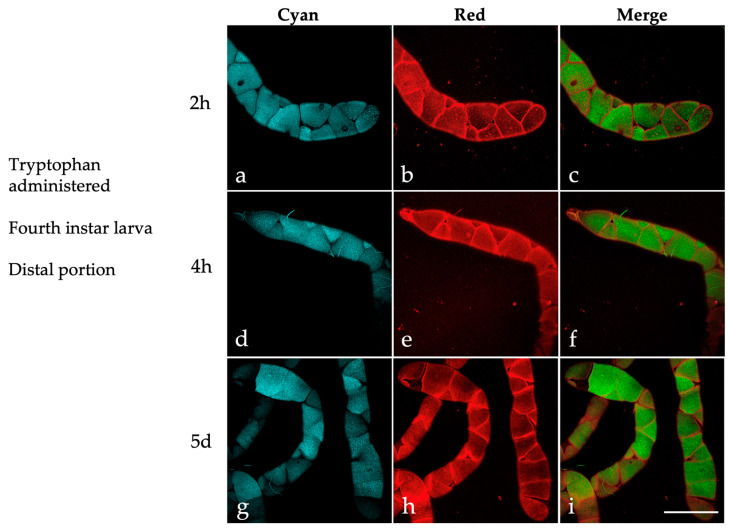
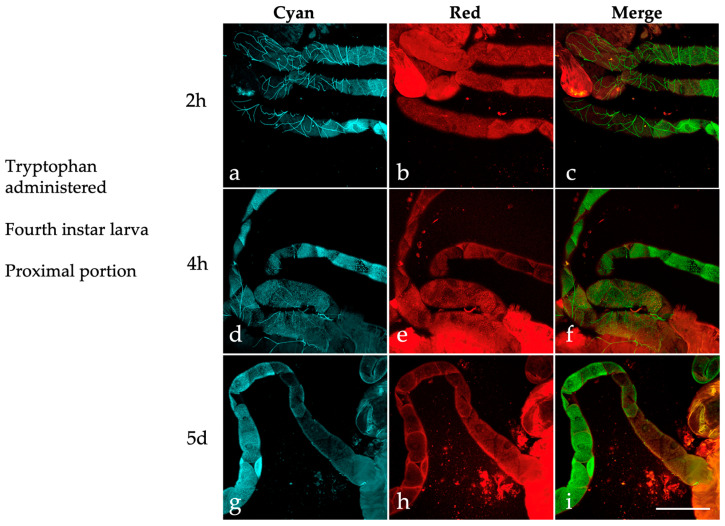
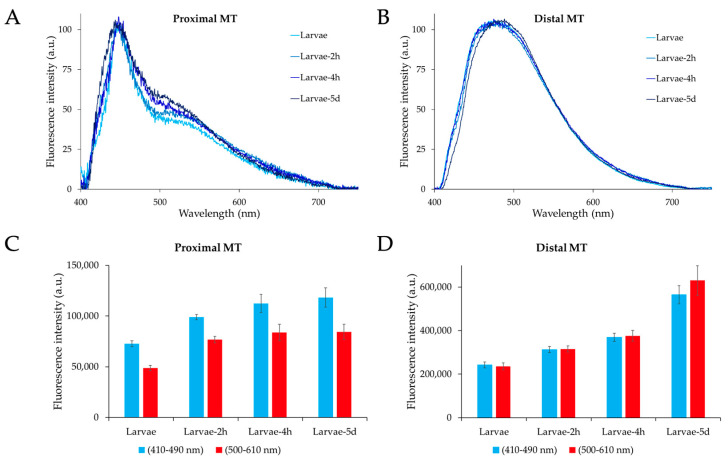
Malpighian tubules (MTs) are arthropod excretory organs crucial for the osmoregulation, detoxification and excretion of xenobiotics and metabolic wastes, which include tryptophan degradation products along the kynurenine (KYN) pathway. Specifically, the toxic intermediate 3-hydroxy kynurenine (3-HK) is metabolized through transamination to xanthurenic acid or in the synthesis of ommochrome pigments. Early investigations in Drosophila larval fat bodies revealed an intracellular autofluorescence (AF) that depended on tryptophan administration. Subsequent observations documented AF changes in the MTs of Drosophila eye-color mutants genetically affecting the conversion of tryptophan to KYN or 3-HK and the intracellular availability of zinc ions. In the present study, the AF properties of the MTs in the Asian tiger mosquito, Aedes albopictus, were characterized in different stages of the insect's life cycle, tryptophan-administered larvae and blood-fed adult females. Confocal imaging and microspectroscopy showed AF changes in the distribution of intracellular, brilliant granules and in the emission spectral shape and amplitude between the proximal and distal segments of MTs across the different samples. The findings suggest AF can serve as a promising marker for investigating the functional status of MTs in response to metabolic alterations, contributing to the use of MTs as a potential research model in biomedicine.

Keywords: confocal microscopy; dietary intake; emission spectra; fluorescent granules; mosquito developmental stages; principal cells; spectrofluorimetric analysis; tryptophan.


Conflict of interest statement

The authors declare no conflicts of interest. The funders had no role in the design of the study, in the collection, analyses or interpretation of the data, in the writing of the manuscript or in the decision to publish the results.

Figures

Figure 1
Figure 1
Malpighian tubules isolated from an Ae. albopictus fourth instar larva. (A) Bright field image of MTs. Frames indicate the MT areas from which AF confocal images have been collected. (B) AF confocal images of MTs recorded under the “Cyan” (a,d,g) and “Red” (b,e,h) conditions and respective merged images (c,f,i) from the distal (blind end, (ac), middle, (df)) and proximal (gi) portions. md, midgut; hd, hindgut; MTs, Malpighian tubules. Scale bar = 200 μm.
Figure 2
Figure 2
Malpighian tubules isolated from an Ae. albopictus pupa. (A) Bright field image of MTs. Frames indicate the MT areas from which AF confocal images have been collected. (B) AF confocal images of MTs recorded under the “Cyan” (a,d,g) and “Red” (b,e,h) conditions and respective merged images (c,f,i) from the distal (blind end, (ac), middle, (df)) and proximal (gi) portions. md, midgut; hd, hindgut; MTs, Malpighian tubules. Scale bar = 200 μm.
Figure 3
Figure 3
Malpighian tubules isolated from an Ae. albopictus adult male. (A) Bright field image of MTs. Frames indicate the MT areas from which AF confocal images have been collected. (B) AF confocal images of MTs recorded under the “Cyan” (a,d,g) and “Red” (b,e,h) conditions and respective merged images (c,f,i) from the distal (blind end, (ac), middle, (df)) and proximal (gi) portions. hd, hindgut; MTs, Malpighian tubules. Scale bar = 200 μm.
Figure 4
Figure 4
Malpighian tubules isolated from an Ae. albopictus sugar-fed female. (A) Bright field image of MTs. Frames indicate the MT areas from which AF confocal images have been collected. (B) AF confocal images of MTs recorded under the “Cyan” (a,d,g) and “Red” (b,e,h) conditions and respective merged images (c,f,i) from the distal (blind end, (ac), middle, (df)) and proximal (gi) portions. hd, hindgut; MTs, Malpighian tubules. Scale bar = 200 μm.
Figure 5
Figure 5
Malpighian tubules isolated from an Ae. albopictus blood-fed female. (A) Bright field image of MTs. Frames indicate the MT areas from which AF confocal images have been collected. (B) AF confocal images of MTs recorded under “Cyan” (a,d,g) and “Red” (b,e,h) conditions and respective merged images (c,f,i) from the distal (blind end, (ac), middle, (df)) and proximal (gi) portions. hd, hindgut; MTs, Malpighian tubules. Scale bar = 200 μm.
Figure 6
Figure 6
Pairs of typical AF emission spectra recorded from the proximal and distal portions of MTs dissected from the different samples of Ae. albopictus, as identified in each graph title. SF, sugar-fed; BF, blood-fed; MTs, Malpighian tubules. For each graph, MT proximal and distal portions are identified by colors, as shown in the legend on the right. Spectra are normalized to 100 a.u. at the maximum peak position for an easy appreciation of the relative changes in the emission profile.
Figure 7
Figure 7
Typical examples of AF emission spectra of the proximal (A) or distal (B) portions of the MTs dissected from the different types of samples, as identified by colors, on the right. Spectra are normalized to 100 a.u. at the maximum peak position for an easy appreciation of the relative changes in the emission profile. Bar charts represent the real values (means ± S.E.) estimated from the AF emission spectra of proximal (C) or distal (D) portions of the MTs dissected from different types of samples, as identified in the x axis title. SF, sugar-fed; BF, blood-fed. Statistical analysis: significant differences (p < 0.05) in the case of male vs. larvae, pupae and female-BF, as well as female-SF vs. larvae, pupae and female-BF, only in the distal portion.
Figure 8
Figure 8
Autofluorescence confocal images of the distal portion of MTs isolated from Ae. albopictus fourth instar larvae administered with tryptophan (2 h, 4 h, 5-day treatment). Images recorded under the “Cyan” (a,d,g) and “Red” (b,e,h) conditions and respective merged images (c,f,i). Scale bar = 200 μm.
Figure 9
Figure 9
Autofluorescence confocal images of the proximal portion of MTs isolated from Ae. albopictus fourth instar larvae administered with tryptophan (2 h, 4 h, 5-day treatment). Images recorded under the “Cyan” (a,d,g) and “Red” (b,e,h) conditions and respective merged images (c,f,i). Scale bar = 200 μm.
Figure 10
Figure 10
Typical examples of AF emission spectra of the proximal (A) or distal (B) portions of the MTs dissected from Ae. albopictus fourth instar larvae administered with tryptophan (2 h, 4 h, 5-day treatment), as identified by colors, on the right. Spectra are normalized to 100 a.u. at the maximum peak position for an easy appreciation of the relative changes in the emission profile. Bar charts represent the real values (means ± S.E.) estimated from the AF emission spectra of proximal (C) or distal (D) portions of the MTs dissected from different type of samples, as identified in the x axis title. Statistical analysis: significant differences (p < 0.05) in the case of larvae reared under standard conditions vs. tryptophan-administered larvae, at all time points, only in the MT distal portion; 5-day tryptophan-administered larvae vs. all the other samples, only in the MT distal portion.

Similar articles

Cited by

  • In situ detection of ferric reductase activity in the intestinal lumen of an insect.
    Hernández-Gallardo AK, Arcos-López T, Bahena-Lopez JM, Tejeda-Guzmán C, Gallardo-Hernández S, Webb SM, Kroll T, Solari PL, Sánchez-López C, Den Auwer C, Quintanar L, Missirlis F. Hernández-Gallardo AK, et al. J Biol Inorg Chem. 2024 Dec;29(7-8):773-784. doi: 10.1007/s00775-024-02080-y. Epub 2024 Dec 1. J Biol Inorg Chem. 2024. PMID: 39617837 Free PMC article.

References

    1. Farina P., Bedini S., Conti B. Multiple functions of Malpighian tubules in insects: A review. Insects. 2022;13:1001. doi: 10.3390/insects13111001. - DOI - PMC - PubMed
    1. Cohen E., Sawyer J.K., Peterson N.G., Dow J.A.T., Fox D.T. Physiology, development, and disease modeling in the Drosophila excretory system. Genetics. 2020;214:235–264. doi: 10.1534/genetics.119.302289. - DOI - PMC - PubMed
    1. Piermarini P.M., Gillen C.M. Non-traditional models: The molecular physiology of sodium and water transport in mosquito Malpighian tubules. In: Hyndman K., Pannabecker T., editors. Sodium and Water Homeostasis. Springer; New York, NY, USA: 2015. pp. 255–278.
    1. Xu J., Liu Y., Li H., Tarashansky A.J., Kalicki C.H., Hung R.J., Hu Y., Comjean A., Kolluru S.S., Wang B., et al. Transcriptional and functional motifs defining renal function revealed by single-nucleus RNA sequencing. Proc. Natl. Acad. Sci. USA. 2022;119:e2203179119. doi: 10.1073/pnas.2203179119. - DOI - PMC - PubMed
    1. Beyenbach K.W., Skaer H., Dow J.A.T. The developmental, molecular, and transport biology of Malpighian tubules. Annu. Rev. Entomol. 2010;55:351–374. doi: 10.1146/annurev-ento-112408-085512. - DOI - PubMed

Supplementary concepts

LinkOut - more resources