

The miRNAs let-7b and miR-141 Coordinately Regulate Vitellogenesis by Modulating Methyl Farnesoate Degradation in the Swimming Crab Portunus trituberculatus
- PMID: 38203450
- PMCID: PMC10778691
- DOI: 10.3390/ijms25010279
The miRNAs let-7b and miR-141 Coordinately Regulate Vitellogenesis by Modulating Methyl Farnesoate Degradation in the Swimming Crab Portunus trituberculatus
Abstract
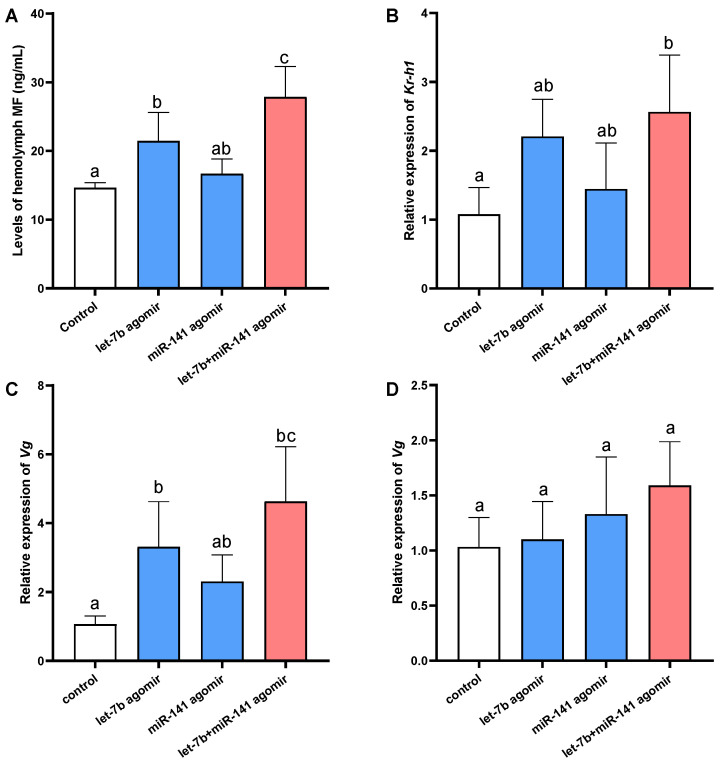
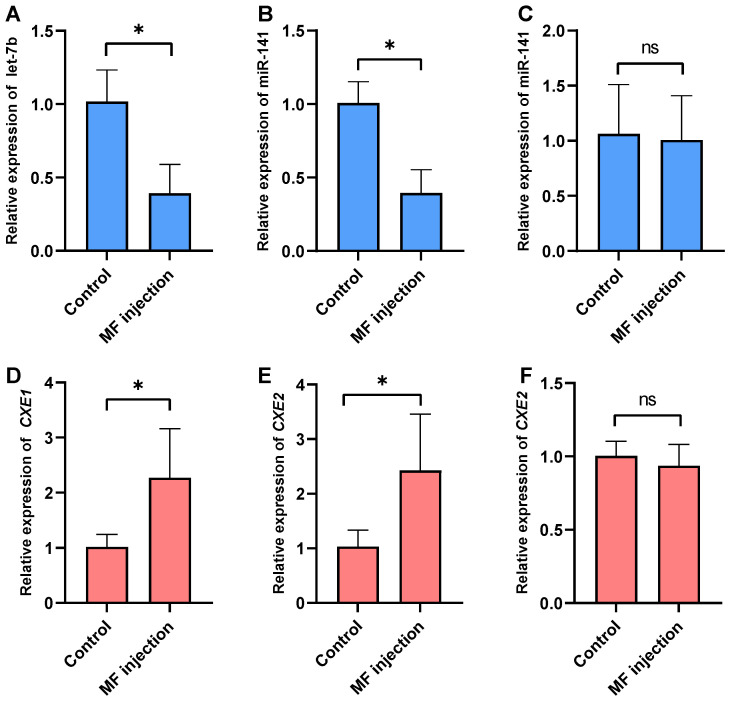
Methyl farnesoate (MF), a crucial sesquiterpenoid hormone, plays a pivotal role in the reproduction of female crustaceans, particularly in the vitellogenesis process. Despite extensive research on its functions, the molecular mechanisms that regulate MF levels during the vitellogenic phase remain largely elusive. This study investigates the roles of microRNAs (miRNAs), significant post-transcriptional regulators of gene expression, in controlling MF levels in the swimming crab Portunus trituberculatus. Through bioinformatic analysis, four miRNAs were identified as potential regulators targeting two genes encoding Carboxylesterases (CXEs), which are key enzymes in MF degradation. Dual luciferase reporter assays revealed that let-7b and miR-141 suppress CXE1 and CXE2 expression by directly binding to their 3' UTRs. In vivo overexpression of let-7b and miR-141 significantly diminished CXE1 and CXE2 levels, consequently elevating hemolymph MF and enhancing vitellogenin expression. Spatiotemporal expression profile analysis showed that these two miRNAs and their targets exhibited generally opposite patterns during ovarian development. These findings demonstrate that let-7b and miR-141 collaboratively modulate MF levels by targeting CXEs, thus influencing vitellogenesis in P. trituberculatus. Additionally, we found that the expression of let-7b and miR-141 were suppressed by MF, constituting a regulatory loop for the regulation of MF levels. The findings contribute novel insights into miRNA-mediated ovarian development regulation in crustaceans and offer valuable information for developing innovative reproduction manipulation techniques for P. trituberculatus.
Keywords: crab; methyl farnesoate; miRNA; ovary; vitellogenesis.
Conflict of interest statement
The authors declare no conflicts of interest.
Figures


Similar articles
-
Role of Kruppel homolog 1 (Kr-h1) in methyl farnesoate-mediated vitellogenesis in the swimming crab Portunus trituberculatus.Gene. 2018 Dec 30;679:260-265. doi: 10.1016/j.gene.2018.08.046. Epub 2018 Sep 4. Gene. 2018. PMID: 30189269
-
Molecular characterization of methoprene-tolerant gene (Met) in the swimming crab Portunus trituberculatus: Its putative role in methyl farnesoate-mediated vitellogenin transcriptional activation.Anim Reprod Sci. 2016 Nov;174:132-142. doi: 10.1016/j.anireprosci.2016.09.017. Epub 2016 Sep 29. Anim Reprod Sci. 2016. PMID: 27707520
-
Cloning of two carboxylesterase cDNAs from the swimming crab Portunus trituberculatus: Molecular evidences for their putative roles in methyl farnesotae degradation.Comp Biochem Physiol B Biochem Mol Biol. 2017 Jan;203:100-107. doi: 10.1016/j.cbpb.2016.10.001. Epub 2016 Oct 5. Comp Biochem Physiol B Biochem Mol Biol. 2017. PMID: 27720728
-
Molecular cloning, characterization and expression analysis of two juvenile hormone esterase-like carboxylesterase cDNAs in Chinese mitten crab, Eriocheir sinensis.Comp Biochem Physiol B Biochem Mol Biol. 2017 Mar;205:46-53. doi: 10.1016/j.cbpb.2017.01.002. Epub 2017 Jan 8. Comp Biochem Physiol B Biochem Mol Biol. 2017. PMID: 28077333
-
Juvenile hormone and sesquiterpenoids in arthropods: Biosynthesis, signaling, and role of MicroRNA.J Steroid Biochem Mol Biol. 2018 Nov;184:69-76. doi: 10.1016/j.jsbmb.2018.01.013. Epub 2018 Feb 3. J Steroid Biochem Mol Biol. 2018. PMID: 29355708 Review.
Cited by
-
Functional Study of the Role of the Methyl Farnesoate Epoxidase Gene in the Ovarian Development of Macrobrachium nipponense.Int J Mol Sci. 2024 Jul 3;25(13):7318. doi: 10.3390/ijms25137318. Int J Mol Sci. 2024. PMID: 39000423 Free PMC article.
References
-
- Subramoniam T. Mechanisms and Control of Vitellogenesis in Crustaceans. Fish. Sci. 2011;77:1–21. doi: 10.1007/s12562-010-0301-z. - DOI
-
- Laufer H., Sagi A., Ahl J., Homola E. Methyl Farnesoate Appears to Be a Crustacean Reproductive Hormone. Invertebr. Reprod. Dev. 1992;22:17–19. doi: 10.1080/07924259.1992.9672252. - DOI
-
- Nagaraju G.P.C. Is Methyl Farnesoate a Crustacean Hormone? Aquaculture. 2007;272:39–54. doi: 10.1016/j.aquaculture.2007.05.014. - DOI
-
- Wainwright G., Prescott M., Rees H., Webster S. Mass Spectrometric Determination of Methyl Farnesoate Profiles and Correlation with Ovarian Development in the Edible Crab, Cancer pagurus. J. Mass Spectrom. 1996;31:1338–1344. doi: 10.1002/(SICI)1096-9888(199612)31:12<1338::AID-JMS428>3.0.CO;2-A. - DOI
MeSH terms
Substances
Grants and funding
LinkOut - more resources
Full Text Sources
