. 2023 Dec 25;25(1):299.
doi: 10.3390/ijms25010299.

RanBP2/Nup358 Mediates Sumoylation of STAT1 and Antagonizes Interferon-α-Mediated Antiviral Innate Immunity

Affiliations

RanBP2/Nup358 Mediates Sumoylation of STAT1 and Antagonizes Interferon-α-Mediated Antiviral Innate Immunity

Jiawei Li et al. Int J Mol Sci. .

Abstract

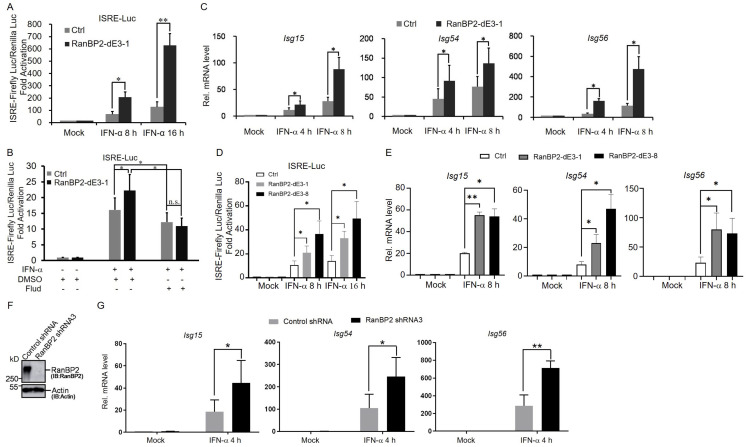
Type I interferon (IFN-I)-induced signaling plays a critical role in host antiviral innate immune responses. Despite this, the mechanisms that regulate this signaling pathway have yet to be fully elucidated. The nucleoporin Ran Binding Protein 2 (RanBP2) (also known as Nucleoporin 358 KDa, Nup358) has been implicated in a number of cellular processes, including host innate immune signaling pathways, and is known to influence viral infection. In this study, we documented that RanBP2 mediates the sumoylation of signal transducers and activators of transcription 1 (STAT1) and inhibits IFN-α-induced signaling. Specifically, we found that RanBP2-mediated sumoylation inhibits the interaction of STAT1 and Janus kinase 1 (JAK1), as well as the phosphorylation and nuclear accumulation of STAT1 after IFN-α stimulation, thereby antagonizing the IFN-α-mediated antiviral innate immune signaling pathway and promoting viral infection. Our findings not only provide insights into a novel function of RanBP2 in antiviral innate immunity but may also contribute to the development of new antiviral therapeutic strategies.

Keywords: RanBP2; STAT1; innate immunity; interferon; sumoylation; viral infection.


Conflict of interest statement

The authors declare no conflict of interest. The funders had no role in the design of the study; in the collection, analyses, or interpretation of data; in the writing of the manuscript; or in the decision to publish the results.

Figures

Figure 1
Figure 1
RanBP2 mediates lysine 703 sumoylation of STAT1 in cells. (A,B) WT U2OS and RanBP2-dE3 cells were co-transfected with plasmids expressing Flag tagged STAT1 (STAT1-Flag) and His-tagged SUMO2 (His6-SUMO2 “+”) or control vector (His6-SUMO2 “−”). Twenty-four hours post-transfection, cells were lysed in 6 M guanidinium chloride, and the His6-SUMO2 conjugates were isolated on nickel beads (“Ni2+ NTA PD”) or the lysates were directly analyzed (“input”) and separated by SDS-PAGE. Conjugates were analyzed for the presence of His6-SUMO2-STAT1-Flag by immunoblotting for Flag (IB: Flag), and for total His6-SUMO2 conjugates by immunoblotting for His (IB: His). Input lysates were immunoblotted with antibodies against STAT1-Flag, His6-SUMO2, RanBP2 and GAPDH. Ni2+-purified His6-SUMO2 Conjugates and GAPDH protein levels were quantified using densitometric analysis and the ratio of His6-SUMO2 Conjugates/GAPDH (normalized to Ctrl cells) was indicated below relative blots (A). The isolated His6-SUMO2-STAT1-Flag and STAT1-Flag (input) protein levels were quantified using densitometric analysis and the ratio of His6-SUMO2-STAT1-Flag/STAT1-Flag was normalized to WT U2OS cells and plotted, with each bar representing the average of two independent experiments ± SEM (B). (C,D) Unmodified (Ctrl) and RanBP2-dE3-1 HEK293 cells were co-transfected with plasmids expressing His6-SUMO2 and STAT1-Flag (lanes 2 and 4), or transfected with plasmids expressing His6-SUMO2 (lanes 1 and 3, negative control). Cell lysates were immunoprecipitated with anti-Flag antibody (IP: Flag) or were directly analyzed (Input) and separated by SDS-PAGE. Samples were analyzed by immunoblotting using different antibodies as indicated, respectively, (C). The precipitated His6-SUMO2-STAT1-Flag and STAT1-Flag (input) protein levels were quantified using densitometric analysis and the ratio of His6-SUMO2-STAT1-Flag/STAT1-Flag was normalized to Ctrl cells and plotted, with each bar representing the average of two independent experiments ± SEM (D). (E) WT U2OS and RanBP2-dE3 cells were co-transfected with plasmids expressing Flag tagged STAT1 (STAT1-Flag) or a lysine 703 to arginine mutant STAT1 (STAT1K703R-Flag) together with His-tagged SUMO2 (His6-SUMO2 “+”) or control vector (His6-SUMO2 “−”). Twenty-four hour post-transfection cells were lysed in 6 M guanidinium chloride, and the His6-SUMO2 conjugates were isolated on nickel beads (“Ni2+ NTA PD”) or the lysates were directly analyzed (“Input”) and separated by SDS-PAGE. Conjugates were analyzed for the presence of His6-SUMO2-STAT1-Flag by immunoblotting for Flag (IB: Flag), and for His6-SUMO2 by immunoblotting for His (IB: His). Input lysates were immunoblotted with antibodies against STAT1-Flag, RanBP2, RanGAP1, His6-SUMO2, and tubulin. (F) The isolated His6-SUMO2-STAT1-Flag and His6-SUMO2 protein levels were quantified using densitometric analysis and the ratio of His6-SUMO2-STAT1-Flag/His6-SUMO2 was normalized to WT U2OS cells transfected with STAT1-Flag and plotted, with each bar representing the average of three independent experiments ± SEM, * p < 0.05, ** p < 0.01, n.s. indicates no significant difference (Student’s t-test). The numbers on the left of each blot indicate the molecular masses of marker proteins in kilodaltons.
Figure 2
Figure 2
RanBP2 inhibits IFN-α-mediated antiviral innate immunity. (A) Unmodified (Ctrl) and RanBP2-dE3-1 cells were co-transfected with 200 ng ISRE-Luc and 50 ng pRL-TK for 24 h, and then mock treated (Mock), or treated with exogenous IFN-α (1000 U/mL) for another 8 h or 16 h and then subjected to dual luciferase assays. Firefly and Renilla luciferase luminescence were measured, and the ratio was normalized to the Ctrl cell line without IFN-α stimulation. Each bar represents the average of three independent experiments ± SD. (B) The effect of STAT1 inhibitor fludarabine (Flud) on the activation of ISRE promoters in Ctrl and RanBP2-dE3-1 cells. Unmodified (Ctrl) and RanBP2-dE3-1 cells were co-transfected with 200 ng ISRE-Luc and 50 ng pRL-TK for 24 h, and then mock treated (DMSO) or treated with exogenous IFN-α (1000 U/mL) alone or together with Flud (50 μM) for another 8 h and then subjected to dual luciferase assays. Firefly and Renilla luciferase luminescence were measured, and the ratio was normalized to the Ctrl cell line without IFN-α stimulation. Each bar represents the average of three independent experiments ± SD. (C) Ctrl and RanBP2-dE3-1 cells were mock treated (Mock) or treated with exogenous IFN-α (1000 U/mL) for 4 h or 8 h and then subjected to RT-qPCR analysis to detect mRNA levels of Isg15, Isg54 and Isg56. The amount of each Isg mRNA was normalized to the Ctrl cell line without IFN-α stimulation (Mock). Each bar represents the average of four independent experiments ± SD. (D) Unmodified (Ctrl), RanBP2-dE3-1 and RanBP2-dE3-8 cells were co-transfected with 200 ng of ISRE-Luc and 50 ng pRL-TK for 24 h, and then mock treated (Mock) or treated with exogenous IFN-α (1000 U/mL) for another 8 h or 16 h and then subjected to dual luciferase assays. Firefly and Renilla luciferase luminescence were measured, and the ratio was normalized to the Ctrl cell line without IFN-α stimulation. Each bar represents the average of three independent experiments ± SD. (E) Ctrl, RanBP2-dE3-1 and RanBP2-dE3-8 cells were mock treated (Mock), or treated with exogenous IFN-α (1000 U/mL) for 8 h and then subjected to RT-qPCR analysis to detect mRNA levels of Isg15, Isg54 and Isg56. The amount of each Isg mRNA was normalized to the Ctrl cell line without IFN-α stimulation (Mock). Each bar represents the average of three independent experiments ± SD. (F) THP-1 cells were infected with lentivirus containing shRNA3 directed against RanBP2, or scrambled shRNA (“control shRNA”). Four days post-infection, cell lysates were collected and analyzed by Western blotting using antibodies against RanBP2 and actin. The numbers on the left of each blot indicate the molecular masses of marker proteins in kilodaltons. (G) Control shRNA- and RanBP2 shRNA3-treated THP-1 cells were mock treated (Mock) or treated with exogenous IFN-α (1000 U/mL) for 4 h and then subjected to RT-qPCR analysis to detect mRNA levels of Isg15, Isg54 and Isg56. The amount of each Isg mRNA in different samples was normalized to the Ctrl cell line without IFN-α stimulation (Mock). Each bar represents the average of three independent experiments ± SD. * p < 0.05, ** p < 0.01, n.s. indicates no significant difference (Student’s t-test).
Figure 3
Figure 3
RanBP2 inhibits STAT1 phosphorylation after IFN-α stimulation by impairing the interaction between STAT1 and JAK1. (A,B) Identification of the interaction between RanBP2 and STAT1 in cells by co-immunoprecipitation (Co-IP). HEK293 cells were transfected with plasmids expressing STAT1-Flag, or empty vector, respectively. Cells were harvested and subjected to Co-IP assays. Cell lysates were separately immunoprecipitated with anti-Flag antibody (A) or anti-RanBP2 antibody (with Rabbit IgG as a negative control for IP) (B). Samples before (input) and after (IP) immunopurification were analyzed by immunoblot using anti-RanBP2, anti-Flag or anti-actin antibody, respectively. (C) The effect of IFN-α stimulation on the sumoylation of STAT1 mediated by RanBP2. Unmodified (Ctrl), and RanBP2-dE3-1 cells were co-transfected with plasmids expressing His6-SUMO2 and STAT1-Flag (lanes 3, 5, 6 and 7), or transfected with plasmids expressing either STAT1-Flag (lane 1) or His6-SUMO2 (lanes 2 and 4) alone as negative controls for 24 h, and cells were treated with 1000 U/mL IFN-α (lanes 6 and 7) for 30 min before harvesting. Cell lysates were immunoprecipitated with anti-Flag antibody (IP: Flag) or were directly analyzed (Input) and separated by SDS-PAGE. Samples were analyzed by immunoblotting using different antibodies as indicated, respectively. The precipitated His6-SUMO2-STAT1-Flag, the co-immunoprecipitated RanBP2 (IP RanBP2), the phosphorylated STAT1-Flag (pSTAT1-Flag), STAT1-Flag (input) and actin protein levels were quantified using densitometric analysis and the ratio of His6-SUMO2-STAT1-Flag/STAT1-Flag, IP RanBP2/actin, or pSTAT1-Flag/STAT1-Flag was indicated below relative blots. (D,E) Effect of RanBP2 on the phosphorylation of STAT1 induced by IFN-α. Unmodified (Ctrl) and RanBP2-dE3-1 cells were mock treated (lanes 1 and 2) or treated with 1000 U/mL IFN-α (lanes 3 and 4) for 30 min before harvesting. Cell lysates were analyzed by immunoblotting using anti-pSTAT1, anti-STAT1, anti-pSTAT2, anti-STAT2, anti-RanBP2, anti-RanGAP1 and anti-tubulin antibodies, respectively, (D). The pSTAT1, STAT1, pSTAT2 and STAT2 protein levels were quantified using densitometric analysis and the ratio of pSTAT1/STAT1, or pSTAT2/STAT2 was normalized to Ctrl cells with IFN-α treatment and plotted, with each bar representing the average of three independent experiments ± SD (E). (F) Effect of RanBP2 on the phosphorylation of STAT1 induced by IFN-β. Unmodified (Ctrl), RanBP2-dE3-1 and RanBP2-dE3-8 cells overexpressing Flag-STAT1 were mock treated (lanes 1 to 3) or treated with 1000 U/mL IFN-β (lanes 5 to 7) for 30 min before harvesting. Cell lysates were analyzed by immunoblotting using anti-pSTAT1, anti-STAT1, anti-RanBP2, anti-RanGAP1 and anti-tubulin antibodies, respectively. The Flag-pSTAT1, pSTAT1 and STAT1 protein levels were quantified using densitometric analysis and the ratio of Flag-pSTAT1/tubulin or pSTAT1/tubulin was normalized to Ctrl cells with IFN-β treatment and are indicated below relative blots. (G,H) RanBP2 impairs the interaction between STAT1 and JAK1 induced by IFN-α. Unmodified (Ctrl) and RanBP2-dE3-1 cells were mock treated (lane 1) or treated with 1000 U/mL IFN-α (lanes 2, 3 and 4) for 30 min before harvesting. Cell lysates were separately immunoprecipitated with either mouse anti-JAK1 antibody (lanes 1, 3 and 4), or mouse IgG (lane 2) as a negative control. Samples before (Input) and after (IP) immunopurification were separated by SDS-PAGE and analyzed by immunoblotting using anti-STAT1, anti-JAK1, anti-RanBP2, anti-pSTAT1, anti-RanGAP1 and anti-tubulin antibodies, respectively. pSTAT1 and STAT1 (input) protein levels were quantified using densitometric analysis and the ratio of pSTAT1/STAT1 is indicated below relative blots (G). The protein levels of STAT1 (IP) co-immunoprecipitated with JAK1 and Tubulin were quantified using densitometric analysis and the ratio of STAT1 (IP)/Tubulin was normalized to Ctrl cells with IFN-α treatment and plotted, with each bar representing the average of two independent experiments ± SD (H). ** p < 0.01, ns indicates no significant difference (Student’s t-test). The numbers on the left of each blot indicate the molecular masses of marker proteins in kilodaltons.
Figure 4
Figure 4
RanBP2 inhibits STAT1 accumulation in the nucleus induced by IFN-α. (A,B) Unmodified (Ctrl) and RanBP2-dE3-1 HEK293 cells were treated with 1000 U/mL IFN-α for 30 min before harvesting. Cells were fractionated into cytoplasmic (Cyto) (A) and nuclear (Nuc) (B) fractions. Samples were separated by SDS-PAGE and immunoblotted for pSTAT1, tubulin (cytosolic marker), histone H3 (nuclear marker), and RanBP2. The numbers on the left of each blot indicate the molecular masses of marker proteins in kilodaltons. (C) The pSTAT1 protein levels induced by IFN-α in the cytoplasm and the nucleus in (A,B) were quantified using densitometric analysis and the ratio of cytoplasmic pSTAT1/tubulin or nuclear pSTAT1/histone H3 was normalized to each Ctrl cells with IFN-α treatment and plotted, with each bar representing the average of three independent experiments ± SD. (D) Unmodified (Ctrl) and RanBP2-dE3-1 cells were treated with 1000 U/mL IFN-α for 30 min and then fixed and immunostained for STAT1 (red). Nuclear morphology was visualized using 4′,6-diamidino-2-phenylindole (DAPI, blue). The images were obtained by epifluorescence microscopy. STAT1 and DAPI signals are merged in the right panels. Scale bar = 10 μm. (E,F) Line scan graphs of the representative cells (E) and the Nuc/Cyto ratio of STAT1 intensity quantification of line scan graphs for STAT1 (F) are also shown. Error bars indicate SD, n > 60 cells from two replicates. (G) Unmodified (Ctrl), RanBP2-dE3-1 and RanBP2-dE3-8 cells overexpressing Flag-STAT1 were treated with 1000 U/mL IFN-β for 30 min and then fixed and immunostained for Flag-STAT1 (green). Nuclear morphology was visualized using 4′,6 diamidino 2 phenylindole (DAPI, blue). The images were obtained by epifluorescence microscopy. Flag-STAT1 and DAPI signals are merged in the right panels. Scale bar = 30 μm. (H,I) Line scan graphs of the representative cells (H) and the Nuc/Cyto ratio of Flag-STAT1 intensity quantification of line scan graphs for Flag-STAT1 (I) are also shown. Error bars indicate SD, n > 30 cells from two replicates. ** p < 0.01, **** p < 0.0001, n.s. indicates no significant difference (Student’s t-test for (C) and Mann–Whitney test for (F,I)).
Figure 5
Figure 5
RanBP2 promotes viral infection by impairing IFN-α-induced antiviral innate immunity. Unmodified (Ctrl) and RanBP2-dE3-1 HEK293 cells were treated with 1000 U/mL IFN-α or with medium only (Mock) for 8 h, and then infected with HSV-1-GFP (AC) or VSV-GFP (DF) at an MOI of 0.2 for 16 h. The infected cells were observed for GFP expression as an indication of HSV-1 and VSV infection. Viral infection was analyzed by fluorescence microscopy (A,D) and flow cytometry (B,C,E,F). Representative images of virus infected (GFP-positive) cells were obtained by epifluorescence microscopy (A,D). The percentage of virus infected (GFP-positive) cells in (A,D) were quantified by flow cytometry (B,E) and plotted (C,F) with each bar representing the average of three independent experiments ± SEM. Gated regions (GFP-negative and GFP-positive) are indicated by black bars (B). Scale bar = 100 μm, * p < 0.05, ** p < 0.01, n.s. indicates no significant difference (Student’s t-test).
Figure 6
Figure 6
Model for the molecular mechanism of how RanBP2 antagonizes IFN-I-mediated antiviral innate immunity by sumoylating STAT1. P, phosphorylation; S, sumoylation. Arrows represent activation and T lines represent repression.

Similar articles

Cited by

References

    1. Yokoyama N., Hayashi N., Seki T., Panté N., Ohba T., Nishii K., Kuma K., Hayashida T., Miyata T., Aebi U., et al. A Giant Nucleopore Protein That Binds Ran/TC4. Nature. 1995;376:184–188. doi: 10.1038/376184a0. - DOI - PubMed
    1. Wu J., Matunis M.J., Kraemer D., Blobel G., Coutavas E. Nup358, a Cytoplasmically Exposed Nucleoporin with Peptide Repeats, Ran-GTP Binding Sites, Zinc Fingers, a Cyclophilin A Homologous Domain, and a Leucine-Rich Region. J. Biol. Chem. 1995;270:14209–14213. doi: 10.1074/jbc.270.23.14209. - DOI - PubMed
    1. Walther T.C., Pickersgill H.S., Cordes V.C., Goldberg M.W., Allen T.D., Mattaj I.W., Fornerod M. The Cytoplasmic Filaments of the Nuclear Pore Complex Are Dispensable for Selective Nuclear Protein Import. J. Cell Biol. 2002;158:63–77. doi: 10.1083/jcb.200202088. - DOI - PMC - PubMed
    1. Sahoo M.R., Gaikwad S., Khuperkar D., Ashok M., Helen M., Yadav S.K., Singh A., Magre I., Deshmukh P., Dhanvijay S., et al. Nup358 Binds to AGO Proteins through Its SUMO-Interacting Motifs and Promotes the Association of Target mRNA with miRISC. EMBO Rep. 2017;18:241–263. doi: 10.15252/embr.201642386. - DOI - PMC - PubMed
    1. Mavlyutov T.A., Cai Y., Ferreira P.A. Identification of RanBP2- and Kinesin-Mediated Transport Pathways with Restricted Neuronal and Subcellular Localization. Traffic Cph. Den. 2002;3:630–640. doi: 10.1034/j.1600-0854.2002.30905.x. - DOI - PubMed